Cumulative distribution Function (CDF) for retrieving the medical images from the database is discussed. This method can provide considerable reduction in the ...
International Journal of Computer Applications (0975 – 8887) Volume 81 – No 18, November 2013
Content based Image Retrieval based on Cumulative Distribution Function – A Performance Evaluation Harishchandra Hebbar
Niranjan U.C
Sumanth Mushigeri
School of Information Sciences Manipal University Manipal, INDIA
Manipal Dot Net Ananth Nagar Manipal, INDIA
School of Information Sciences Manipal University Manipal, INDIA
ABSTRACT Content Based Image Retrieval (CBIR) is very much sought after field in the area image retrieval. CBIR finds applications in areas such as web searching, crime detection, military, intellectual property and medical diagnosis. With the advancement of medical imaging modalities, focus on the diagnosis has shifted from physician centric to hospital based diagnosis where, image analysis & interpretation is the key factor in diagnosis. With the image acquisition becoming digital there is greater need to interpret the medical images in quick and accurate manner. In this paper an image matching technique based on Cumulative distribution Function (CDF) for retrieving the medical images from the database is discussed. This method can provide considerable reduction in the image retrieval time while providing flexibility to the physician. The physician can select suitable number of CDF line segments for comparison and the percentage of CDF threshold as desired by him there by providing control in terms of Precision (P) and retrieval time (Tr).
Keywords Cumulative Distribution Function, Precision, Recall, Retrieval time, Hierarchical Cumulative Distribution Function
1. INTRODUCTION In order to provide efficient patient care many hospitals are implementing Picture Archival and Communication Systems (PACS) now a day. In a practical scenario mid-sized hospitals cannot afford to have the PACS due to the initial investment which is quite huge. These hospitals can have the services of PACS through a Wide Area Network (WAN). Size of the medical image being very large, transmission of these images to a distant healthcare setup is limited by the bandwidth of the Wide Area Network (WAN) or Internet. The image viewing at a remote station will be a very slow process and likely to cause severe delay which is could be a great concern for a physicians if he/she wants to view these images before treatment. Hence it is necessary to have an efficient Content Based Image Retrieval System which is user friendly, user definable, accurate and fast. CBIR has been an active research area for the past 15 – 20 years. The initial review articles about CBIR were available during 1980s [1]. A comprehensive article on image retrieval in terms of ideas, influences and trends are explained by Ritendra Duttaa [2]. The article reviews increase in the publications in the area of image retrieval between the years 1995 – 2005 provides the interest by the research community in this direction. The article also provides different types of image similarity measures, their mathematical formulations and computing techniques. Ying Liu [3] explains image
retrieval based on the high level semantics of the image. H.B.Kekre [4] provides insight based on the features such as distance measures, K-nearest neighbor algorithm to measure the performance. When it comes to medical images, the low level features such as intensity / color, shape and texture are more important than the semantics of the image. These low level features may not be visible for diagnosis by physicians due various factors such as the background noise and image quality. Histogram based retrieval is the most commonly used technique as it provides variations of the intensity pixels over a range from 0 – 255 levels of gray. These 256 levels can be further reduced into various bins for the quick comparisons sacrificing the precision to that extent. While dealing with the color images, techniques involving RGB and HSV color space are used as explained by Deselaers [5]. Lining Zang [6] uses HSV color space. In this article hue and saturation values are quantized into bins for comparison. Rehman.M.H. [7] uses rotation invariant Gabor features for texture based analysis. Saptadi [8] uses Zernike moments and R-Tree for rotation invariant indexing. Color moments and GLCM features are employed by Felci Rajam [9]. An effective method for color image retrieval based on the texture has been described by Wang Xing [10]. Henning Muller [11] in his review article brings out the need for an efficient medical image retrieval application with reference to large number of imaging modalities being used for the patient care in tertiary hospitals. The article lists out some of commercially developed systems such as Query by Image Content (QBIC), Virage, Candid, Photobook and Netra. Some the freely available application such as GNU Image Finding Tool Kit (GIFT) being mentioned in the article. Manjunath K N [12] , [14] brings out the advantages of implementing CDF based on the least square line fitting method. The article mentions the advantages of CDF method in case of registration difficulties.
2. PERFORMANCE MEASURES OF A CBIR SYSTEM Researchers have used various performance measures such as error rate, retrieval efficiency, precision and recall graphs for their developed systems. However the most common evaluation measures used in Content Based Image Retrieval (CBIR) are Retrieval Time (Tr), Precision (P) and Recall (R).
Retrieval time (Tr): This is the time taken by the CBIR system to retrieve and display the similar images from the data base to that of the query image.
16
International Journal of Computer Applications (0975 – 8887) Volume 81 – No 18, November 2013 lines to approximate, gives us a fairly good approximation of the original curve.
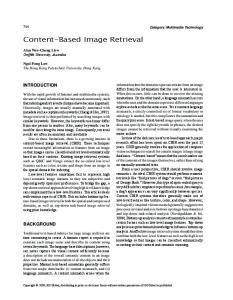
3. DEFINING RELEVANT IMAGE SET The above definition requires relevant images in order to determine precision and recall parameters of a system being developed. A relevant image set can be defined as the set of images which are ± 9 closer images to that of the reference image as shown in Fig.1. Image number 14 in Fig.1 is the query image (image of interest) and 18 closest matching images can be considered as the relevant set for the query image 14. For example brain0000.jpg - brain0750.jpg are the continuous scan of the brain images and if image number 14 is the query image, then the “relevant image set” can be defined as the collection of images numbers from 5 to 23. This results in a relevant set of 18 images.
4. CUMULATIVE DISTRIBUTION FUNCTION The Cumulative Distribution Function cdf (i) upto the gray level ‘i’ is given by:
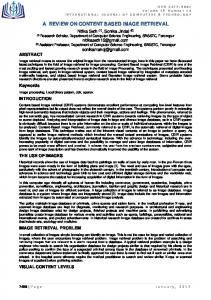
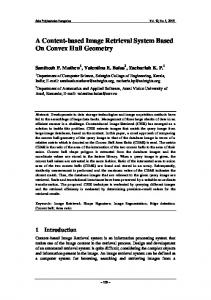
Figure 2 shows the CDF of the image approximated with 4 line segments (p =2) whose CDF value varies between 0 and 255 in 4 equally spaced intervals. The X- axis represents values of the intensities 63, 127, 191 and 255. The Y – axis represents the CDF values at those intensity points. It can also observed that the final values of the CDF is always “1” and the slope of the line segments depends on the number of pixels in that intensity region. Figure 3 shows the CDF image with 4 line segments and CDF calculated for all the 256 points (i.e. from 0 to 255). Results of the query image brain0014.jpg (without prestored CDF values) Table 1 p
(Tr) in seconds
(P)
(R)
0
32.467
0.75
0.5
1
32.4155
0.667
0.444
2
32.4107
1
0.667
3
32.4182
1
0.667
4
32.5182
1
0.667
5
32.5178
1
0.667
6
32.5198
1
0.667
7
32.5323
1
0.667
8
32.6371
1
0.667
Where,
h (j) is the normalized histogram at gray level j nj is the number of pixels with gray level j M.N is the size / dimension of the image (where M indicates number pixels in a row and N indicates number of column pixels)
The CDF contains the same information as that of the histogram, but in different form. While histogram indicates number of pixels of a particular intensity, it does not indicate the spatial intensity distribution. CDF has two important properties. a)
b)
It is a continuously increasing quantity which allows approximation of the CDF curve with just a first order curve. It has always a dynamic range between 0 and 1(irrespective of the dimension of the image) which allows one to fit piecewise linear models on CDFs of image of any size.
While histogram reduces the gray level image of dimension M x N to 256, CDF further reduces the dimensionality of the image features from 256 to 2p, (where “p” varies from 0, 1,…..8). 2p is the number of lines approximating the CDF. For the value of p=2, the query image is compared with the image in the database with 4 number of lines (4 equal spaced intervals between 0 and 255). The highest value of p is 8, which results in 256 comparison points for a gray scale image whose intensity varies from 0 to 255. The query and database images are thus compared based on the 2p line parameters (slope and intercept), reducing the computational burden significantly.
The retrieval time (Tr) tabulated in the Table 1 is dependant on the number of images dynamically compared in the database. The above results is for a database of 1720 medical images. It can also observed that, for the values of p greater than 1 (the CD F of the image is represented by 2 line segments) the values of precision (P) and recall (R) remains to be constant for values of p greater than 1.
The content based image retrieval algorithm described above approximates the CDF of the intensity distribution using multiple lines. The following results establish the fact that using more number of lines to approximate the CDF yields a better line fitting of the curve. It is observed that using 8 or 16
17
International Journal of Computer Applications (0975 – 8887) Volume 81 – No 18, November 2013 Results of the query image brain0014.jpg (with pre-stored CDF values) Table 2
p
(Tr) in seconds
Precision (P)
Recall (R)
0
0.21567
0.75
0.5
1
0.223527
0.667
0.444
2
0.229705
1
0.667
3
0.234631
1
0.667
4
0.25632
1
0.667
5
0.27568
1
0.667
6
0.32327
1
0.667
7
0.41207
1
0.667
8
0.61504
1
0.667
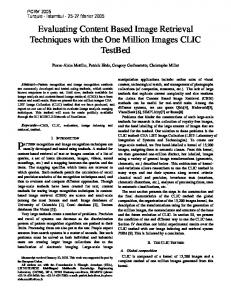
Results of CDF based Matching Figure 4 and Fig 5 shows the retrieved images for the query image brain0014.jpg for p=2 and p=8. The results of the images for values p ranging from 0 to 8 are tabulated in the Table 1, in terms of retrieval time (Tr), precision (P) and recall (R). The precision, recall graph for p varying from 0 to 8 is plotted in Fig.6. It can be observed from Fig 6 that, the precision of the system is 100% for values of p from 2 to 8. Figure 5 is the screen shot of the retrieved images for the query image brain0014.jpg for p=8 with pre-stored database. From the results obtained in Table 1 and Table 2, it can be observed that, the retrieval time has decreased considerably (0.234631 sec) compared to that of the retrieval time without pre-stored database (31.4182 sec). However the precision and recall parameters remain same in both cases. From the results of Table 1 it can be observed that, there is no considerable change in the retrieval time (Tr) for p= 0 to 8. This is due to the fact that, query image builds the dynamic database in the form of “struct” for all the values from 0 to 255 and then compares the database images for the points specified by the user (in terms of p value). The small variations in the retrieval time observed for p=0 to p=8 is due to the time taken for the comparison as per the user input. Table 2 shows the results of the CDF based retrieval with prestored CDF values in the database. It can be observed that except the retrieval time, remaining parameters such as precision and recall remains the same. From Table 2, it can also observed that, there is an increase in the retrieval time from 0.21567 seconds (for p=0) to 0.61504 seconds (for p=8). This increase in time is due to the time required for comparison for increasing value of p from 0 to 8 (i.e. from 1 comparison for 20 to 256 comparisons for 28).
5. HIERARCHICAL CDF The method of Hierarchical CDF matching for image retrieval involves similar to basic CDF matching but, instead of matching CDF at all the 256 bins (gray scale) it is matched on a few selected bins (p value) in ascending order for a threshold set by the user. If the CDF at that particular bin lies in the threshold range query image, then the images are retained for further comparison. If the obtained CDF value is NOT within the threshold range of that bin of the query image then, the image is considered not matching and discarded form further comparison. Thus, we can avoid unnecessary calculations and save resources. This method involves 3 additional steps to that of normal CDF comparison. 1.
Assign threshold range for the query image bins. ( ± certain of the bin value)
2.
Before calculating the absolute difference of the bin value, check if the bin value of the image in database lies in the range of threshold of the query image’s particular bin value.
3.
IF it lies in the threshold bin value range then, proceed calculating the absolute difference, then go to the next bin and repeat step 2, else, simply discard the image (without further calculating) and go to the next image in the database.
The results obtained from Hierarchical CDF based retrieval are tabulated for values of p ranging from 0 to 8, variation in % threshold, retrieval time, number of relevant images compared in the database precision and recall are tabulated in Table 3. Table 3 p
% of threshold
No.of images compared
(Tr)
(P)
(R)
1 1 2 2 2 3 3 3 3 4 4 5 5 6 6 7 7 8 8
99 100 98 99 100 96 97 98 100 94 100 88 100 75 100 50 100 1 100
1660 1720 65 1520 1720 58 449 1174 1720 429 1720 406 1720 226 1720 191 1720 13 1720
0.5995 0.570 0.3093 0.4171 0.4091 0.276 0.3447 0.452 0.5286 0.4020 0.7949 0.5341 1.29376 0.5328 2.14061 0.710 4.02496 0.3511 7.808
0.667 0.667 0 1 1 0 1 1 1 1 1 1 1 1 1 1 1 1 1
0.444 0.444 0 0.667 0.667 0 0.667 0.667 0.667 0.667 0.667 0.667 0.667 0.667 0.667 0.667 0.667 0.667 0.667
18
International Journal of Computer Applications (0975 – 8887) Volume 81 – No 18, November 2013
6. CONCLUSION
From Fig.7 it can be observe that, when the value of p=2, the CDF threshold required is 99% to achieve a precision of 1. (i.e.100%). Fig.8 shows that, query image has found 1520 images as relevant to the query image from the database of 1720 images. The retrieval time in this case is 0.4171 seconds. However when the value of p = 8, as shown in Fig.9, the CDF threshold required is 1% to achieve a precision value of 1 (i.e.100%), which indicates that, query image has found 13 images as relevant to the query image from the database of 1720 images. The retrieval time in this case is 0.3511 seconds. This means that there are 13 images found in the data base which are varying by 1% of the CDF of the query image.
Figure.8 shows the number of images being found as the relevant images to the query images for the value of p between 1 and 8.
From the Fig.9 it can also be observed that, retrieval time is a function of number of points of comparisons (depending on the value of p) and number of images obtained based on the % CDF value specified by the user.
Considering the retrieval time and precision are the parameters of importance from accuracy point, the following combinations are recommended for the best performance in the developed prototype system. P value 3 8
Retrieval time (Tr) 0.3447 sec 0.3511 sec
CDF threshold 97 % 1%
The proposed system addresses global feature extraction of the images. However implementing local feature extraction based on automatic segmentation of the images may improve the accuracy of the system
Maintaining different feature databases as per the number of line segment should improve the retrieval time. This method could be explored in the future implementations.
7. ACKNOWLEDGMENTS Experiment has been carried out with the digital images acquired by the Radio diagnosis of Kasturba Medical College, Manipal. A total of 1720 images of different dimension such as 512 x 512 to 2500 x 2048 of CT, MR, US, CR etc.. has been maintained. Most of the images are acquired continuously from a CT cross section (for ex. S106790001.jpg to S106790888.jpg and brain0000.jpg to brain0750.jpg).
8. REFERENCES [1] S.K.Chang, T Kunii, Pictorial database applications, IEEE Comput.14 (11), 1981, 13-21. [2] Ritendra Datta, Dhiraj Joshi, Jia Li and James.Z.Wang, Image Retrieval: Ideas, Influences and Trends of the New Age, ACM Computing Surveys, Vol 40, No.2, Article 5, April 2008.
tree learning. Pattern Recognition 41, pp. 2554 – 2570, 2008. [4] H.B. Kekre, Dhirendra Mishra, Anirudh Kariwala. A Survey of CBIR Techniques and Semantics. International Journal of Engineering Science and Technology (IJEST), Vol. 3, No. 5, PP. 4510-4517, 2011. [5] Deselaers T, Keysers D, Ney H. Features for image retrieval: an experimental comparison. Inf. Retrieval. 11(2), pp. 77–107, 2007. [6] Lining Zhang, Lipo Wang and Weisi Lin. Generalized Biased Discriminant Analysis for Content-Based Image Retrieval. IEEE Transactions on Systems, Man, and Cybernetics—Part B: Cybernetics, Vol. 42, No. 1, pp. 282-290, 2012. [7] Rahman M.H., Pickering M.R., Frater M.R. Scale and Rotation Invariant Gabor Features for Texture Retrieval. IEEE International Conference on Digital Image Computing Techniques and Applications (DICTA), pp. 602-607, 2011. [8] Saptadi Nugroho and Darmawan Utomo. Rotation Invariant Indexing For Image Using Zernike Moments and R–Tree. TELKOMNIKA, Vol.9, No.2, pp. 335-340, 2011. [9] Felci Rajam I. and Valli S. SRBIR: semantic region based image retrieval by extracting the dominant region and semantic learning. Journal of Computer Science, Vol. 7, No. 3, pp.400–408, 2011a. [10] Wang Xing-Yuan, ChenZhi-feng, YunJiao-jiao. An effective method for color image retrieval based on texture. Computer Standards & Interfaces 34, pp. 31–35, 2012. [11] Henning Muller, Nicolas Michoux, David Bandon, Antoine Geissbuhler. A review of content based image retrieval systems in medical applications – Clinical benefits and future directions. International Journal on Medical Informatics (2004) 73, 1-23. [12] Manjunath K N, Niranjan U C. Proceedings of the 2005 IEEE. Engineering in Medicine and Biology, 27th Annual Conference, Shanghai, China, September 1-4, 2005 [13] Suyog Dutt Jain, Harishchandra Hebbar, K N Manjunath, U.C.Niranjan. Large Scale Distributed Frame work for Remote Clinical Diagnosis with Visual Query Support. Distributed Diagnosis and Home Healthcare, Pages: 116. ISBN: 1-58883 – 158 -2. [14] K.N.Manjunath, A Renuka, U.C.Niranjan. Linear Models of Cumulative Distribution Function for Content –based Medical Image Retrieval. Journal of Medical Systems (2007) 31:433-443. [15] Ceyhun Burak Akgul, Daniel L Rubin, Sandy Napel, Christopher F Beaulieu, Hayit Greenspan, Burak Acar. Journal of Digital Imaging, 08 April 2010,Published online
[3] Ying Liu, Dengsheng Zhang, Guojun Lu. Region-based image retrieval with high-level semantics using decision
19
International Journal of Computer Applications (0975 – 8887) Volume 81 – No 18, November 2013
5
6
7
8
9
10
11
Relevant Image set for the image brain0014.jpg 12 13 14 15 16 17 18 Fig.1
19
20
21
22
23
Fig 2. CDF of image with p=2
Fig 3. CDF of image with p=2 and continuous cdf overlapped
Fig.4. Retrieved images for query image brain0014.jpg with p=2
20
International Journal of Computer Applications (0975 – 8887) Volume 81 – No 18, November 2013
Fig.5. Retrieved images for query image brain0014.jpg with p=8, with pre-stored CDF values.
Fig 6. Precision, Recall graph for p values 0 to 8
Fig.7. % CDF threshold versus p
21
International Journal of Computer Applications (0975 – 8887) Volume 81 – No 18, November 2013
Fig.8.No.of images obtained vs. p
Fig.9. Retrieval time vs. p
IJCATM: www.ijcaonline.org
22