International Journal of Electronics Engineering, 2(1), 2010, pp. 25-28
Content Retrieval From X-RAY Images Using Color & Texture Features Bikesh Kr. Singh & Bidyut Mazumdar Department of Biomedical Engg. National Institute of Technology, Raipur (C.G), India
Abstract: The National Library of Medicine (NLM) maintains an archive of approximately 17,000 digitized x-ray images and accompanying data collected in the second National Health and Nutrition Examination Survey (NHANES II). The problem of content-based retrieval of biomedical images presents a major challenge not only because of the surprisingly increasing volume of images acquired from a wide range of sensors but also because of the complexity of images themselves. In the present work a content based retrieval system based on color & texture features has been developed. For color features RGB color histogram is used & to determine texture features statistical texture measures & wavelet transform is used. Bhattacharyya coefficient is obtained in order to make comparisons between color histogram & Euclidean distance is used to compare texture features & wavelet coefficients of two images. In our data base of 210 x-ray images experimental results show that the color histogram & statistical texture features are highly efficient for analysis of x-ray images and the proposed method is simple, accurate and costs much less time than the traditional ones. Keywords: Content based Image Retrieval, Color Histogram, Texture and Wavelet
1. INTRODUCTION
Content {based visual information retrieval (CBVIR) or Content {Based Image Retrieval (CBIR) has been one on the most vivid research areas in the field of computer vision over the last years. CBIR is based on visual features such as colour, texture and shape [1]. Reasons for its development are that in many large image databases, traditional methods of image indexing have proven to be insufficient, laborious, and extremely time consuming. These old methods of image indexing, ranging from storing an image in the database and associating it with a keyword or number, to associating it with a categorized description, have become obsolete. In the medical field, images, and especially digital images, are produced in ever increasing quantities and used for diagnostics and therapy. The Radiology Department of the University Hospital of Geneva alone produced more than 12,000 images a day in 2002 [2]. The National Library of Medicine (NLM) maintains an archive of approximately 17,000 digitized lumbar and cervical spine x-ray images and accompanying data collected in the second National Health and Nutrition Examination Survey (NHANES II) [3]. We are conducting research in Content-Based Image Retrieval (CBIR) techniques for retrieving visually similar and pathologically relevant x-ray images and the resulting system is expected to greatly benefit medical education. The remaining of the paper is organized as follows: In section two we give a brief overview of color histogram. In section 3 & 4 we explain the features extracted for texture analysis & the methodology *Corresponding Author:
[email protected]
respectively, followed by results & conclusions in section 5. 2. OVERVIEW OF COLOR HISTOGRAM
A digital image, in general, is a two dimensional mapping I : x → v from M × N pixels x = [i, j]T to values v. The histogram of an image can be found as M rb = Σi=1 ΣNj=1 Sb(i, j),
∀b = 1, 2, . . (1)
where Sb(i, j) = 1 if the value v at pixel location [i, j] falls in bin b, and Sb(i, j) = 0 otherwise and B is number of bins in the histogram [4]. Histograms have proved themselves to be a powerful representation for image data in a region. Discarding all spatial information, they are the foundation of classic techniques such as histogram equalization and image indexing [5]. Color histograms are flexible constructs that can be built from images in various color spaces, whether RGB, rg chromaticity or any other color space of any dimension. The histogram provides a compact summarization of the distribution of data in an image. The color histogram of an image is relatively invariant with translation and rotation about the viewing axis, and varies only slowly with the angle of view [6]. By comparing histograms signatures of two images and matching the color content of one image with the other, the color histogram is particularly well suited for the problem of recognizing an object of unknown position and rotation within a scene. Importantly, translation of an RGB image into the illumination invariant rg-chromaticity space allows the histogram to operate well in varying light levels. Color Histograms are a commonly used as appearance-based
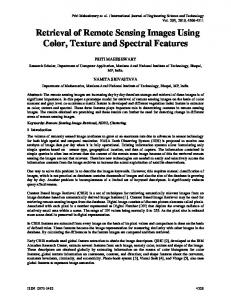
26 signature to classify images for content-based image retrieval systems (CBIR) [7]. Color spaces shown to be closer to human perception and used widely in RBIR include, RGB, LAB, LUV, HSV (HSL), YCrCb and the hue-minmax-difference (HMMD) [8,9,10,11,12]. Figure 1 shows color histogram of three images from the database shown in Figure 2.
International Journal of Electronics Engineering
histograms can potentially be identical for two images with different object content which happens to share color information. Conversely, without spatial or shape information, similar objects of different color may be indistinguishable based solely on color histogram comparisons. 3. FEATURES EXTRACTED FOR TEXTURE ANALYSIS
The feature vector for texture analysis of a particular image is computed by calculating following ten features [13]: 3.1. Variance (Var) of histogram of the hue content of a particular image. 3.2. Uniformity: If Zi is the random variable indicating intensity, P(z) is the histogram of intensity levels in the image & L is number of possible intensity levels, then Uniformity is calculated as: U =
∑
L −1 i=0
p2 ( Zi )
3.3. Average Entropy: e = –
∑
L −1 i=0
(2) p( Z i ) log2P(Zi) (3)
3.4. Relative Smoothness: If σ is the standard deviation, Relative smoothness is given by Figure 1: Color Histogram of Three Different Images from Database
R = 1 – (1/1 + σ2)
(4)
3.5. Measurement of Variance of Approximation Wavelet Coefficient: The image is subjected to discrete wavelet transform to obtain Approximation coefficient (A), Horizontal Coefficient (H), Vertical Detail Coefficient (V) & Diagonal Detail coefficient (D). The variance of these coefficients is considered to be the next four features respectively.
∑ 3.7. Kurtosis: µ (z) = ∑ 3.6. Skewness: µ 3(z) =
L −1 i=0
L −1
4
i=0
(Zi – m)3 P(Zi)
(Zi – m)4P(Zi)
(5) (6)
4. METHODOLOGY
Experiments were conducted on database of 210 x-ray images. A system is developed for image retrieval using color histogram & texture analysis using MATLAB 7.0.1 version. Then the query image is taken and images similar to the query images are found on the basis of color histogram similarity & texture similarity which is defined by feature vector consisting of ten features discussed in section 3. Figure 2: Three x-ray Images from Database Considered for Plotting Color Histogram in Figure. 1
The main drawback of histograms for classification is that the representation is dependent of the color of the object being studied, ignoring its shape and texture. Color
4.1. Color Histogram Analysis
The main tasks of the system are histogram determination and similarity distance computation between the query image and database images. A histogram of the Query image is
27
Content Retrieval From X-RAY Images Using Color & Texture Features
5. RESULT & CONCLUSIONS
produced first by discretization of the colors in the image into a number of bins, and counting the number of image pixels in each bin. The Histogram of Query image is then compared with color histogram of each image in the database. Bhattacharyya coefficient is used to determine the relative closeness between the color histogram of two images.
Table 1 shows the color histogram similarity using Bhattacharyya coefficient of one image with four other images in the database. It is clear that image I1 & I2 have almost similar histogram. Table 2 shows features extracted for texture analysis as discussed in section 3 for five different images from database from which it is evident that texture statistics of all the images are different. The variance, wavelet coefficients, skewness & kurtosis are expressed in 20*log scale. Table three shows the texture similarity using Euclidean distance of one image with four other images in the database. It can be observed from the tables that both histograms as well as texture analysis can be use for retrieval of x-ray images. But color histograms may not be efficient for large databases. Thus integration of texture features will increase the retrieval efficiency of the system.
4.2. Texture Analysis
A feature vector determining texture of an image consisting of ten features discussed in section 3 is generated using MATLAB 7.0.1 version software. When Query image is presented to the system, the feature vector of Query image is generated & compared with that of each image stored in the database. Euclidean distance is used to determine the relative closeness between the texture features of two images.
Table 1 Color Histogram Similarity of One Image (I1) with Four Other Images in Database Image Id
I1
I2
I3
I4
I5
Bhattacharyya coefficient
1
0.90
0.65
0.85
0.88
Table 2 Texture Features (Feature Vector) of Five Different Images from Database Features
Var
U
E
R
A
H
V
D
µ 3(z)
µ 4(z)
I1
433.17
0.0054
7.66
0.9910
192.99
66.34
62.72
49.25
344.50
468.62
I2
431.94
0.0068
7.51
0.9925
189.76
82.80
58.78
57.67
386.65
483.63
I3
458.96
0.0130
6.55
0.9860
155.09
0.21
10.89
–32.82
338.04
420.42
I4
430.68
0.0811
5.99
0.9908
202.19
59.87
75.50
35.69
448.54
531.88
I5
427.72
0.0147
7.10
0.9890
190.79
43.43
68.59
8.28
268.83
468.61
Image Id
Table 3 Euclidean Distance Between Texture Feature Vector of One Image (I1) with four Other Images in Database Image Id
I1
Euclidean distance 0
I2
I3
I4
I5
7.01
104.31
55.17
42.11
The efficiency of the proposed system can be further increased by including shape features. Further work can be done from point of view of clinical benefits from content retrieval of biomedical images. To be used as a diagnostic aid, the algorithms need to prove their performance and they need to be accepted by the clinicians as a useful tool. This also implies an integration of the systems into daily clinical practice which will not be an easy task. It is often hard to change the methods that people are used to, confidence needs to be won. For domains such as evidence-based medicine or case-based reasoning it is essential to supply relevant, similar cases for comparison.
REFERENCES [1]
[2]
[3]
B. K. Singh, G. R. Sinha, A. Wany and B. Mazumdar, “Content based Retrieval from Biomedical Images using Color Histograms”, Accepted for Proceedings of International Conference on Nanotechnology & Biosensors, ICBN , Raghu College of Engg., Visakhapatnam 2010. H. Müller, N. Michoux, D. Bandon and A. Geissbuhler, “A Review of Content-based Image Retrieval Systems in Medical Applications–—clinical Benefits and Future Directions”, International Journal of Medical Informatics, 73, pp.1–23, 2004. D. M. Krainak, L. Rodney Long and G. R. Thoma, “A Method of Content-based Image Retrieval for a Spinal x-ray Image Database”, on Line Document.
28
International Journal of Electronics Engineering
[4]
M. Nilsson., J. S. Bartunek, J. Nordberg and I. Claesson, “On Histograms and Spatiograms - Introduction of the Mapogram”, ICIP, Page(s): 973-976 (2008).
[5]
S.T, Birchfield and S, Rangarajan: “Spatiograms Versus Histograms for Region-Based Tracking”. In CVPR’05, (2005).
[6]
G. S. Linda and C. S. George, Computer Vision, Prentice Hall. (2003)
[7]
M. Stricker and M. Swain, “The Capacity of Color Histogram Indexing”, Computer Vision and Pattern Recognition, Proceedings CVPR IEEE Computer Society Conference on Page(s):704 – 708 (1994).
[8]
P.L. Stanchev, D. Green Jr. and B. Dimitrov, “High Level Color Similarity Retrieval”, Int. J. Inf. Theories Appl., pp. 363–369, (2003).
[9]
Y. Liu, D.S. Zhang, G. Lu and W.-Y. Ma, “Region-based Image Retrieval with Perceptual Colors”, Proceedings of the Pacific-Rim Multimedia Conference (PCM), pp. 931– 938, December 2004.
[10] R. Shi, H. Feng, T.-S. Chua and C.-H. Lee, “An Adaptive Image Content Representation and Segmentation Approach to Automatic Image Annotation”, International Conference on Image and Video Retrieval (CIVR), pp. 545–554, 2004. [11]
V. Mezaris, I. Kompatsiaris and M.G. Strintzis, “An Ontology Approach to Object-based Image Retrieval”, Proceedings of the ICIP, 2, pp. 511–514, 2003.
[12] B. S. Manjunath, “Color and Texture Descriptors”, IEEE Trans. CSVT 11 (6), 2001, 703–715. [13] R. C Gonzalez, R. E Woods and S. L. Eddins, “Digital Image Processing using Matlab”, Pearson Education, 2006.