Jul 12, 2016 - algorithms from computer vision and image processing allow them to ... 311 service requests from New York
Contested Boundaries: Explaining Where Ethnoracial Diversity Provokes Neighborhood Conflict1 Joscha Legewie Yale University Merlin Schaeffer University of Cologne
Concerns about neighborhood erosion and conflict in ethnically diverse settings occupy scholars, policy makers, and pundits alike; but the empirical evidence is inconclusive. This article proposes the contested boundaries hypothesis as a refined contextual explanation focused on poorly defined boundaries between ethnic and racial groups. The authors argue that neighborhood conflict is more likely to occur at fuzzy boundaries defined as interstitial or transitional areas sandwiched between two homogeneous communities. Edge detection algorithms from computer vision and image processing allow them to identify these boundaries. Data from 4.7 million time- and geo-coded 311 service requests from New York City support their argument: complaints about neighbors making noise, drinking in public, or blocking the driveway are more frequent at fuzzy boundaries rather than crisp, polarized borders. By focusing on the broader sociospatial structure, the contested boundaries hypothesis overcomes the “aspatial” treatment of neighborhoods as isolated areas in research on ethnic diversity.
INTRODUCTION
As Western societies are growing increasingly more diverse, concerns about eroding social trust and neighborhood conflict occupy scholars, policy ma1 We thank David Brady, Sarah Carol, Mathijs de Vaan, Thomas DiPrete, Andreas Haupt, Hanno Hilbig, Ruud Koopmans, and Dietlind Stolle for helpful comments and
© 2016 by The University of Chicago. All rights reserved. 0002-9602/2016/12201-0004$10.00
AJS Volume 122 Number 1 ( July 2016): 125–61
125
This content downloaded from 130.132.173.053 on July 12, 2016 06:24:45 AM All use subject to University of Chicago Press Terms and Conditions (http://www.journals.uchicago.edu/t-and-c).
American Journal of Sociology kers, and pundits alike. At the core of this debate stands a bleak portrait of community life in ethnically diverse settings branded by mistrust, neglect for the maintenance of public goods, and withdrawal from community life. The evidence, however, is mixed. In many cases scholars find that ethnic diversity and polarization increase threat, prejudice, and community erosion, but in other cases they do not. Here we propose the contested boundaries hypothesis as a refined contextual explanation of neighborhood conflict. We argue that neighborhood conflict arises at poorly defined boundaries that separate ethnic and racial groups. Such fuzzy boundaries are interstitial or transitional areas sandwiched between two homogeneous communities. They are contested because they threaten homogeneous community life and foster ambiguities about group rank. Above and beyond disorganization and diverging ways of life generally found in mixed neighborhoods, their location between differently populated homogeneous communities triggers hostility. Well-defined boundaries, by contrast, are accepted divisions between one group’s turf and another’s and are thus less contested. By focusing on the broader sociospatial structure, the contested boundaries hypothesis overcomes the “aspatial” treatment of neighborhoods as isolated areas in research on ethnic diversity. It highlights how residential segregation creates contentious areas at the places where groups border. Our argument suggests an inverse u-shaped relationship between edge intensity and neighborhood conflict. Edge intensity is a sociospatial feature that captures changes in the composition of neighborhoods across space. It ranges from no change in racial composition (no boundary, e.g., within a homogeneous or diverse area), to gradual changes in interstitial or transitional areas (fuzzy boundaries of different strengths), and finally to abrupt transitions from one group’s turf to another’s (well-defined or clear-cut boundaries). To measure edge intensity, we use edge detection algorithms from computer vision and image processing. These algorithms were developed in order to identify points in an image at which the image color or brightness changes sharply. Building on Legewie (2016a), we adopt and modify these methods so that they can be applied to neighborhood data, allowing us to detect the borders between homogeneous areas of different ethnoracial groups. Figure 1 illustrates this concept in a detailed view of Crown Heights South in central Brooklyn, New York. It shows an area that is predominantly populated by African-American residents with a “white enclave” covering about 24 city blocks. Edge intensity is low (no boundary) in areas without changes in ethnoracial composition, such as the parts homogeneously suggestions. Direct correspondence to Joscha Legewie, Yale University, Department of Sociology, 493 College Street, New Haven, Connecticut 06511. E-mail: joscha.legewie @yale.edu
126
This content downloaded from 130.132.173.053 on July 12, 2016 06:24:45 AM All use subject to University of Chicago Press Terms and Conditions (http://www.journals.uchicago.edu/t-and-c).
This content downloaded from 130.132.173.053 on July 12, 2016 06:24:45 AM All use subject to University of Chicago Press Terms and Conditions (http://www.journals.uchicago.edu/t-and-c).
F IG . 1.—Edge intensity in Crown Heights South, Brooklyn (2010). White residents occupy an area of 24 city blocks surrounded by largely African-American residents. The edges are well defined on the west side of the enclave but fuzzy on the northeast side.
American Journal of Sociology populated by black residents or in the middle of the white enclave. By contrast, we observe well-defined boundaries on the west side of the 24 city blocks occupied by white residents and fuzzy boundaries on the northeast and south sides. This illustrates the continuous nature of the edge intensity scale ranging from no, to gradual, and finally to abrupt changes in racial composition. Our argument implies few tensions at the well-defined border of the west side and increased conflict between neighbors in the interstitial areas of the fuzzy northeast and south side edges. To evaluate our argument, we use process-generated data from 4.7 million time- and geo-coded 311 service requests in New York City from 2010 and 2014. The 311 system is a centralized nonemergency telephone number, Internet platform, and smartphone application that allows city residents to file a request for or complain about issues as diverse as birth certificate services, fallen tree removal, or broken heating. Our analyses focus on complaints about neighbors as an indicator of neighborhood conflict while adjusting for the general propensity to use the 311 system based on other service requests. Using multilevel negative binomial regression, we find a clear inverse u-shaped relation between edge intensity and the number of complaints about neighbors—a finding that is reaffirmed in various sensitivity analyses. This finding supports our argument: fuzzy boundaries defined as interstitial areas sandwiched between ethnoracial communities are contested. As a part of our analyses, we also find support for classical explanations based on neighborhood erosion and disorganization theories. Aside from the importance of these results for the literature on intergroup relations, our research introduces contested boundaries as a theoretical concept to the growing neighborhood literature and proposes edge detection algorithms as a corresponding measurement tool. ETHNORACIAL COMPOSITION AND NEIGHBORHOOD CONFLICT
Previous research provides a number of explanations of neighborhood conflict. Several focus on ethnoracial compositions such as ethnic polarization and heterogeneity. First, intergroup competition and defended neighborhoods theories emphasize how out-group shares, out-group in-migration, or ethnoracial polarization prompts hostile opposition. Second, theories about general community erosion and disorganization regard ethnoracial heterogeneity as disintegrating. These classical approaches are established in the literature and might (partially) explain the number of complaints about neighbors as the main outcome variable in our analysis. Equally important, they provide the background for our argument about contested boundaries as a refined contextual explanation of neighborhood conflict. Proponents of intergroup competition theories have long argued that certain ethnoracial neighborhood compositions stir conflict and social tensions 128
This content downloaded from 130.132.173.053 on July 12, 2016 06:24:45 AM All use subject to University of Chicago Press Terms and Conditions (http://www.journals.uchicago.edu/t-and-c).
Contested Boundaries and Neighborhood Conflict (Blumer 1958; Blalock 1967; Banton 1983; Olzak 1992). The approach originates from attempts to explain majority members’ prejudice and discrimination against ethnoracial and immigrant minorities. According to the key insight, people feel threatened by the presence of out-group members because of real or perceived competition between ethnoracial groups for scarce resources. The argument refers to both competition over economic interests such as jobs on the labor market or access to housing and nonmaterial issues such as political representation or the prevailing way of life. Many scholars see contact theory as a counterpart to intergroup competition theory, because it predicts that intergroup contact diminishes prejudices and discrimination (Pettigrew 1998). Yet in his seminal study, Allport (1954) already noted that mere casual contact “does not dispel prejudice; it seems more likely to increase it” (p. 251; italics in original). In a similar vein, the defended neighborhoods literature argues that fears of out-group in-migration from adjacent areas trigger defensive behavior among members of the dominant group to preserve a neighborhood’s way of life (Suttles 1972; Rieder 1985; DeSena 1990). Based on ethnographic studies of white urban neighborhoods, this argument posits that their residents share a sense of community identity based on the exclusion of other ethnoracial groups. Building on these insights, Green, Strolovitch, and Wong (1998) show that racially motivated crimes are more likely to occur in homogeneous white areas that are confronted with in-migration of ethnoracial minorities (see also Lyons 2007; Grattet 2009). Some authors have pushed beyond the focus on majority members’ reactions to minority presence or in-migration. They claim that the most contentious situations are polarized, that is, situations in which two equal-sized opponents face each other (Esteban and Ray 1994; Montalvo and Reynal-Querol 2005). This is in line with Gould’s (2003) argument about conflict in symmetric and asymmetric relations. On the basis of a wide array of settings, including murders in American cities and vengeance in 19thcentury Corsica, Gould postulates that “conflicts are more likely to occur . . . in relatively symmetrical relations in which there is ambiguity between actors concerning relative social rank, that is, asymmetries in perception that could be contested” (p. xii). A second classical line of research focuses on general community erosion and disorganization as a result of overall sparse networks and associated declines in social control (Shaw and McKay 1942; Sampson and Groves 1989; Taylor 2001). In addition to residential instability and concentrated disadvantage, this approach argues that ethnoracial heterogeneity is disintegrating. It results in reduced social interactions among neighbors, which again lowers overall levels of social control and capacities to solve community problems collectively. Typical work in this area focuses on neighborhood disorder (also termed incivilities) and crime (Skogan 1990; Sampson and Raudenbush 1999). Proponents claim that community ero129
This content downloaded from 130.132.173.053 on July 12, 2016 06:24:45 AM All use subject to University of Chicago Press Terms and Conditions (http://www.journals.uchicago.edu/t-and-c).
American Journal of Sociology sion and disorganization increase overall rates of crime, including intraethnic delinquencies (Grattet 2009; Hipp, Tita, and Boggess 2009). A complementary line of research focuses on communities’ capacities for collective action in pursuit of public goods and the attitudes and expectations of trust that underlie this capacity (for an overview, see Schaeffer [2014]). According to the seminal study of the economists Alesina, Baqir, and Easterly (1999), the proportion of tax money spent on education, trash disposal, and welfare declines with increasing levels of ethnoracial heterogeneity in U.S. metropolitan areas. The debate began to receive widespread attention among sociologists and political scientists only after a study by Putnam (2007). He shows that a large number of good-community indicators suffer from ethnoracial diversity such as trust in neighbors, interest in volunteering, or work on community projects. Putnam’s findings about reduced trust in people of similar ethnicity in diverse neighborhoods situate his study in the tradition of disorganization theory and set the debate apart from the literature on intergroup competition. Aside from reduced social interactions and lack of social control, this line of research considers additional mechanisms that may explain the disintegrating consequences of ethnoracial heterogeneity: difficulties to balance numerous and diverse interests that reflect competing ways of life (Kimenyi 2006; Page 2008) and communication problems and potentials for misinterpretation (Habyarimana et al. 2007; Desmet, Ortín, and Wacziarg 2012). Accordingly, complaints about neighbors, our central outcome variable, might increase not because (in-migrating) out-groups are perceived as threatening but because general community erosion and disorganization in heterogeneous settings increase incivilities and disorder. We consider this alternative explanation prominently as part of our empirical analysis. The Contested Boundaries Hypothesis The evidence regarding community erosion and conflict in diverse or polarized settings is by no means conclusive (for reviews, see Schaeffer [2014, pp. 12–31]; van der Meer and Tolsma [2014]). Several recent studies try to overcome the inconclusive findings by focusing on the conditions under which an out-group is perceived as threatening. For the study of anti-immigrant sentiments, Hopkins (2010) proposes the politicized places hypothesis, according to which one such condition is sudden increases in the out-group population coupled with negative media reports. Legewie (2013) makes a related argument focusing on the effect of large-scale events such as terrorist attacks on anti-immigrant sentiments (for a similar argument focused on discrimination, see Legewie [2016b]). Here we propose the contested boundary hypothesis and argue that neighborhood conflict is particularly likely to occur at fuzzy edges between ethnically homogeneous areas populated by 130
This content downloaded from 130.132.173.053 on July 12, 2016 06:24:45 AM All use subject to University of Chicago Press Terms and Conditions (http://www.journals.uchicago.edu/t-and-c).
Contested Boundaries and Neighborhood Conflict persons of different ethnoracial groups. We claim that mixed areas that are sandwiched between homogeneous areas composed of different ethnoracial groups are more contentious than those characterized by ethnoracial heterogeneity, polarization, or out-group in-migration per se. This argument extends the approaches discussed above. It takes the local sociospatial structure into account, beyond the previous focus on neighborhoods as isolated islands. Boundaries have emerged as a key concept in sociological theorizing, particularly in research on ethnicity (Lamont and Molnar 2002; Wimmer 2008). Residential segregation, a seminal topic of neighborhood research, in many ways manifests and reinforces the categorical distinctions that are at the core of the boundary argument (Massey and Denton 1998; Sampson 2012). Indeed, Campbell et al. (2009) argue that residential ethnoracial compositions play a decisive role in how people define their neighborhood’s boundaries. Research on segregation, however, does not address what happens at places where groups border. Few studies examine such sociogeographical boundaries and their consequences for social life (Grannis 2009; Logan 2012; Spielman and Logan 2013; Kramer 2015).2 Research on gang violence highlights that shared turf boundaries (Papachristos, Hureau, and Braga 2013) or boundary crossings (Radil, Flint, and Tita 2010) are an important predictor of violence. Desmond and Valdez (2013) claim that neighborhoods at the edges of segregated black communities have particularly high frequencies of nuisance property citations because nonblack residents feel threatened by their black neighbors. Building on these ideas, we seek to explicate and refine the conflict-generating mechanisms working at the interstitial areas where ethnoracial groups border. Our argument about contested boundaries consists of two parts: First, the different mechanisms emphasized by intergroup competition and defended neighborhood theory come together and work in concert at boundaries. Second, fuzzy boundaries are more contentious than well-defined ones. At boundaries between homogeneous neighborhoods, several mechanisms proposed by the different branches of intergroup competition and defended neighborhood theory jointly produce ethnoracial tensions. As reviewed above, a common argument in the literature is that ethnoracial compositions have the potential to stir social tensions because out-group members are perceived as threatening. The defended neighborhoods literature further suggests that residents of ethnically homogeneous areas develop exclusive community identities. Campbell et al. (2009) note how ethnoracial compositions inform people’s subjective construction of neigh2 Other research focuses on spatial inequality. Pattillo (2005, 2013), e.g., identifies the black middle class’s positioning at the boundaries between the advantages of white middle-class communities and the perils of poor black neighborhoods as a core determinant of their specific opportunities and disadvantages.
131
This content downloaded from 130.132.173.053 on July 12, 2016 06:24:45 AM All use subject to University of Chicago Press Terms and Conditions (http://www.journals.uchicago.edu/t-and-c).
American Journal of Sociology borhood boundaries correspondingly. Minorities’ in-migration to homogeneous areas contests these subjective boundaries and is consequently met by strong resistance to defend the integrity of the dominant group’s neighborhood community. Gould (2003) and others claim that polarized situations in which two equally sized opponents face each other are even more contentious than circumstances in which a majority defends its space against the in-migration of minorities. Here the ambiguity about social rank—that is, who is the dominating group—breeds conflict. We maintain that the mechanisms discussed by the different approaches come together and work in concert at sociogeographical boundaries between two groups: the presence of the other group is salient (group threat), the situation is highly polarized (ambiguity about social rank), and exclusive ethnoracial community identities coupled with claims about group turfs are more pronounced than they would be in conventionally mixed areas (defended neighborhoods). Together, these mechanisms result in neighborhood conflicts at contested boundaries above and beyond the frictions generally found in mixed neighborhoods. Second, this joint effect of mechanisms is particularly pronounced at poorly defined or fuzzy boundaries. Sharp or well-defined boundaries do not threaten the integrity of neighborhood communities. Such overt transitions between areas clearly define each group’s turf and hence prevent ambiguities about social rank and group turfs. In other words, well-defined boundaries manifest where each group dominates and leave no interstitial space between the groups that could be the object of rivaling claims. Fuzzy boundaries, by contrast, are characterized by such interstitial space. These transitional areas are ambiguously located between the homogeneous areas inhabited by two different groups.3 One might object that poorly defined boundaries simply identify ethnoracial heterogeneity insofar as members from the groups in adjacent homogeneous areas mix. From our perspective, this overlooks the importance of the ambivalent location between homogeneous areas composed of different ethnoracial groups. This location conjoins the conflict-breeding consequences of out-group salience, polarization, exclusive identities, and group turf entitlements that spill over from the adjacent homogeneous areas. In consequence, we predict that such areas are more contentious than diverse areas per se. In summary, poorly defined boundaries between ethnically homogeneous areas are particularly prone to conflict. In these transitional areas, 3 Lim, Metzler, and Bar-Yam (2007) make a related argument based on evidence about violent conflicts in India and the former Yugoslavia. Their argument focuses on “patches consisting of islands or peninsulas of one type surrounded by populations of other types” (p. 1543). Our argument, however, focuses on any boundary that separates groups in different neighborhoods. A clearly encircled island, e.g., would be prone to conflict in Lim et al.’s approach but not in ours.
132
This content downloaded from 130.132.173.053 on July 12, 2016 06:24:45 AM All use subject to University of Chicago Press Terms and Conditions (http://www.journals.uchicago.edu/t-and-c).
Contested Boundaries and Neighborhood Conflict several well-established conflict-generating mechanisms work in concert. From this perspective, residential segregation frequently creates contentious areas at the places where groups border. On the basis of this argument, we expect an inverse u-shaped relation between edge intensity and neighborhood conflict, where edge intensity is a spatial feature ranging from absent—no boundary, for example, within a homogeneous neighborhood— to well-defined separation of two groups (see the illustration in the introduction). DATA AND METHODS
Our analyses are based on data from 4.7 million time- and geo-coded 311 service requests from New York City in 2010 and 2014, combined with data on the census block and tract level from the U.S. Census and American Community Survey five-year estimates. In our main analysis, we focus on 2010 (1.63 million requests) and later conduct additional analysis based on service requests from 2014. The 311 service requests allow us to track complaints about neighbors such as “loud music” or “illegal parking” as indicators of everyday neighborhood conflict across time and space, while adjusting for the general propensity to use the 311 system for other service requests. Using multilevel negative binomial regression, we model the number of complaints as a function of ethnic heterogeneity and polarization—the key predictors of the classical approaches—as well as edge intensity as the concept at the center of our argument. To identify edges between ethnically homogeneous areas, we use edge detection algorithms from computer vision and image processing. Edge Detection Algorithms: Detecting Boundaries between Ethnic Neighborhoods The term edge detection refers to a number of mathematical methods with the goal to detect “points in a digital image at which the image brightness changes sharply or, more formally, has discontinuities” (Nosrati et al. 2013, p. 116; see also Ziou and Tabbone 1998; Shapiro and Stockman 2001). These algorithms are a fundamental and well-established tool in image processing and computer vision with applications ranging from image sharpening, over robotics, to driverless cars (Shapiro and Stockman 2001). Edge detection algorithms are part of a larger literature on spatial boundary detection. This literature includes various methods used in ecology, epidemiology, and other areas, such as “wombling” (Jacquez, Maruca, and Fortin 2000; Dale and Fortin 2014), or methods based on ecocentric signatures and cluster analysis (Logan et al. 2011; Spielman and Logan 2013). Most of the existing boundary analysis methods are designed for either point-specific data with known 133
This content downloaded from 130.132.173.053 on July 12, 2016 06:24:45 AM All use subject to University of Chicago Press Terms and Conditions (http://www.journals.uchicago.edu/t-and-c).
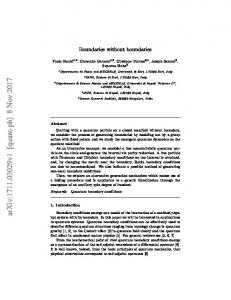
American Journal of Sociology coordinates or regular lattices such as images (Nosrati et al. 2013; Dale and Fortin 2014).4 Directly applying these methods to the ethnoracial composition of neighborhoods would require a high-resolution spatial grid with point-specific information about ethnoracial composition. The smallest available census aggregation, however, is the census block level. Legewie (2016a) adopts and modifies edge detection algorithms so that they can be applied to census block data. The main challenge is that commonly used edge detection algorithms are designed for image data in the form of regular grids. They ignore the different spatial extent of areas and their irregular spatial arrangement. To address this problem, the modified algorithm moves from discrete kernels commonly used in edge detection algorithms for images to continuous kernels that account for the irregular spacing of areas. While using continuous kernels to approximate a spatially discrete phenomenon (i.e., census blocks) has limitations as well, the algorithm is one of the only approaches that is applicable to contemporary census data. Appendix A gives a technical description of the algorithm, and Legewie (2016a) includes a comparison with (Bayesian) areal wombling. The modified edge detection algorithm allows us to detect racial and ethnic neighborhood boundaries on the basis of contemporary census data. In particular, we first calculate edge intensity for each of the four ethnoracial groups separately and then multiply the values of the two groups with the highest edge intensity values. As a consequence, changes in racial composition from one dominant group to a mixed neighborhood or between differently composed mixed areas get assigned lower values than transitions between two ethnically homogeneous areas (for a concrete example, see app. A). Low values indicate no change in ethnoracial composition. This is the case within both ethnoracially homogeneous and diverse areas as long as the composition of adjacent areas is the same. High values indicate abrupt changes from one ethnoracial group to another such as transitions from a predominantly African-American to a dominantly Hispanic area. Figure 2 illustrates the result. It shows both a popular edge detection algorithm applied to an image (small inset) and our modified algorithm applied to the proportion of black citizens in each census block in New York City (main figure). On the left, the figure (and image) first shows the input data with lighter shadings indicating a higher proportion of black citizens. On the right, it shows the output from the edge detection algorithm, highlighting the borders between areas with a high and low pro4
An exception is (Bayesian) areal wombling for irregularly shaped geographic regions such as census tracts (Lu and Carlin 2005). Areal wombling essentially estimates the difference between all pairs of adjacent regions irrespective of the local spatial structure. This limitation makes it impossible to detect interstitial or transitional areas located between two different groups, which are at the core of our theoretical argument.
134
This content downloaded from 130.132.173.053 on July 12, 2016 06:24:45 AM All use subject to University of Chicago Press Terms and Conditions (http://www.journals.uchicago.edu/t-and-c).
Contested Boundaries and Neighborhood Conflict portion of black residents. Figure 1 above provides a more detailed view of Crown Heights South in central Brooklyn (see the introduction for a detailed description). Across the 29,655 inhabited census blocks in New York City, the average edge intensity is 0.08 (SD 5 0.073). By definition, fuzzy edges are also ethnoracially mixed. But our edge intensity measure is theoretically (see arguments above) and empirically distinct from heterogeneity (the correlation is .25). Estimation Strategy In the following analyses, we use the number of complaints about neighbors on the census block level as the dependent variable and edge intensity as the main independent variable. Standard linear regression models are inappropriate to model such count data confined to positive integers. Poisson regression is one alternative, but the underlying distribution assumes that the mean and variance are equal (Gelman and Hill 2007, p. 114). We therefore model the number of complaints using negative binomial regression, which allows for excess variability (overdispersion) among the complaint calls (Long and Freeze 2005, chap. 8; Gelman and Hill 2007, p. 115).5 To account for the clustering of census blocks in tracts (many control variables are measured on the census tract level), we use multilevel negative binomial regression (Rabe-Hesketh and Skrondal 2008, chap. 9). Formally, the model can be expressed as lij 5 expða 1 dDij 1 JD2ij 1 Xij b1 1 Uj b2 1 zj Þ; where i and j are indices for census block and tract, respectively. The term dDij 1 JD2ij models a quadratic relation between edge intensity and the number of complaints about neighbors l ij, evaluating our argument about an inverse u-shaped relationship. The terms X ij and Uj represent matrices of control variables on the census block and tract level, and the two b’s are vectors of corresponding coefficients. The term zj is a random intercept that captures unobserved heterogeneity between census tracts. In additional sensitivity analysis, we account for spatial autocorrelation using a spatial Bayesian hierarchical model, fit semiparametric generalized additive models to allow for any functional relation between edge intensity and the number 5 Another concern with count data is inflated zero counts (Gelman and Hill 2007, p. 126). Zero-inflated models are designed to address this problem. They are based on a binary model to predict structural zeros and a count model to predict the counts. But there is no reason to believe that the number of 311 service requests is driven by two distinct processes, considering that our sample excludes census blocks where no one lives (see the sample definition below).
135
This content downloaded from 130.132.173.053 on July 12, 2016 06:24:45 AM All use subject to University of Chicago Press Terms and Conditions (http://www.journals.uchicago.edu/t-and-c).
American Journal of Sociology
F IG . 2.—Illustration of edge detection algorithm applied to the proportion of black residents in each census block in New York City with inset of gray-scale image.
of 311 calls, and extend the model with census tract fixed effects (see details in the results section). Data, Geographic Regions, and Coding of Variables We construct our data set from three sources: time- and geo-coded 311 service requests from New York City, census block data from the 2010 Census Summary File 1, and census tract data from the 2010 American Community Survey five-year estimates. Census blocks are the smallest geographic unit used by the Census Bureau. In New York City, a census block usually refers to a single city block. City blocks sum up to a block group, and block groups again make up a census tract. Overall, there are 38,792 census blocks with an average population of 210 residents embedded in 2,166 census tracts. We 136
This content downloaded from 130.132.173.053 on July 12, 2016 06:24:45 AM All use subject to University of Chicago Press Terms and Conditions (http://www.journals.uchicago.edu/t-and-c).
Contested Boundaries and Neighborhood Conflict
FIG. 2 (Continued )
restrict our sample to census blocks with at least one person and household and exclude public parks so that our final sample consists of 29,872 census blocks. Because of missing values on the predictor variables, the sample reduces to 29,632 census blocks nested in 2,106 census tracts (i.e., 0.8% and 1.1% missing values, respectively). Dependent variable and coding of 311 service requests.—Our dependent variable is based on 311 service requests from New York City. The 311 system, which includes a centralized nonemergency telephone number, Internet platform, and smartphone app, allows city residents to file a request for or complain about issues as diverse as birth certificate services, fallen tree or branch removal, or broken heating. The 311 system was established in New York City in March 2003 to subsume more than 40 separate agency help lines into one centralized service request system (Idicheria, Schellong, 137
This content downloaded from 130.132.173.053 on July 12, 2016 06:24:45 AM All use subject to University of Chicago Press Terms and Conditions (http://www.journals.uchicago.edu/t-and-c).
American Journal of Sociology and Fiedler 2012). It is operated around the clock on each day of the year and provides language translation services to over 180 languages. Today, the system handles over 2 million service requests per year. When a person files a service request such as reporting a noisy neighbor through the 311 service hotline, website, or smartphone app, the person specifies the topic (e.g., “noise residential” featured prominently on the website and as an example on the hotline), provides further details based on a list of categories (e.g., “banging/pounding,” “loud music/party,” “loud talking,” or “loud television”), and indicates the time and place. After a request is filed, the information is forwarded to the appropriate city agency, such as the New York City Police Department, which responds to the complaint. Previous research has used 311 data to capture community engagement (Lerman and Weaver 2014), political participation (Levine and Gershenson 2014), and physical disorder (O’Brien, Sampson, and Winship 2015). We focus on neighborhood conflict indicated by complaints about neighbors. As outlined by Minkoff (2016), 311 service requests are determined by two factors: “conditions” such as physical disorder or neighborhood conflict and “contacting propensity” as the general tendency to use the 311 system. Our measure is based on calls that indicate “conflict between neighbors” as a condition, and our analysis adjusts for the contacting propensity by controlling for other, unrelated service requests. Complaints about neighbors might not all be observed incidents of neighborhood conflict, but they are an interesting indicator of neighborhood life. They indicate tensions and conflicts that are not resolved in a neighborly way by knocking on someone’s door. Instead, residents reach out to the city as an external authority. Typical examples are complaint type noise and its associated description loud music or complaint type blocked driveway and its associated description no access. These complaint calls about neighbors do not refer to rare events such as hate crimes (Lyons 2007) or gang-related violence (Radil et al. 2010), but to more subtle forms of conflict that are a defining aspect of everyday life, which have largely escaped quantitative research so far. In contrast to survey research, such behavioral measures are less affected by social desirability bias. The trade-off is that 311 service requests lack information on the identity of the caller, which is an important limitation that is further discussed in the results section and conclusion. Appendix B describes our coding scheme and procedure in detail. Block-level covariates.—Just as the number of complaint calls, the crucial independent variables are measured on the census block level. They rely on data from the 2010 census. Edge intensity, which we use to evaluate our main argument, is based on ethnoracial shares for census blocks (for details, see the section on edge detection algorithms and app. A). The two indices for ethnoracial heterogeneity and polarization use the same data on ethnoracial shares. Following the convention in the literature, we use the 138
This content downloaded from 130.132.173.053 on July 12, 2016 06:24:45 AM All use subject to University of Chicago Press Terms and Conditions (http://www.journals.uchicago.edu/t-and-c).
Contested Boundaries and Neighborhood Conflict Hirschman-Herfindahl index (HHI; Hirschman 1964) and the index of ethnic polarization (EP; Montalvo and Reynal-Querol 2005).6 These indices allow us to examine the classical approaches. Our models include a number of control variables on the census block level. Most importantly, we adjust for the general propensity to call 311 using the number of service requests that are clearly unrelated to neighborhood conflict (see app. B). This variable adjusts for what Minkoff (2016) calls “contacting propensity.” The other variables on the census block level are the population size (in hundreds), the block’s area size, the proportion of the area that is covered by public housing, and the ethnoracial composition in terms of the proportion of black, Hispanic, and Asian citizens. Tract-level covariates.—The other control variables are measured on the census tract level and based on the 2006–10 American Community Survey five-year estimates. They include a number of well-established predictors of neighborhood conflict (Sampson, Morenoff, and Gannon-Rowley 2002; Lyons, Vélez, and Santoro 2013): an index of concentrated disadvantage, residential instability, share of crime and conflict-prone population, immigrant concentration, and the number of foreclosures in a census tract.7 For all indexed control variables, we use the predicted factor scores based on an exploratory maximum likelihood factor analysis. Table 1 reports details on the items from which the indexed control variables are constructed and their factor loadings. Finally, we control for a multigroup segregation index to clearly separate the concentration of groups from the boundaries between their communities.8 This index relies on the census 2010 block data on the PI P Formally, these indices are defined as HHI 5 1 � Ii 5 1 s2i and EP 5 1 � i 5 1 2 ½ð0:5 � si Þ=0:5� si , where s is the population share of group i and I is the number of groups in a given census block. In most situations, these indices are highly collinear (Schaeffer 2013a). Even in New York City, where we observe the whole range of possible HHI and EP values, the correlation between theP two indices is .91. In sensitivity analyses, we also explore the Theil entropy index, E 5 Ii 5 1 lnð1=pi Þ, as an alternative to the more commonly used HHI. The Theil entropy index relates nicely to our multigroup segregation index (see below) and correlates with the index of ethnic polarization by only .83. This alternative diversity index produces similar results. 7 The foreclosure data are from New York University’s Furman Center: http://www .furmancenter.org. 8 We follow Reardon and Firebaugh’s (2002) suggestion and calculate the information theory index as 6
H5
I K X 1X tk rki lnðrki Þ; pi T Ei51 k51
where E is Theil’s entropy index (see above), p is the proportion, and t is the absolute number of group i in census block k. This segregation index “can be interpreted as one minus the ratio of the average within-unit population diversity to the diversity of the total population” (p. 42).
139
This content downloaded from 130.132.173.053 on July 12, 2016 06:24:45 AM All use subject to University of Chicago Press Terms and Conditions (http://www.journals.uchicago.edu/t-and-c).
TABLE 1 Description of Variables Variables
Description
Dependent variables: Complaint calls, 2010 . . . . . . . Complaint calls (noise). . . . . . . Complaint calls (night) . . . . . . Block-level covariates: Edge intensity. . . . . . . . . . . . . Other 311 service requests . . . . Population size . . . . . . . . . . . . Area size. . . . . . . . . . . . Ethnoracial diversity . . . Ethnoracial polarization Public housing . . . . . . .
. . . .
. . . .
. . . .
. . . .
. . . .
Racial composition . . . . . . . . . Tract-level covariates: Concentrated disadvantage . . .
Residential instability . . . . . . .
Crime-prone population. . . . . . Immigrant concentration . . . . .
Foreclosures . . . . . . . . . . . . . . Multigroup segregation . . . . . .
Number of complaints about neighbors (census block, 2010) Number of noise complaints about neighbors (census block, 2010) Number of complaints about neighbors between 6 p.m. and 9 a.m. in 2014 (census block, 2014) Measure of change in racial composition based on racial/ethnic counts for census blocks; the algorithm is discussed in the data and methods section and app. A Number of service requests that are unrelated to neighborhood conflict as a measure for the general propensity to use the 311 system Size of population in hundreds (also considered as exposure variable in sensitivity analysis) Size of area Hirschman-Herfindahl index (HHI) Index of ethnic polarization (EP) Proportion of census blocks that are NYC Housing Authority developments (public housing) Proportion of black, Hispanic, and Asian citizens Index of six items (factor analysis): Poverty rate (factor loading: .79) Unemployment rate (factor loading: .56) Professional jobs (factor loading: 2.73) Share of high school graduates (factor loading: 2.81) Share of single-mother families (factor loading: .75) Share of households that receive public assistance income (factor loading: .78) Index of three items (factor analysis): Percentage of renter-occupied units (factor loading: .65) Share of residents who moved to another dwelling since 2005 (factor loading: .61) Housing unit rental vacancy rate (factor loading: .59) Share of 15–34-year-old males Index of three items (factor analysis): Share of foreign-born residents (factor loading: .65) Share of residents who speak English less than “very well” (factor loading: .99) Share of Spanish-speaking residents (factor loading: .52) Number of foreclosures in census tract Information theory index (Reardon and Firebaugh 2002) based on census 2010 block data on the population shares of ethnoracial groups (census tract level)
This content downloaded from 130.132.173.053 on July 12, 2016 06:24:45 AM All use subject to University of Chicago Press Terms and Conditions (http://www.journals.uchicago.edu/t-and-c).
Contested Boundaries and Neighborhood Conflict population shares of ethnoracial groups but as a segregation index sums up to the census tract level. For the analysis, we z-standardize all variables with the exception of the number of other calls and our main explanatory variable, edge intensity. RESULTS
Our contested boundary hypothesis suggests that neighborhood conflict is more pronounced at fuzzy boundaries between ethnically homogeneous areas so that we expect an inverse u-shaped relation between edge intensity and neighborhood conflict. To evaluate this argument, we begin our analysis with a set of five multilevel negative binomial regressions predicting the number of 311 complaint calls about neighbors on the census block level in 2010. Table 2 shows the results. The models include edge intensity together with a quadratic term that captures the expected nonlinear relation. Model 1 first shows a baseline setup. It includes population size, census block area size, fixed effects for the five boroughs, and the number of other service requests, which captures the general propensity of the population in a certain area to request services.9 The results show a highly significant and positive coefficient for edge intensity and a negative one for the squared term. Figure 3 (dashed line) illustrates the curve-linear pattern implicated in these estimates. It shows the predicted number of complaints about neighbors (y-axis) as a function of our continuous edge intensity scale (x-axis). The figure reveals the expected inverse u-shaped relation. The empirical results suggest that the number of complaints initially increases until a maximum is reached at 0.36 edge intensity, followed by a gradual decline. At the maximum, the predicted number of complaints is 46% higher compared to areas with low values of edge intensity, indicating that fuzzy boundaries between ethnically homogeneous areas play an important role for conflict between neighbors. The vertical black line demarcates the upper end of the empirically observed scale of edge intensity, that is, the most clearcut sociogeographical boundaries observed in New York City (0.5% of the values are larger but are sparsely distributed over the rest of the scale). Predictions above the demarcation extrapolate our model beyond the empirically supported range. They show our model’s predictions for extremely welldefined edges between ethnically homogeneous groups as they might be observed in other cities such as Chicago or Detroit.
9
In separate model specifications, we use population size as an exposure or offset variable. This alternative specification fixes the coefficient for logged population to one and interprets the number of complaints relative to the number of potential callers (population size) as the baseline or “exposure” (Gelman and Hill 2007, pp. 111–13). The findings show the same pattern as the one reported here.
141
This content downloaded from 130.132.173.053 on July 12, 2016 06:24:45 AM All use subject to University of Chicago Press Terms and Conditions (http://www.journals.uchicago.edu/t-and-c).
American Journal of Sociology TABLE 2 Effect of Edge Intensity on Number of Complaint Calls Model 1
Model 2
Model 3
Model 4
Model 5
Edge intensity . . . . . . . . . . . . . . .
2.11*** 1.94*** 1.33*** 1.35*** 1.62*** (.19) (.18) (.19) (.19) (.21) Edge intensity (squared) . . . . . . . . 22.93*** 22.71*** 21.93*** 21.94*** 21.89*** (.39) (.38) (.38) (.38) (.42) Control variables: Population (in 100s). . . . . . . . . . .09*** .09*** .09*** .09*** .09*** (.00) (.00) (.00) (.00) (.00) Area . . . . . . . . . . . . . . . . . . . . . .08*** .09*** .09*** .09*** .10*** (.01) (.01) (.01) (.01) (.01) Other service requests . . . . . . . . .00*** .00*** .00*** .00*** .00*** (.00) (.00) (.00) (.00) (.00) Public housing . . . . . . . . . . . . . 2.09*** 2.10*** 2.10*** 2.10*** (.01) (.01) (.01) (.01) Crime-prone population. . . . . . . .06*** .05*** .05*** .04*** (.01) (.01) (.01) (.01) Concentrated disadvantage . . . . 2.10*** 2.09*** 2.13*** (.01) (.01) (.02) Residential instability . . . . . . . . .18*** .16*** .16*** (.01) (.01) (.01) Immigrant concentration . . . . . . .11*** .10*** .10*** (.01) (.01) (.02) Foreclosures . . . . . . . . . . . . . . . .05*** .04*** .03* (.01) (.01) (.01) Multigroup segregation (H) . . . . 2.14*** 2.11*** 2.11*** (.01) (.01) (.01) Ethnic polarization (EP) . . . . . . 2.08*** 2.09*** 2.08*** (.02) (.02) (.02) Ethnic diversity (HHI) . . . . . . . .22*** .22*** .23*** (.02) (.02) (.02) Proportion African-American . . . .04** .07** (.01) (.02) Proportion Hispanic . . . . . . . . . .07*** .07*** (.01) (.01) Proportion Asian. . . . . . . . . . . . .01 .03 (.01) (.02) ✓ ✓ ✓ ✓ ✓ Borough fixed effect . . . . . . . . . . . Census tract fixed effect . . . . . . . . ✓ Constant . . . . . . . . . . . . . . . . . . . .78*** .75*** .81*** .78*** .78*** (.04) (.04) (.04) (.04) (.04) NOTE.—N 5 29,632. Estimates are based on multilevel negative binomial regressions. Nos. in parentheses are SEs. * P < .05. ** P < .01. *** P < .001.
Model 2 expands the baseline setup by a set of commonly used neighborhood conflict predictors capturing different area demographics. Their introduction to the model does not diminish the role of edge intensity. The crime-prone population (men ages 15–34), concentration of immigrants, 142
This content downloaded from 130.132.173.053 on July 12, 2016 06:24:45 AM All use subject to University of Chicago Press Terms and Conditions (http://www.journals.uchicago.edu/t-and-c).
Contested Boundaries and Neighborhood Conflict
F IG . 3.—Number of complaint calls by edge intensity. The figure shows the predicted number of complaint calls as a function of edge intensity based on the quadratic specification from model 1 (dashed line) and model 3 (solid line) in table 2. The vertical line indicates the empirically observed range for edge intensity in New York City.
residential instability, and the number of foreclosures are themselves positive predictors of neighbor complaints. By contrast, concentrated disadvantage, the share of a census block covered by public housing, and multigroup segregation reduce the number of complaints throughout all estimated models. This pattern is in line with the argument that citizens in disadvantaged communities are less likely to contact a city agency. Overall, these estimates are intuitive and validate the coded complaint calls as indicators of neighborhood conflict. Model 3 adds ethnic polarization and heterogeneity and model 4 the full set of ethnoracial population shares. Irrespective of the particular specification, the pattern observed in the first model remains stable. The results continue to show a robust curve-linear relation between edge intensity and the number of complaint calls about neighbors. The pattern persists even in model 5 with census tract fixed effects, so that the estimates are confined to within–census tract variations. The only considerable decrease in edge intensity’s explanatory power is caused by the introduction of the two ethnoracial composition indices in model 3. In line with scholars who argue that communication problems, sparse networks, and declines in social control generally erode community life in ethnically diverse settings, our results show that the number of complaint calls increases with the level of ethnic 143
This content downloaded from 130.132.173.053 on July 12, 2016 06:24:45 AM All use subject to University of Chicago Press Terms and Conditions (http://www.journals.uchicago.edu/t-and-c).
American Journal of Sociology heterogeneity. The reduction in the effect of edge intensity is not surprising. By definition, diversity is higher at fuzzy boundaries, and this diversity is associated with a higher number of complaint calls. Accordingly, diversity acts as a confounder so that controlling for the variable in model 3 reduces the association with edge intensity. Nevertheless, the role of edge intensity remains substantial. The diversity-adjusted (solid line) and baseline (dashed line) patterns are both illustrated in figure 3. They show the same curve-linear relation with a maximum around 0.35 and 0.36, respectively. Compared to the first model, the differences are less pronounced but still substantial with a 26% increase from areas surrounded by similar census blocks to fuzzy boundaries at the maximum. Accordingly, the location between homogeneous communities further boosts the number of complaint calls beyond the obstacles of community erosion and disorganization generally found in mixed neighborhoods. Our findings also speak to the established literature on ethnic diversity and polarization. Proponents of the community erosion literature find support in our result that ethnoracial diversity is related to increases in neighborhood conflict. But there is no evidence for the predictions from intergroup competition theories about increased neighborhood conflict in polarized settings. According to model 3, there are even significantly fewer complaint calls in polarized settings, which might be due to multicollinearity.10 Sensitivity Analyses We conduct four sensitivity analyses that address various concerns about our data and modeling strategy. First, we evaluate the validity of the quadratic specification. This specification imposes a certain functional form that nicely captures our expectation about an inverse u-shaped relation, but it may conceal a more complex association. To address this concern, figure 4 compares the quadratic trend with the corresponding relation from a flexible, nonparametric specification.11 We restrict the predictions to the observed range mainly because predictions above that value (indicated by the vertical line) are extremely uncertain. The nonparametric trend presented in 10
The variance inflation factor values are 4.92 for polarization and 5.03 for diversity, which is generally considered as critical. Additional sensitivity analyses show that polarization positively predicts the number of complaint calls when diversity is excluded from the analysis. In support of the community erosion and disorganization literature, ethnoracial diversity turns out to be a more consistent predictor of complaint calls about neighbors. The size of the estimated coefficient is positive and larger both with and without polarization as an additional control variable. 11 The figure is based on generalized additive models (Hastie and Tibshirani 1990). These models predict the number of complaint calls on the basis of a smoothing spline for edge intensity (x-axis in the figure) conditional on the same set of control variables used for the quadratic specification in model 3 in table 2.
144
This content downloaded from 130.132.173.053 on July 12, 2016 06:24:45 AM All use subject to University of Chicago Press Terms and Conditions (http://www.journals.uchicago.edu/t-and-c).
Contested Boundaries and Neighborhood Conflict
F IG . 4.—Number of complaint calls by edge intensity. The figure shows the predicted number of complaint calls as a function of edge intensity based on the quadratic specification from model 3 in table 2 (solid line) and a nonparametric specification (dashed line). The nonparametric specification uses generalized additive models and predicts the number of complaint calls on the basis of a nonparametric term for edge intensity (x-axis) conditional on the same set of control variables.
figure 4 (dashed line) shows a similar curve-linear relation, indicating that our quadratic specification closely resembles the actual association. Second, we test the validity of our coding scheme for the dependent variable by using two alternative definitions. The first alternative focuses noise complaints as a clear and unambiguous indicator of conflict between neighbors (see table B1 in app. B for details on coding). The second alternative uses service requests filed during the evening and in the morning (between 6:00 p.m. and 9:00 a.m.). This definition of the dependent variable alleviates concerns that people file 311 service requests at work or at other locations (note that O’Brien et al. [2015] find that most service requests are filed close to home).12 The results for these two alternative definitions of the dependent 12 The exact timing of service requests is available only after mid-2013. In particular, 311 service requests are processed by different city agencies, and the agencies started to provide exact time codes step by step. The sensitivity analysis focuses on data from 2014 because almost all agencies provided exact time codes by that time. The only important exception is the NYC Department of Housing Preservation and Development (HPD), which never started to include the time of requests. With about 36.7%, HPD service requests make up a significant proportion of all 311 calls and play an important role for our control variable “number of other calls.”
145
This content downloaded from 130.132.173.053 on July 12, 2016 06:24:45 AM All use subject to University of Chicago Press Terms and Conditions (http://www.journals.uchicago.edu/t-and-c).
American Journal of Sociology variable are similar to those of our main analysis. For both noise calls and night calls, they show an inverse u-shaped relation between edge intensity and the number of complaint calls (see table 3). Third, we examine whether our results are driven by spatial autocorrelation. In particular, we reestimate our main models using a spatial Bayesian hierarchical framework that accounts for autocorrelation.13 The findings largely resemble the results presented here partly with slightly higher coefficient estimates for the main effects (see table 3). Finally, we address concerns about the reliability of edge intensity and control variables, which might arise as a result of the “small number” problem. Given the small populations of census blocks and tracts, negligible changes in the number of members of a certain group might translate to large compositional differences, which translate to high edge intensity values. In addition, the margin of error in the census tract estimates from the American Community Survey are generally large (Spielman, Folch, and Nagle 2014). To address this problem, we first create 10 plausible values for each variable based on their sampling distributions. In the next step, we propagate the error rate to our final analyses by repeating the analysis for each set of plausible values. We finally summarize the results on the basis of Rubin’s (1987) repeated imputation summary statistics. These estimates account for the error rate of our predictors. The results again reaffirm our conclusions (edge intensity: d 5 1.39, P < .00; squared term: J 5 21.99, P < .00). Alternative Explanation: Social Disorganization at Neighborhood Boundaries Our findings show a clear curve-linear association between edge intensity and the number of complaint calls on the census block level. The relation supports our argument about contested boundaries. However, general community erosion and disorganization (see the discussion above) could alternatively account for the observed pattern. Fuzzy boundaries might lack the social control of the adjacent homogeneous areas, because neither group feels responsible or has the capacity to enforce social norms (Legewie 2016a). In consequence, fuzzy boundaries might be characterized by disorder and incivilities. This problem is particularly pronounced because 311 data lack information on the identity of callers and the person they complain about. Hence the data do not allow us to test the proposed mechanisms underlying the
13
The model is based on a Bayesian intrinsic conditional autoregressive (CAR) regression (Beale et al. 2010). The adjacency matrix captures all adjacent neighbors with equal weighting. The model is estimated via integrated nested Laplace approximations using the R-INLA software (Beguin et al. 2012). Different choices for prior distributions lead to similar results.
146
This content downloaded from 130.132.173.053 on July 12, 2016 06:24:45 AM All use subject to University of Chicago Press Terms and Conditions (http://www.journals.uchicago.edu/t-and-c).
Contested Boundaries and Neighborhood Conflict TABLE 3 Sensitivity Analysis and Alternative Explanations Noise Calls Night Calls Bayesian CAR Disorder and 2010 2014 Model Civic Controls Edge intensity . . . . . . . . . . . . Edge intensity (squared) . . . . . Control variables . . . . . . . . . .
.91** (.32) 21.54* (.70) ✓
1.25*** (.19) 21.88*** (.39) ✓
1.71*** (.21) 22.30*** (.41) ✓
1.21*** (.19) 21.82*** (.38) ✓
NOTE.—N 5 29,631. Control variables are based on model 3 in table 2. The coefficients and SEs (in parentheses) for the Bayesian CAR model are based on the mean and SD of the posterior distribution. * P < .05. ** P < .01. *** P < .001.
contested boundary hypothesis directly—a limitation further discussed in the conclusion. The models presented in the last section, however, control for the most prominent structural conditions of community erosion and disorganization, namely, concentrated disadvantage, residential instability, and ethnoracial diversity. Here we present two additional pieces of evidence suggesting that community erosion and disorganization are important complementary, but not competing, explanations. First, we extend our regression models with additional control variables for physical disorder and prosocial civic action. The two concepts capture the mechanisms that are at the core of the general community erosion and disorganization literature. They are measured on the basis of an extended coding of 311 service requests. First, we replicate O’Brien et al.’s (2015) measure of physical and social disorder. Their measure is based on Boston’s 311 system (the Constituent Relationship Management system) and tested for validity and reliability via neighborhood audits. While the data from New York City do not allow us to duplicate all aspects of their coding schema, we can replicate their measures of housing issues, graffiti, and trash. Housing issues are the most reliable indicator for physical disorder identified in their study. Second, the measure for prosocial civic action is based on 311 calls related to damaged trees as an instance of collective action or the residents’ willingness to engage for community concerns. In particular, we count the number of 311 service requests related to damaged, broken, or dead trees adjusting for the actual distribution of trees and their condition based on the New York City street tree census conducted by the NYC Department of Parks and Recreation. The fourth column in table 3 displays the results. The model replicates model 3 from table 2 with additional controls for physical disorder and prosocial civic 147
This content downloaded from 130.132.173.053 on July 12, 2016 06:24:45 AM All use subject to University of Chicago Press Terms and Conditions (http://www.journals.uchicago.edu/t-and-c).
American Journal of Sociology action. The findings show that the observed relation between edge intensity and the number of complaint calls remains statistically significant and similar in strength. Second, we collect additional data from Internet forums to examine the salience of race and ethnicity in complaints about neighbors. The 311 data do not allow us to establish the role of race and ethnicity because there is no information on identities of callers or the person they complain about. Our systematic search for open-ended complaints about neighbors in the Internet forum of the website City-Data.com allows us to ensure that ethnoracial conflict is a common topic in complaints about neighbors.14 Our search concentrated on the local forum for New York City and was based on the keywords “noise” and “neighbor.” It resulted in 109 threads containing 4,474 written comments. Most posts are simple approvals and rejections, advice and suggestions, or questions and inquiries. But 803 comments (roughly 18%) include open-ended complaints about neighbors (coded in line with our definition of 311 neighbor complaint calls). This data source, of course, is problematic in many ways such as the well-documented bias in online activity (Golder and Macy 2014). It does, however, capture common themes in complaints about neighbors, often in direct relation to the 311 system in New York City. To examine the salience of race and ethnicity in these open-ended complaints, we code each complaint for references to any social group such as social class, race and ethnicity, age, drug and alcohol abuse, or family status. This strategy allows us to investigate how frequent ethnic categorizations are among those complaints that actually include a group reference (for a similar approach to survey research, see Schaeffer [2013b]). Out of all open-ended complaints, 57% entail a group reference (e.g., drug addicts or teenagers). Among these, race and ethnicity is by far the most common type of categorization invoked in complaints about neighbors. Thus 257 (56%) explicitly mention the racial or ethnic background of the accused culprit(s). The next common categories are persons of low socioeconomic status (35%) and children/teenagers (13%).15 Aside from explicit racial and ethnic references, there are ambiguous and potentially implicit ethnoracial categorizations. Particularly, posts about socioeconomically disadvantaged groups often include implicit ethnoracial
14
City-Data is a popular Internet forum that hosts discussions concerning U.S. cities. As of April 2014, the website had 20 million unique visitors per month with more than 23 million posts and over 1.3 million registered members. 15 A small number of users frequently repeat their complaints within the same thread; we recalculate our statistic as the proportion of users per thread who frame at least one of their complaints in ethnoracial terms. The adjusted statistic is even higher, with 59% of users per thread making at least one ethnoracial reference in their complaints.
148
This content downloaded from 130.132.173.053 on July 12, 2016 06:24:45 AM All use subject to University of Chicago Press Terms and Conditions (http://www.journals.uchicago.edu/t-and-c).
Contested Boundaries and Neighborhood Conflict and sometimes offensive associations, for instance, “I grew up ghetto, i was hood for the first 20yrs of my life. . . . Whenever i see people in my old hood that i grew up with still doing the same **** and even younger people in the area call me a ‘WHITETINO’ ” (user: silverbullnyc, March 22, 2014, 08:43 p.m.). Other posts have less obvious ethnoracial connotations such as “ghetto people,” “hood rats,” or “hood riff raff,” as exemplified by this post from the same thread: “We are complaining about the classless GHETTO mofos that ‘chill’ hard in groups that make their presence known. Usually obnoxious teenagers and young to mid adults. However I’ve seen grown ass men in their 40s and 50s act the same way and guess what the common denominator is??????? They ALL come from a ‘hood’ background and subscribe to THAT culture” (user: hilltopjay, March 5, 2014, 03:46 p.m.). Posts with such implicit ethnoracial categorizations make up another 16% of the complaints blaming specific groups. Accordingly, between 56% and 70% of all complaints that refer to a particular group suggest that the conflict has an ethnoracial dimension. This finding does not overcome the limitations of our data, but it validates the relevance of ethnoracial conflicts for complaints about neighbors. CONCLUSION
Over the last decades, Western societies have experienced a permanent rise in cultural, religious, and racial diversity. Despite the welcomed enrichment, this demographic shift has sparked a debate about eroding social trust and neighborhood conflict among scholars, policy makers, and pundits alike. Previous research has largely focused on ethnoracial diversity and polarization within predefined spatial units as the culprits of social tensions and withdrawal from public neighborhood life. But evidence on generic diversity effects is mixed. In this article, we proposed the contested boundary hypothesis as a refined contextual explanation of neighborhood conflict that takes a city’s broader spatial structures into account. Combining different branches of intergroup competition theory, we argued that neighborhood conflict arises not from mere polarization or mixing but at fuzzy boundaries defined as edges between ethnically homogeneous areas that are poorly defined. Welldefined boundaries with overt transitions from one group’s turf to another’s prevent conflict as they are accepted divisions between groups. At fuzzy boundaries, however, several processes come together and work in concert. The polarized arrangement of two homogeneous groups with exclusive identities results in ambiguities about group rank, and exclusive entitlement claims spill over from the adjacent group turfs. For this reason, poorly defined boundaries sandwiched between ethnically homogeneous areas are more prone to conflict than mixed neighborhoods per se. This 149
This content downloaded from 130.132.173.053 on July 12, 2016 06:24:45 AM All use subject to University of Chicago Press Terms and Conditions (http://www.journals.uchicago.edu/t-and-c).
American Journal of Sociology argument highlights how residential segregation creates contentious areas at the places where groups border. To evaluate our argument, we applied edge detection algorithms from computer vision and image processing to census block and tract data. Based on 4.7 million 311 service requests from New York City, a series of analyses consistently show an inverse u-shaped relation between edge intensity and the frequency of complaint calls. In particular, the number of complaint calls increases by 26% as we move from areas surrounded by similar neighborhoods to those that lie within fuzzy edges between ethnically homogeneous areas. Subsequently, the effect gradually declines as the edges become well defined. These analyses account for all common measures in the neighborhood literature indicating that ethnoracial boundaries are related to neighborhood conflict above and beyond established measures in the literature. Nonetheless, the findings are limited by the observational nature of the data, which makes it difficult to establish causality (Legewie 2012; Morgan and Winship 2014), an important topic for future work on contested boundaries. Our contested boundary hypothesis is a theoretical contribution to intergroup competition theory and neighborhood research more broadly. It refines the generic prediction about conflict and tension in polarized settings by emphasizing the role of cities’ overall sociospatial structures. This approach overcomes the “aspatial” treatment of neighborhoods or regions as isolated contextual units. Instead our research contextualizes a well-known context effect, insofar as we show that even contextual effects depend on the broader sociogeographical structure they are embedded in. Our argument helps to understand both the conditions under which out-groups are particularly likely to be perceived as threatening and the conditions under which ethnoracial mixing has a fair chance to be harmonious, namely, in a city’s integrated areas without any ethnic enclaves based on exclusive identities. Our application of edge detection algorithms allows us to identify sociogeographical boundaries between homogeneous areas. In contrast to previous neighborhood research, the resulting sociogeographical boundaries are features of the city’s broader spatial structures. They stand in sharp contrast to the common “aspatial” treatment of neighborhoods or regions as random, independently sampled contextual units. This methodological innovation allows researchers to study how sociogeographical boundaries and interstitial zones of different types shape further aspects of social life. The importance of residential segregation is well established, and we believe that sociogeographical boundaries complement the role of residential segregation in many regards. Here we have focused on ethnoracial boundaries, but we are certain that other types of sociogeographical boundaries, such as socioeconomic, political, or religious boundaries, also shape important dimensions of social life. We hope that future research
150
This content downloaded from 130.132.173.053 on July 12, 2016 06:24:45 AM All use subject to University of Chicago Press Terms and Conditions (http://www.journals.uchicago.edu/t-and-c).
Contested Boundaries and Neighborhood Conflict will apply and advance the tools used here to examine the conditions under which edge intensity has an influence on various outcomes. Our analyses are based on process-generated data from 4.7 million timeand geo-coded 311 service requests from New York City. We use these data to track neighborhood conflicts as indicated by complaints about neighbors across time and space. Over the last years scholars have become more and more enthusiastic about the potentials of so-called big data and 311 service requests. With millions of analyzed calls, our article is an example of how sociologists can study socially relevant real-life actions of citizens using such data. But our study also shows potential limitations of process-generated data and why such analyses need to be complemented by survey and qualitative research. In our case, the trade-off is that the proposed mechanism remains untested on the microlevel. We have no information about callers’ underlying motives and we are unable to distinguish between intergroup and intragroup conflict. Instead, our analysis is purely ecological. We do not face the “fallacy of ecological inference,” which warns against confusing aggregate with individual-level correlations, as both our dependent variable and proposed explanation are contextual. Nevertheless, residents’ perceptions of threat and motives to defend their neighborhood that underlie our contested boundary hypothesis remain unobserved and should be the subject of future research. We conclude by encouraging scholars to advance our knowledge on the social significance of sociogeographical boundaries. APPENDIX A
Edge Detection Algorithms Over the last decades, researchers have developed a range of different methods to detect boundaries (Jacquez et al. 2000; Logan et al. 2011; Spielman and Logan 2013; Dale and Fortin 2014). Most methods focus on point-specific data with known coordinates that are spaced regularly (lattice or grid) or irregularly. An exception is (Bayesian) areal wombling for irregular-shaped geographic regions such as census tracts (Lu and Carlin 2005). Areal wombling essentially estimates the difference between all pairs of adjacent regions irrespective of the local spatial structure and geographical scale. The design of the approach makes it impossible to detect interstitial or transitional areas located between two groups, which are a key part of our theoretical argument. Following Legewie (2016a), we instead use areal edge detection as a modified edge detection algorithm. The term edge detection refers to a number of mathematical methods with the goal to detect “points in a digital image at which the image brightness changes sharply or, more formally, has discontinuities” (Nosrati et al. 2013, p. 116;
151
This content downloaded from 130.132.173.053 on July 12, 2016 06:24:45 AM All use subject to University of Chicago Press Terms and Conditions (http://www.journals.uchicago.edu/t-and-c).
American Journal of Sociology see also Ziou and Tabbone 1998; Shapiro and Stockman 2001). Existing edge detection algorithms are designed for image data, which are essentially defined as a matrix data structure representing a grid of pixels. Legewie (2016a) adopts and modifies these methods so that they can be applied to irregular spatial units such as census block data as the smallest available census aggregations. In particular, the algorithm involves three steps and uses the proportion of white, black, Hispanic, and Asian residents in each census block as input data (see Legewie [2016a] for details). First, we apply an edge-preserving smoothing algorithm to each of our variables, that is, the shares of the four groups. Smoothing is commonly used to remove noise from the image and is a popular step before applying edge detection algorithms (Nosrati et al. 2013) or other boundary analysis methods (Lu and Carlin 2005). In our case, it helps us to clear our data from measurement errors. It reduces the influence of small variations in the racial composition of census blocks, which distract from the important edges we want to detect. The use of raw, unsmoothed data may identify artificial boundaries between two adjacent areas with small populations. In this context, small changes in population counts for each group can lead to extreme differences in population shares. The edge-preserving smoothing approach is based on a bilateral filter based on spatial distance and distance in the domain of the relevant covariate (Tomasi and Manduchi 1998).16 Figure A1 illustrates the result with a detailed view of Crown Heights South in Brooklyn (raw data on the left side and smoothed data on the right side). The second step of the algorithm measures edge intensity by identifying the places at which the composition of the population changes most rapidly. These compositional changes or discontinuities in a spatial attribute are detected by convolving the (discontinuous) spatial surface with an appropriate kernel. Convolution is a simple mathematical operation denoted by �. The convolution is performed by “moving” the kernel over the spatial surface. The edge intensity for each area is calculated by placing the kernel above the centroid of that area (illustrated in fig. A2b) and then integrating the point-wise product of the kernel and spatial surface over the x- and y-dimensions for the domain of the kernel. The kernel is based on the first derivatives of the multivariate normal distribution with a mean 16 The extent of smoothing is determined by the variance parameter of the Gaussian function in both the spatial and the covariate domains. In our analyses, we use an SD of 0.15 for the covariate domain (other values lead to similar results) and different parameters for the spatial Gaussian ranging from an SD of 250 to 1,000 feet (about 76–300 meters). The results presented here use 569.4 feet, which is the average distance between centroids of neighboring blocks. With this scale parameter, a block with an average distance to the focal block is weighted with a factor of 0.52 (normalized weights with one corresponding to zero distance for the focal block itself ).
152
This content downloaded from 130.132.173.053 on July 12, 2016 06:24:45 AM All use subject to University of Chicago Press Terms and Conditions (http://www.journals.uchicago.edu/t-and-c).
F IG . A1.—Illustration of smoothing for Crown Heights South, Brooklyn This content downloaded from 130.132.173.053 on July 12, 2016 06:24:45 AM All use subject to University of Chicago Press Terms and Conditions (http://www.journals.uchicago.edu/t-and-c).
American Journal of Sociology
F IG . A2.—Areal edge detection. a, Kernel in the x-direction; b, kernel placed over areal unit
of zero and a 2 � 2 variance-covariance matrix with zero off-diagonals and a single variance parameter for scaling in the diagonal (see fig. A2a). The spatial surface is discontinuities and is defined by the areal data with the value at point (x, y) equal to the racial composition of the areal unit that contains the point (see Legewie [2016a] for a formal description of the procedure). Without any compositional changes around the focal area, the left and right (or top and bottom) of the kernel balance each other out. When the composition of the population changes, however, the returned value is positive or negative. 154
This content downloaded from 130.132.173.053 on July 12, 2016 06:24:45 AM All use subject to University of Chicago Press Terms and Conditions (http://www.journals.uchicago.edu/t-and-c).
Contested Boundaries and Neighborhood Conflict The result is the gradient for each census block in the x-direction. The analogous gradient for the y-direction is based on a comparison of the area north and south of the focal block, not west and east as in figure A2. The changes in the two directions are combined to obtain the overall magnitude of change in the proportion of residents from a specific racial group. The corresponding edge map for one of the four groups (blacks) is shown in figure 2 for New York and in figure 1 for a detailed view of Crown Heights in Brooklyn. This approach accounts for the irregular size, shape, and spacing of surrounding blocks by integrating over the entire nonzero domain of the kernel. Areas that are large and centrally located in the kernel domain receive higher weights compared to areas that are small or located at the margin of the kernel. The spatial scale parameter makes it possible to study boundaries at different geographical scales. The results presented here are based on a locally adaptive scale parameter that is defined as the average distance to the surrounding blocks (the average distance between blocks is 569.4 feet).17 In the third and final step, we combine the information from the four racial groups into one measure of edge intensity. This operation resembles the combination of different color channels for edge detection of RGB (red, green, blue) images (Nadernejad, Sharifzadeh, and Hassanpour 2008, p. 1512). There are different ways to combine the edge maps. The goal of our approach is to identify edges between two ethnically homogeneous areas. To accomplish this goal, we simply multiply the values for the two groups with the highest edge intensity. As a consequence, changes in racial composition from one dominant group to a mixed neighborhood get assigned lower values whereas transitions between two ethnically homogeneous areas get higher values. As an example, consider the transition from a neighborhood that is entirely white (100%) to a mixed neighborhood with an equal share for each of the four groups. In this scenario, the proportion of white residents drops by 75% and the share of the other groups increases by 25%, which translates to an edge intensity of 0.75 for whites and 0.25 for the other groups. Following our approach to combine the edge maps for the different racial groups, this scenario implies an overall edge intensity of 0.188. Now imagine that the white area changes to a predominantly black neighborhood with 75% black and 25% white residents. In this case, the edge intensity for whites remains unchanged (75% drop in population share) but the edge intensity for blacks is 0.75 insofar as the proportion of black residents increases from zero to 75%. This translates to an overall edge 17 For a constant standard deviation, the findings are consistent across an SD of about 300–1,200 feet. Smaller parameters essentially eliminate all boundaries because in most cases the entire kernel domain falls into an area. Future research should explore the role of spacial scale for neighborhood boundaries.
155
This content downloaded from 130.132.173.053 on July 12, 2016 06:24:45 AM All use subject to University of Chicago Press Terms and Conditions (http://www.journals.uchicago.edu/t-and-c).
American Journal of Sociology intensity of 0.56.18 Accordingly, our approach to combine the edge maps of different racial groups highlights transitions between two ethnically homogeneous areas, which are at the center of our theoretical argument. The results are illustrated in figure 1 with additional discussion in the main text of the article. APPENDIX B
Coding of Service Requests For the coding of a service request as a complaint about neighbors, we rely on the classification and brief standard description that are part of each 311 service request. In particular, the 4.7 million 311 service requests from 2010 and 2014 are classified into 1,386 complaint type/description combinations. Our analysis focuses on complaint calls that indicate neighborhood conflict, which we operationalize as complaints about the behavior of particular persons or a group of people. Typical examples are complaint type “noise” and its associated description “loud music” or complaint type “blocked driveway” and its associated description “no access.” Table B1 discusses some of the most common service requests in 2010 coded as complaints about neighbors. The coding excludes complaints about disorderly conditions such as “graffiti” or “condition attracting rodents,” which have been the focus of previous studies (Boggess and Maskaly 2014; O’Brien et al. 2015). Such signs of physical disorder could indicate that residents take care of their neighborhood, which contradicts our intention to measure neighborhood conflict. As a second variable, we also code service requests that are unrelated to neighborhood conflict, such as “sewer catch basin clogged/ flooded” or “snow, icy sidewalk” (table B1 provides further typical examples). Other service requests allow us to control for the “contacting propensity” as the general tendency to use the 311 system. Residents of disadvantaged communities, for example, might hesitate to contact authorities. The validity of our indicator for neighborhood conflict can be evaluated empirically by looking at its associations with well-established neighborhood conflict predictors. As discussed in the results section, these associations indeed cross-validate our measure. For the actual coding, we sorted the 1,386 complaint types by frequency. The first 300 make up 95.7% of all calls and were coded individually by both authors. Difficult cases were flagged and discussed in multiple meetings, which allowed us to develop a consensus. For all flagged cases, both 18
Note that this fabricated example illustrates the point but does not reflect the complexity of our algorithms based on smoothing and continuous kernels. The arbitrary values used in this example can therefore not be compared to the scale of our actual edge intensity variable.
156
This content downloaded from 130.132.173.053 on July 12, 2016 06:24:45 AM All use subject to University of Chicago Press Terms and Conditions (http://www.journals.uchicago.edu/t-and-c).
This content downloaded from 130.132.173.053 on July 12, 2016 06:24:45 AM All use subject to University of Chicago Press Terms and Conditions (http://www.journals.uchicago.edu/t-and-c). 28.7
2.7
17.7 9.3 7.8
Blocked driveway . . . . . . . . . . . . . . .
Illegal conversion of residential building/space . . . . . . . . . . . . . . . .
Typical other service requests: Heat. . . . . . . . . . . . . . . . . . . . . . . . .
Plumbing . . . . . . . . . . . . . . . . . . . . .
Paint/plaster . . . . . . . . . . . . . . . . . . .
5.7
6.8
13.0
.2
2.5
2.6
All Calls (%) Description
The most common service request unrelated to neighborhood conflict refers to inadequate heating. A number of service requests that are unrelated to neighborhood conflict refer to plumbing issues such as water leaks, water supply, basin/sink, or bathtub. A number of service requests that are unrelated to neighborhood conflict refer to paint or plaster conditions at ceiling, walls, window/frame, doors/ frame, or radiator.
The category illegal conversion of residential building/space includes the (potentially illegal) short-term renting of private living space through Airbnb or similar websites and again is distinct from other categories that refer to commercial activities.
A number of categories (23) refer to noise complaints about neighbors including noise—street/sidewalk: loud music/party, noise: loud music/ nighttime, noise—park: loud music/party, or noise: neighbor. Excluded from this coding are commercial noise complaints such as noise— commercial: loud music or complaints about noise from construction or helicopters. In sensitivity analysis, we replicate our finding on the basis of noise complaints exclusively, with largely similar results. The categories blocked driveway: no access and blocked driveway: partial access are two of the most frequent service requests coded as neighborhood conflict. Importantly, these categories are distinct from other blocked driveway requests related to fallen tree branches or construction.
NOTE.—N 5 147,828 neighbor complaint calls; there were 1,630,955 service requests in 2010.
29
Typical complaint calls about neighbors: Noise compaints . . . . . . . . . . . . . . . .
Category
Conflict/ Other Calls (%)
TABLE B1 Coding of Typical 311 Service Requests
American Journal of Sociology authors justified their coding decision and quickly came to an agreement considering that the coding scheme is relatively simple. The other 1,086 call types (4.3% of all calls) were coded by a trained research assistant. To evaluate the quality of coding, both authors checked a random 20% sample (218 categories). The error rate in this sample was 0.92% so that about 13 call types are affected by coding errors, which extrapolates to 0.97% of all calls. Overall, our coding results in 10.3% complaint calls and 66.9% other service requests in 2010 (see table B1 for example categories). We exclude the remaining 22.8% calls as ambiguous. We aggregate the number of complaints and other service requests to the census block level. On average, there are 3.81 complaint calls and 30.7 other calls in a census block in 2010. REFERENCES Alesina, Alberto, Reza Baqir, and William Easterly. 1999. “Public Goods and Ethnic Divisions.” Quarterly Journal of Economics 114:1243–84. Allport, Gordon W. 1954. The Nature of Prejudice. Cambridge: Perseus. Banton, Michael. 1983. Racial and Ethnic Competition. Cambridge: Cambridge University Press. Beale, Colin M., Jack J. Lennon, Jon M. Yearsley, Mark J. Brewer, and David A. Elston. 2010. “Regression Analysis of Spatial Data.” Ecology Letters 13:246–64. Beguin, Julien, Sara Martino, Håvard Rue, and Steven G. Cumming. 2012. “Hierarchical Analysis of Spatially Autocorrelated Ecological Data Using Integrated Nested Laplace Approximation.” Methods in Ecology and Evolution 3:921–29. Blalock, Hubert M. 1967. Toward a Theory of Minority-Group Relations. New York: Capricorn. Blumer, Herbert. 1958. “Race Prejudice as a Sense of Group Position.” Pacific Sociological Review 1:3–7. Boggess, Lyndsay N., and Jon Maskaly. 2014. “The Spatial Context of the DisorderCrime Relationship in a Study of Reno Neighborhoods.” Social Science Research 43:168–83. Campbell, Elizabeth, Julia R. Henly, Delbert S. Elliott, and Katherine Irwin. 2009. “Subjective Contruction of Neighborhood Boundaries: Lessons from a Qualitative Study of Four Neighborhoods.” Journal of Urban Affairs 31:461–90. Dale, Martin R. T., and Marie-Josee Fortin. 2014. Spatial Analysis: A Guide for Ecologists. Cambridge: Cambridge University Press. DeSena, Judith N. 1990. Protecting One’s Turf: Social Strategies for Maintaining Urban Neighborhoods. Lanham, Md.: University Press of America. Desmet, Klaus, Ignacio Ortuño Ortín, and Romain Wacziarg. 2012. “The Political Economy of Linguistic Cleavages.” Journal of Development Economics 97:322–38. Desmond, Matthew, and Nicol Valdez. 2013. “Unpolicing the Urban Poor: Consequences of Third-Party Policing for Inner-City Women.” American Sociological Review 78:117–41. Esteban, Joan-María, and Debraj Ray. 1994. “On the Measurement of Polarization.” Econometrica 62:819–51. Gelman, Andrew, and Jennifer Hill. 2007. Data Analsysis Using Regression and Multilevel/Hierarchichal Models. Cambridge: Cambridge University Press. Golder, Scott A., and Michael W. Macy. 2014. “Digital Footprints: Opportunities and Challenges for Online Social Research.” Annual Review of Sociology 40:129–52.
158
This content downloaded from 130.132.173.053 on July 12, 2016 06:24:45 AM All use subject to University of Chicago Press Terms and Conditions (http://www.journals.uchicago.edu/t-and-c).
Contested Boundaries and Neighborhood Conflict Gould, Roger V. 2003. Collision of Wills: How Ambiguity about Social Rank Breeds Conflict. Chicago: University of Chicago Press. Grannis, Rick. 2009. From the Ground Up: Translating Geography into Community through Neighbor Networks. Princeton, N.J.: Princeton University Press. Grattet, Ryken. 2009. “The Urban Ecology of Bias Crime: A Study of Disorganized and Defended Neighborhoods.” Social Problems 56:132–50. Green, Donald P., Dara Z. Strolovitch, and Janelle S. Wong. 1998. “Defended Neighborhoods, Integration, and Racially Motivated Crime.” American Journal of Sociology 104:372–403. Habyarimana, James, Macartan Humphreys, Daniel N. Posner, and Jeremy M. Weinstein. 2007. “Why Does Ethnic Diversity Undermine Public Goods Provision?” American Political Science Review 101:709–25. Hastie, Trevor J., and Robert J. Tibshirani. 1990. Generalized Additive Models. Boca Raton, Fla.: Chapman & Hall. Hipp, John R., George E. Tita, and Lyndsay N. Boggess. 2009. “Intergroup and Intragroup Violence: Is Violent Crime an Expression of Group Conflict or Social Disorganization?” Criminology 47:521–64. Hirschman, Albert O. 1964. “The Paternity of an Index.” American Economic Review 54:761–62. Hopkins, Daniel J. 2010. “Politicized Places: Explaining Where and When Immigrants Provoke Local Opposition.” American Political Science Review 104:40–60. Idicheria, Charis Elizabeth, Alexander Schellong, and Jobst Fiedler. 2012. “A Review of 311 in New York City.” Technical report. Interdisziplinäre Studien zu Politik, Recht, Administration und Technologie. Hamburg. Jacquez, G. M., S. Maruca, and M.-J. Fortin. 2000. “From Fields to Objects: A Review of Geographic Boundary Analysis.” Journal of Geographical Systems 2:221–41. Kimenyi, Mwangi S. 2006. “Ethnicity, Governance and the Provision of Public Goods.” Journal of African Economics 15:62–99. Kramer, Rory. 2015. “Defensible Spaces in Philadelphia: Exploring Neighborhood Boundaries through Spatial Analysis.” Working paper. Villanova University. Lamont, Michèle, and Virag Molnar. 2002. “The Study of Boundaries in the Social Sciences.” Annual Review of Sociology 28:167–95. Legewie, Joscha. 2012. “Die Schätzung von Kausalen Effekten: Überlegungen zu Methoden der Kausalanalyse anhand von Kontexteffekten in der Schule.” Kölner Zeitschrift für Soziologie und Sozialpsychologie 64:123–53. ———. 2013. “Terrorist Events and Attitudes toward Immigrants: A Natural Experiment.” American Journal of Sociology 118:1199–1245. ———. 2016a. “Living on the Edge: Neighborhood Boundaries and the Spatial Dynamics of Violent Crime.” Working paper, New York University. ———. 2016b. “Racial Profiling and Use of Force in Police Stops: How Local Events Trigger Periods of Increased Discrimination.” American Journal of Sociology 122 (2), in press. Lerman, Amy E., and Vesla Weaver. 2014. “Staying Out of Sight? Concentrated Policing and Local Political Action.” Annals of the American Academy of Political and Social Science 651:202–19. Levine, Jeremy R., and Carl Gershenson. 2014. “From Political to Material Inequality: Race, Immigration, and Requests for Public Goods.” Sociological Forum 29: 607–27. Lim, May, Richard Metzler, and Yaneer Bar-Yam. 2007. “Global Pattern Formation and Ethnic/Cultural Violence.” Science 317:1540–44. Logan, John R. 2012. “Making a Place for Space: Spatial Thinking in Social Science.” Annual Review of Sociology 38:507–24. Logan, John R., Seth Spielman, Hongwei Xu, and Philip N. Klein. 2011. “Identifying and Bounding Ethnic Neighborhoods.” Urban Geography 32:334–59.
159
This content downloaded from 130.132.173.053 on July 12, 2016 06:24:45 AM All use subject to University of Chicago Press Terms and Conditions (http://www.journals.uchicago.edu/t-and-c).
American Journal of Sociology Long, J. Scott, and Jeremy Freeze. 2005. Regression Models for Categorical and Limited Dependent Variables. College Station, Tex.: Stata Press. Lu, Haolan, and Bradley P. Carlin. 2005. “Bayesian Areal Wombling for Geographical Boundary Analysis.” Geographical Analysis 37:265–85. Lyons, Christopher J. 2007. “Community (Dis)Organization and Racially Motivated Crime.” American Journal of Sociology 113:815–63. Lyons, Christopher J., María B. Vélez, and Wayne A. Santoro. 2013. “Neighborhood Immigration, Violence, and City-Level Immigrant Political Opportunities.” American Sociological Review 78:604–32. Massey, Douglas, and Nancy Denton. 1998. American Apartheid: Segregation and the Making of the Underclass. Cambridge, Mass.: Harvard University Press. Minkoff, Scott L. 2016. “NYC 311: A Tract-Level Analysis of Citizen-Government Contacting in New York City.” Urban Affairs Review 52:211–46. Montalvo, Jose G., and Marta Reynal-Querol. 2005. “Ethnic Diversity and Economic Development.” Journal of Development Economics 76:293–323. Morgan, Stephen L., and Christopher Winship. 2014. Counterfactuals and Causal Inference: Methods and Principles for Social Research. Cambridge: Cambridge University Press. Nadernejad, Ehsan, Sara Sharifzadeh, and Hamid Hassanpour. 2008. “Edge Detection Techniques: Evaluations and Comparisons.” Applied Mathematical Sciences 2: 1507–20. Nosrati, Masoud, Ronak Karimi, Mehdi Hariri, and Kamran Malekian. 2013. “Edge Detection Techniques in Processing Digital Images: Investigation of Canny Algorithm and Gabor Method.” World Applied Programming 3:116–21. O’Brien, Daniel Tumminelli, Robert J. Sampson, and Christopher Winship. 2015. “Ecometrics in the Age of Big Data Measuring and Assessing ‘Broken Windows’ Using Large-Scale Administrative Records.” Sociological Methodology 45:101–47. Olzak, Susan. 1992. The Dynamics of Ethnic Competition and Conflict. Stanford, Calif.: Stanford University Press. Page, Scott E. 2008. The Difference: How the Power of Diversity Creates Better Groups, Firms, Schools, and Societies. Princeton, N.J.: Princeton University Press. Papachristos, Andrew V., David M. Hureau, and Anthony A. Braga. 2013. “The Corner and the Crew: The Influence of Geography and Social Networks on Gang Violence.” American Sociological Review 78:417–47. Pattillo, Mary E. 2005. “Black Middle-Class Neighborhoods.” Annual Review of Sociology 31:305–29. ———. 2013. Black Picket Fences: Privilege and Peril among the Black Middle Class, 2d ed. Chicago: University of Chicago Press. Pettigrew, Thomas F. 1998. “Intergroup Contact Theory.” Annual Review of Psychology 49:65–85. Putnam, Robert D. 2007. “E Pluribus Unum: Diversity and Community in the TwentyFirst Century.” Scandinavian Political Studies 30:137–74. Rabe-Hesketh, Sophia, and Anders Skrondal. 2008. Multilevel and Longitudinal Modeling Using Stata. College Station, Tex.: Stata Press. Radil, Steven M., Colin Flint, and George E. Tita. 2010. “Spatializing Social Networks: Using Social Network Analysis to Investigate Geographies of Gang Rivalry, Territoriality, and Violence in Los Angeles.” Annals of the Association of American Geographers 100:307–26. Reardon, Sean F., and Glenn Firebaugh. 2002. “Measures of Multigroup Segregation.” Sociological Methodology 32:33–67. Rieder, Jonathan. 1985. Canarsie: The Jews and Italians of Brooklyn against Liberalism. Cambridge, Mass.: Harvard University Press. Rubin, Donald B. 1987. Multiple Imputation for Nonresponse in Surveys. New York: Wiley.
160
This content downloaded from 130.132.173.053 on July 12, 2016 06:24:45 AM All use subject to University of Chicago Press Terms and Conditions (http://www.journals.uchicago.edu/t-and-c).
Contested Boundaries and Neighborhood Conflict Sampson, Robert J. 2012. Great American City: Chicago and the Enduring Neighborhood Effect. Chicago: University of Chicago Press. Sampson, Robert J., and W. Byron Groves. 1989. “Community Structure and Crime: Testing Social-Disorganization Theory.” American Journal of Sociology 94:774– 802. Sampson, Robert J., Jeffrey D. Morenoff, and Thomas Gannon-Rowley. 2002. “Assessing ‘Neighborhood Effects’: Social Processes and New Directions in Research.” Annual Review of Sociology 28:443–78. Sampson, Robert J., and Stephen W. Raudenbush. 1999. “Systematic Social Observation of Public Spaces: A New Look at Disorder in Urban Neighborhoods.” American Journal of Sociology 105:603–51. Schaeffer, Merlin. 2013a. “Can Competing Diversity Indices Inform Us about Why Ethnic Diversity Erodes Social Cohesion? A Test of Five Diversity Indices in Germany.” Social Science Research 42:755–74. ———. 2013b. “Which Groups Are Mostly Responsible for Problems in Your Neighbourhood?” Ethnic and Racial Studies 36:156–78. ———. 2014. Ethnic Diversity and Social Cohesion: Immigration, Ethnic Fractionalization and Potentials for Civic Action. Farnham: Ashgate. Shapiro, Linda G., and George C. Stockman. 2001. Computer Vision. Upper Saddle River, N.J.: Prentice Hall. Shaw, Clifford R., and Henry D. McKay. 1942. Juvenile Delinquency and Urban Areas. Chicago: University of Chicago Press. Skogan, Wesley G. 1990. Disorder and Decline: Crime and the Spiral of Decay in American Neighborhoods. New York: Free Press. Spielman, Seth E., David Folch, and Nicholas Nagle. 2014. “Patterns and Causes of Uncertainty in the American Community Survey.” Applied Geography 46:147–57. Spielman, Seth E., and John R. Logan. 2013. “Using High-Resolution Population Data to Identify Neighborhoods and Establish Their Boundaries.” Annals of the Association of American Geographers 103:67–84. Suttles, Gerald D. 1972. Social Construction of Communities. Chicago: University of Chicago Press. Taylor, Ralph B. 2001. Breaking Away from Broken Windows: Baltimore Neighborhoods and the Nationwide Fight against Crime, Grime, Fear, and Decline. Boulder, Colo.: Westview. Tomasi, Carlo, and Roberto Manduchi. 1998. “Bilateral Filtering for Gray and Color Images.” Pp. 839–46 in Sixth International Conference on Computer Vision. New York: IEEE. van der Meer, Tom, and Jochem Tolsma. 2014. “Ethnic Diversity and Its Effects on Social Cohesion.” Annual Review of Sociology 40:459–78. Wimmer, Andreas. 2008. “The Making and Unmaking of Ethnic Boundaries: A Multilevel Process Theory.” American Journal of Sociology 113:970–1022. Ziou, Djemel, and Salvatore Tabbone. 1998. “Edge Detection Techniques—an Overview.” International Journal of Pattern Recognition and Image Analysis 8:537–59.
161
This content downloaded from 130.132.173.053 on July 12, 2016 06:24:45 AM All use subject to University of Chicago Press Terms and Conditions (http://www.journals.uchicago.edu/t-and-c).