732
IEEE JOURNAL OF SELECTED TOPICS IN SIGNAL PROCESSING, VOL. 4, NO. 4, AUGUST 2010
Context-Adaptive Information Flow Allocation and Media Delivery in Online Social Networks Jacob Chakareski and Pascal Frossard, Senior Member, IEEE
Abstract—This paper investigates context-driven flow allocation and media delivery in online social networks. We exploit information on contacts and content preferences found in social networking applications to provide efficient network services and operation at the underlying transport layer. We formulate a linear programming framework that maximizes the information flow–cost ratio of the transport network serving the nodes in the social graph. For practical deployments, we also design a distributed version of the optimization framework that provides similar performance to its centralized counterpart, with lower complexity. In addition, we devise a tracker-based system for efficient content discovery in peer-to-peer (P2P) systems based on social network information. Finally, we design a context-aware packet scheduling technique that maximizes the utility of media delivery among the members of the social network. We provide a comprehensive investigation of the performance of our optimization strategies through both simulations and analysis. We demonstrate their significant advantages over several performance factors relative to conventional solutions that do not employ social network information in their operation. Index Terms— Context-driven networking, flow allocation, information flow-cost ratio, media delivery, online social networks, peer-to-peer systems, packet scheduling.
I. INTRODUCTION
S
OCIAL networks have become an essential part of our online existence. Whether we share photos with our friends, broadcast personal videos to our family and relatives, or exchange business contacts with prospective employees and employers, we tend to carry out all these activities through social networking sites that we frequent on a daily basis. Names like Flickr [1], YouTube [2], and Facebook [3] have become household words of the everyday parlance. A typical profile of a member of an online social networking site contains information on his/her contacts, i.e., other members of the site with whom this person affiliates and also information on preferences of the member regarding multimedia content. For instance, what kind of movies or music videos the member likes to watch.
Manuscript received November 24, 2009; revised April 12, 2010; accepted April 13, 2010. Date of publication April 29, 2010; date of current version July 16, 2010. This work was supported by the Swiss National Science Foundation under Ambizione Grant PZ00P2-126416. The associate editor coordinating the review of this manuscript was Dr. K. J. Ray Liu. The authors are with the Signal Processing Laboratory (LTS4), Ecole Polytechnique Fédérale de Lausanne (EPFL), 1015 Lausanne, Switzerland (e-mail: www.jakov.org;
[email protected]). Color versions of one or more of the figures in this paper are available online at http://ieeexplore.ieee.org. Digital Object Identifier 10.1109/JSTSP.2010.2049413
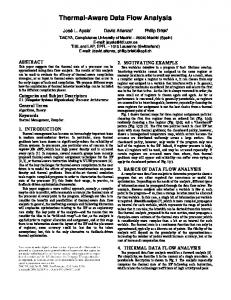
Fig. 1. Context-driven flow allocation and media delivery: employing social network information on contacts and content preferences in order to enhance the transport network’s performance.
Every time we share content online with our friends, many of whom are members of the same social networking sites as we are, we employ the underlying transport network, i.e., the Internet to achieve this goal. To date, the operations of these two networking layers, i.e., the social one and the transport one, have been kept in a complete separation. However, it can be easily imagined that in such scenarios the organization of the content delivery can be improved by taking into account social network data associated with the streaming participants. This brings us to the motivation behind the present work. Specifically, we are interested in investigating methods that utilize social network information for providing enhanced performance of the transport network, as illustrated in Fig. 1. We denote this paradigm context-driven flow allocation and media delivery as contextual information, such as contacts and content preferences, associated with the participants is utilized to drive the transport network toward higher operating efficiency. To the best of our knowledge, there have not been prior works directly related to the present paper. Still, we find examples of related ideas of exploring social network information in other contexts. For instance, in [4] and [5], the authors propose to invite the social network friends (contacts) of a peer to join the same P2P system in order to build trust relationships and avoid free-riding in the system. Moving in the opposite direction, the work in [6] considers building social network relationships between peers in a file-sharing overlay system based on their overlaps in terms of mp3 file selections. In general, there are many synergies between the subjects of cooperation and trust in P2P systems and the paradigm of social networks, as studied for example in [7]–[9]. In particular, in the first work the authors create peer helpers out of the contacts of a peer in an existing social network, while the latter two works explore the topic of colluder detection in P2P systems based on social network mem-
1932-4553/$26.00 © 2010 IEEE
CHAKARESKI AND FROSSARD: CONTEXT-ADAPTIVE INFORMATION FLOW ALLOCATION AND MEDIA DELIVERY
bers. Further examples of utilization of social network data include online advertising [10], [11] and routing in ubiquitous computing environment [12]. Finally, it should be mentioned that cross-layer techniques represent a conceptually related approach to optimizing network performance as they adaptively combine various control mechanisms enabled at different layers of the network hierarchy stack [13]–[15]. The present paper investigates the subject of interest in multiple ways. First, we design a linear programming optimization framework that maximizes the expected information flow-cost ratio of the transport network based on the social graph, the content preferences of the nodes, and the network cost of sending data on each edge of the graph. We call this the top-down approach as it imposes (higher) social network layer information on the underlying transport medium. Then, we design a peer tracker for efficient content discovery in P2P systems based on contextual information associated with the peers, such as their contacts and content preferences in the affiliated social network. We denote this the bottom-up approach as the nodes now can freely associate with one another at the transport layer while contextual information is still exploited via the tracking server. Finally, we design a utility-based scheduling technique that allows the nodes in the social network to efficiently communicate among themselves the data packets comprising the selected media presentation. The rest of the paper is structured as follows. First, in the following section we introduce the models that we employ in the design of our optimization techniques and throughout the analysis of their performance. Then, in Section III we describe the proposed linear programming framework and its design criteria. In the same section, we also design a distributed version of the optimization framework that is more suitable for deployments in practical systems. Next, in Section IV, we present the design of the tracking server for peer selection in P2P systems that takes advantage of contextual information in order to provide an appropriate set of peer neighbors for a new node joining the system. The utility-based packet scheduling technique for efficient communication of media data in a social network is then described in Section V. The performance of our optimization strategies and their advantages relative to conventional solutions are subsequently studied in Section VI. Finally, concluding remarks are provided in Section VII. II. PRELIMINARIES Here, we describe the models that we will use in the sections denote the set of neighbors in the sothat follow. First, let cial network graph for node . These correspond to our contacts in the online social network where we participate. Then, denote the set of media assets that the let members of the social network are interested in sharing with each other. Finally, the set describes the . We norrelative preferences of node for the content in malize these quantities so that they correspond to the probabilities of selecting each of the assets by peer , i.e., . In other words, denotes the probability that node is interested in exchanging (transmit/receive) asset with its neighbors. It should be mentioned that in the case when a new media
733
TABLE I KEY NOTATION
asset is introduced into the social network, the preference vectors should be renormalized to take its contribution into account. In Table I, we summarize the key notation used throughout the paper. III. MAXIMIZING INFORMATION FLOW The present section investigates the most efficient allocation of resources at the transport layer. Network connections at this level are established based on the social graph. Content preferences are employed to perform a probabilistic analysis of the operation of the transport network since ahead of time the actual choice of a media asset for each node in the graph is not known. We proceed by presenting in detail the optimization problem of interest. denote the rate at which node transmits data assoLet denote the ciated with content to node . Furthermore, let . This could be cost of sending data on the network path for instance the delay of sending a unit of data between and , as provided by the Internet service provider (ISP) operating the underlying network. Then, the expected information flow-cost . We are ratio for peer can be written as interested in assigning data rates between the nodes of the social graph such that the overall information flow-cost ratio across the data delivery network is maximized. The constraints that need to be observed while doing this are the nodes’ uplink and downlink capacities. In particular, the expected overall flow of information from node toward its neighbors should not exceed its uplink capacity . Similarly, the expected overall information rate toward node should not exceed its downlink capacity . Given the above the optimization problem of interest can be formally written as (1) (2) (3)
734
IEEE JOURNAL OF SELECTED TOPICS IN SIGNAL PROCESSING, VOL. 4, NO. 4, AUGUST 2010
where (2) and (3) ensure that the overall information flow from/to a node does not exceed its uplink/downlink capacity, respectively. It is clear that (1)–(3) describe a linear programming problem. We solve P1 by employing an algorithm based on the interior point method for convex optimization [16]. The solution is globally optimal and unique due to the nature of P1. However, solving P1 is done in a centralized manner and requires global knowledge of all the related parameters. To relax this condition, we design in the following a distributed version of P1 that is more amenable to practical implementation. The distributed optimization consists of computational steps that are executed locally by the nodes and message passing steps that are used to exchange the results of the local computations. The nodes alternate between them in order to achieve a consensus in regard to the optimal information flow in the network. In particular, first each node solves independently for its optimal information rates toward its neighbors such that its uplink capacity is not exceeded. That is is interested in solving
(4) Using the method of Lagrange multipliers [17], we can transform (4) into an unconstrained optimization problem as follows:
(5) is the associated Lagrange multiplier. Let , denote the optimal information rates obtained as a solution to (5). Such computed rates can potentially exceed the downlink capacity of node on the receiving end of path . Therefore, before sending at these rates each node communicates their values to the destined recipients together with its preference set . Each receiving node in turn collects this information from its neighbors. The node then scales the expected information flow toward it such that its downlink capacity is not exceeded. Specifically, recomputes the rates using
Fig. 2. Distributed information flow optimization.
be prospectively used. In particular, for all links such that node fixes its outgoing rates . The rates for the remaining links are then recomputed using the optimization described in (4) and (6). We repeat the whole procedure until either one of the two rate conditions is satisfied fully. In essence, by rerunning the optimization we may potentially redirect the spare uplink capacity toward network links that would not have been utilized to such an extent originally because of their higher network cost. An algorithmic description of the complete procedure for distributed optimization is provided in Fig. 2. It should be mentioned that the search for the optimal Lagrange multiplier employed in (5) is done in an iterative fashion, until convergence. In particular, the nodes alternate between recomputing the optimal rates using (5) and using the following expression:
where
(6) Finally, node sends back the scaled rates to its neighbors . Upon receiving this information, each node controls in or whether . If one of these conditions is true, the node can then engage in information exchange with its neighbors at data rates . Specifically, in the former case node cannot push data toward its neighbors faster than because of their limited downlinks, while in the latter case has used up all its uplink capacity for communicating data with the neighbors in . On the other hand, if the rate conditions above are only partially true, node still has some spare uplink capacity that can
(7) where is a small constant that ensures stability and rapid convergence of the iterative search in (7), while the function is equal to for , and to zero, otherwise. Properties of sub-gradient algorithms, such as the one shown in (7), including their stability and convergence have been studied in the past, e.g., in [18] and [19]. It should also be mentioned that the amount of information that the nodes need to exchange according to the algorithm in Fig. 2 is rather insignificant. In particular, the data representing the content preference vector and the computed outgoing rates that need to be sent to every neighbor of a node can typically fit into a single IP packet. The same holds true for the data representing the adjusted transmission rates that a receiver needs to return to its neighbors. Therefore, in total there are four IP packets1 that two neighboring nodes need to exchange for each round of the optimization in Fig. 2. The number of times that the optimization is repeatedly run by a node is bounded between one and the size of its neighborhood. Generally, not more than a few iterations of the optimization algorithm would be needed to compute the transmission rates for a node. For all practical purposes, such a message passing overhead can be safely ignored. 1In
other words, two packets for each neighbor of a node.
CHAKARESKI AND FROSSARD: CONTEXT-ADAPTIVE INFORMATION FLOW ALLOCATION AND MEDIA DELIVERY
735
Fig. 3. Tracker selects a random subset of peers for the new node.
IV. TRACKER-BASED PEER SELECTION The techniques designed in Section III allow us to take advantage of online social network data such as contacts and content preferences in order to study the optimal flow of information between the nodes in the network. They compute expectations over the whole ensemble of prospective content and as such can be used by ISPs and Autonomous System2 (AS) administrators to provision and efficiently operate their networks when they serve as the underlying transport medium for online social networks. In this section, we consider another scenario where social network information can be exploited in order to provide enhanced networking services. Specifically, P2P systems have been steadily growing in popularity because of their capability to deliver large amounts of data to large audiences at low cost [20], [21]. A key feature of every practical P2P deployment in the Internet is the existence of a tracking server that assists new peers when they join the overlay network. In particular, the tracking server provides a set of nodes already present in the network which the newly joining node can contact when searching for the content of interest. However, these prospective neighbors are selected at random by the server and as such they may not be helpful to the new peer in finding the desired content in the overlay. In particular, they may have completely different content preferences relative to the new peer. Moreover, these prospective neighbors may exhibit very long distances from the new peer in the topology of the underlying network which would make the exchange of information between the two quite inefficient and costly. The operation of the conventional tracker is illustrated in Fig. 3. To overcome the disadvantages of the above approach, we propose to design a tracking server that is aware of both, the content preferences of each peer and the relative distances between the peers in the underlying network topology, as illustrated in Fig. 4. The former information can be obtained from the social network data associated with a peer while the latter can be obtained from ISP portals, as considered, e.g., in the Provider Portal for P2P Applications (P4P) framework [22]. The tracking server will take advantage of this information to provide a more intelligent choice of prospective neighbors for an incoming peer. Specifically, we are interested in determining the peer neighborhood that will feature the highest likelihood of content discovery and the smallest network cost for the associated data transport. In the remainder of this section, we describe in detail the operation of the tracking server in achieving this goal. 2This is a group of IP networks run by one or more network operators with a single clearly defined routing policy.
Fig. 4. Proposed tracker provides a select subset of peers based on content preferences and node distances.
When a new node wants to join the overlay, it registers first with the tracking server by sending it its node ID (typically its IP address as provided by its ISP) and content preferences. Specifically, let the new node be denoted as and its content preference vector as , following the notation from Section III. The server, in turn, stores this information in its database of nodes comprising the overlay. It then searches for the most suitable neighbors for this node, as follows. Let the set of nodes already present in the overlay be denoted as . Then, for each node , the server correlates its preference vector with the one from the new node. In particular, the server computes the between the two using the following correlation coefficient expression: (8) where denotes the norm of a vector and the operator “ ” denotes the scalar, i.e., dot, product between two vectors, i.e., . In essence, the correlation coefficient describes the similarity between two content preference vectors large or small corresponding, respectively, to strong with similarity or dissimilarity in content selection between nodes and . as a suitable Finally, the server scores each node neighbor for peer using (9) where corresponds to the cost of transmitting data between nodes and in the underlying network topology, as introduced describes the emphasis in Section III, and the variable the server places on each of the two factors, content preference similarity and network cost, when computing the score . For the two factors are weighted equally, i.e., their contributions are given equal importance in regard to . In essence, with (9) the score is computed as a convex combination (in the and . logarithmic domain) of The server sorts in descending order the nodes in its database of overlay peers according to their scores. Then, it sends the IDs peers from the head of the sorted list to node as of the first
736
IEEE JOURNAL OF SELECTED TOPICS IN SIGNAL PROCESSING, VOL. 4, NO. 4, AUGUST 2010
On the other hand, for a conventional tracker the set of prospective neighbors will be selected at random, as explained earlier. Therefore, these nodes will exhibit random distances in the social graph relative to the new peer. Hence, the likelihood of discovering the desired content in this case can be written as (11) Fig. 5. New node connects to the system: Procedural description.
its prospective neighbors. Here, denotes the prospective size of a neighborhood for a node and it is a system parameter that is set ahead of time. The new node in turn contacts these peers, checking whether they have the content of interest. The node then establishes overlay connections with the peers that answer positively. An algorithmic description of the main operational steps of the proposed tracking server is provided in Fig. 5. In the following, we analyze the advantages of our approach relative to the conventional technique of selecting peer neighbors at random, as explained earlier. In particular, we study the improvements that the proposed tracker provides in terms of increased probability of discovering the content of interest and reduced network cost of receiving it from the selected neighbors. A. Increased Likelihood of Content Discovery In our analysis, we assume that the preferences of the peers are correlated as a function of their location in the social network graph. In particular, the preference vector of a node is the most correlated with those of its immediate/direct neighbors in the social graph. The content preference correlation then decays as the distance between two nodes in the graph increases in terms of intermediate neighbors. This assumption matches well with earlier findings on content correlation preferences among social network members reported in the context of MP3 audio file sharing systems [6] and Yahoo! Instant Messenger [10]. Following the above, we can model the probability that two nodes in the graph select the same content from as a monotonically decreasing function of the distance between the nodes , denote this in the graph. In particular, let , for probability in the case of nodes whose distance in the graph in , respectively. For interms of number of hops (edges) is stance, corresponds to the probability that a node discovers the content of interest at its direct neighbors in the social network graph. Then, it holds , where beyond a distance of hops in the graph the likelihood of choosing the same content settles at a small constant value . prospective neighbors The tracker needs to return a set of to a new node joining the overlay. Given its mode of operation, our tracker will select those peers in the overlay that are the most correlated with the new node in terms of content preference. Assuming there are enough social network contacts of the node already present in the overlay, the likelihood of discovering the content of interest among the nodes returned by the tracker can be expressed as (10)
where in this context denotes the diameter of the social network graph. That is represents the number of links between the farthest pairs of nodes in the graph. Finally, the increase in likelihood of content discovery as provided by the proposed tracker can be formulated as the ratio of and , i.e., (12)
Next, we quantify the speed at which each of the two approaches will detect the content of interest among the returned neighbors. In particular, we study the number of these neighbors that the new peer will need to contact on the average until it comes across a neighbor that has the desired content. In the as all case of the proposed tracker, this quantity is equal to the returned prospective neighbors will feature the highest content correlation with the peer, as explained earlier. On the other hand, for the conventional approach the prospective neighbors will feature various likelihoods of common content interest with the new peer, due to the fact that they are selected at random. Therefore, the average probability of content discovery among . Hence, the number of these neighbors them is that the new peer will need to contact, on the average, until the desired content is found, will be the reciprocal of this quantity. Using the two expressions, we can formulate the improvement in time to content detection that the proposed tracker provides as (13) Note that (13) also denotes how many more neighbors with peers will the new the desired content among the returned node detect by using the proposed tracker. Specifically, for every neighbor selected at random and having the content of interest of them in the the new node will encounter neighborhood returned by our tracker. This is important as it times the speed at which the new peer will can increase complete the download of the desired content from the nodes in the returned neighborhood. B. Reduced Network Cost The proposed peer selection mechanism sorts the nodes in the overlay based on their network cost, in addition to their content preference correlation, relative to the new node joining the overlay, as described in Section IV. Here, we quantify the savings in network transmission cost that the proposed tracker
CHAKARESKI AND FROSSARD: CONTEXT-ADAPTIVE INFORMATION FLOW ALLOCATION AND MEDIA DELIVERY
provides relative to the conventional approach of selecting peer neighbors at random. be the network cost associated with Let the network connection between peers and . We model the cost as being confined to the range described by minimum and maximum values, where the latter two depend on the actual network topologies employed for transmitting the data and the related costs that they incur to the ISPs operating them. In the case of random node selection the peers comprising the neighborhood returned by the tracker will feature network cost disand . On the other hand, tributed uniformly between the proposed tracker returns prospective neighbors sorted in ascending order in terms of their communication cost with the new peer. Therefore, the range of cost values that the new peer will encounter in the node neighborhood will be different in this case. In the remainder of this section, we provide a formal analysis of the statistics of network cost values characterizing a neighborhood provided by our tracker. denote the set of nodes in the overlay Let and let denote their respective network transmission cost values relative to the new peer. As explained is bounded, above, we assume that the cost distribution in and upper limits. We coni.e., it exhibits lower sider to represent a sample set of realizations of random variables independently and identically distributed . over the range described by the two bounds, i.e., Let the cumulative distribution function (cdf) of each of these . The proposed tracker sorts variables be denoted as in increasing order which corresponds to creating an order [23] of the original random statistics . The tracker then returns the first variables nodes from the head of the list as prospective neighbors to the new peer joining the overlay. ) order statistics The cdf of the th largest (for can be derived as
737
and is known as the beta function. Beis sometimes also cause of the latter normalizing factor, called the regularized incomplete beta function. In the case of being continuous with probability density we can derive the pdf of the th function (pdf) order statistics as
(16) Now, it is a reasonable assumption to model the original random , i.e., variables as being uniformly distributed in otherwise
(17)
as explained earlier. Furthermore, for ease of exposition and without loss of generality we will normalize this range to the will rep(0,1) interval in the following. In other words, resent the pdf of a uniform (0,1) random variable. It should be mentioned that in this case the random variables become beta variates [24], for , respectively. Then, using (16) we can derive the mean value of the network cost associated with each of the random variables comprising the neighborhood of nodes selected by the tracker as (18)
(19)
at least of the (14) where the last line in (14) follows since the term in the summand is the binomial probability that exactly of the are less than or equal to . Furthermore, using a relationship between binomial sums and the incomplete beta function (14) can be rewritten as
where in (19) we used the fact that . Furthermore, for clarity we replaced the symbol with in (18). Interestingly, the result in (19) implies that the order statistics divides the area under the function into segments, each with expected value of . Similarly, with some work we can derive the variances of using
(15) , for where in turn beta function [24] defined as
, denotes the incomplete (20) In Section VI-B, we will numerically evaluate the performance gains of the proposed tracker that we studied thus far.
738
IEEE JOURNAL OF SELECTED TOPICS IN SIGNAL PROCESSING, VOL. 4, NO. 4, AUGUST 2010
V. CONTEXT-AWARE PACKET SCHEDULING In the previous two sections, we studied the design of information flow allocation and network topology construction that take advantage of social network data in order to provide enhanced performance and services. Here, we provide a practical algorithm for scheduling the exchange of data packets between the members of the social network once they have expressed interest in a specific content. Therefore, the algorithm is complementary to the optimization techniques investigated thus far in the paper. In fact, the proposed context-aware packet scheduling can operate in concert with these techniques to provide optimized performance across multiple layers of the network hierarchy. We first go over some necessary notation. Let denote a node in the overlay network constructed from the social netdenote work members interested in a given content and let the set of its neighbors in the overlay topology. Furthermore, denote the set of data units from the media presentation let that are missing at node . The node is interested in requesting these data units from its neighbors such that it maximizes its own utility of them. In particular, a peer may experience different reconstruction qualities of the media presentation played at its end commensurate to the media packets received in response to different request schedules. Therefore, peer is interested in computing the optimal schedule for requesting data from neighbors that maximizes the reconstruction quality of its media presentation. we define to be the sensitivity of For each data unit the media presentation to not receiving data unit on time. This quantity can be computed as the overall increase in distortion affecting the media presentation by the absence of at decoding [25]. Furthermore, let and denote the size of data unit in bytes and its delivery deadline, respectively. The latter is the time by which data unit needs to be received in order to be usefully decoded. Finally, we define to be the current importance of data unit for the overall quality of the reconstructed presentation. We compute this quantity as (21) We explain each of the multiplicative factors in (21) in the following. The term represents the sensitivity of the media presentation per source byte of data unit . In other words, describes the distortion-rate trade-off for the media presentation associated with requesting data unit or not. We define the second term as the rarity factor for data unit in the neighborhood of peer . This quantity describes how infrequently this data unit is encountered among the peers in . Specifically, based on the number of replicas of data unit found in and the size of the neighborhood , the rarity factor returns a number that is inversely proportional to the ratio . When the frequency of coming across in increases, the rarity factor decreases and vice versa. The motivation behind using such a factor is to alleviate the dissemination of data units less frequently encountered among the nodes in the overlay.
Finally, the last multiplying factor in (21) accounts for the various delivery deadlines that different data units may have relative to the present time . In particular, the urgency factor provides a measure of relative urgency of data unit with respect to and among the data units in . As the deadline of a data unit approaches , its urgency factor increases. Conversely, for data units with delivery deadlines far into the future, this factor should exhibit respectively smaller values. The idea for employing an urgency factor when evaluating the present is to be able to give preferimportance of the data units in ence to data units that need to be received sooner by peer due to their more pressing delivery deadlines. Note that characterizing the media packets according to their present importance, as in (21), will allow us to maximize the utility of data exchange between the nodes in the social network interested in this specific content. In particular, a node equipped with our algorithm can thus request the data that maximizes the quality of the delivered content for the given bandwidth resources. At the same time, the node will be contributing toward the same goal at its peer neighbors. In the following, we describe the proposed light weight optimization algorithm for computing the request schedule for the missing data units at node . First, the current importance values for the data units in are computed using (21). These quantities are then sorted in denote the corresponding set of decreasing order. Let “sorted” data units. Next, starting from the first element of and moving toward its last one, we compute for each entry in the likelihood of receiving this data unit at before its delivery deadline. In particular, let be the data unit considered in the algorithm presently. Furthermore, denote the subset of neighbors of that have a let buffered copy of data unit available at present. Then, for every we compute the probability that data unit will node in response to a request sent arrive at peer no later than by to node at present, i.e., at time . In other words, this is the probability of experiencing a delay shorter than between the events of sending the request on the forward channel and receiving the data unit on the backward channel . In the terminology of computer networks this delay is called . Hence, we the round-trip time and we denote it here . The algorithm compute that exhibits selects to send a request for to the node . Otherwise, if the highest nonzero there is no such value,3 the data unit is not requested and the . Finally, once algorithm proceeds to the next element of goes through all data units in the “sorted” set, it sends the computed requests to the appropriate nodes in . The major computational steps of the algorithm are summarized in Fig. 6. It should be mentioned that basing the packet scheduling decisions on the probabilities of timely delivery allows for an implicit rate control between the nodes in the overlay. In particular, if a node experiences a backlog of data units requested previously but not received yet, the node will decline to request even further data at present. That is because the probabilities of on-time delivery for any additionally requested data units at 3That is the probability of receiving this data unit on time from any of the prospective senders is zero.
CHAKARESKI AND FROSSARD: CONTEXT-ADAPTIVE INFORMATION FLOW ALLOCATION AND MEDIA DELIVERY
739
Here, we model as a packet erasure channel with random transmission delays [26]. Specifically, packets carrying requested data units sent on this channel are either lost with a or otherwise they experience a random transprobability mission delay generated according to a certain probability . Then, can be written distribution as (22) In our case, we characterize the delay as exponentially distributed with a right shift of . This means that the delay comprises a constant component associated with and a random component exhibiting an exponential distribution with a pacan be written as rameter . Thus, otherwise.
Fig. 6. Computing the optimal policy for requesting data units from neighbors.
present will typically be very small or zero. In this way, each node will effectively control the amount of congestion that it effects in the network. Next, we describe the procedure for com. puting the probabilities A. Computing When computing the algorithm takes into account 1) the statistics of the communication channel from node to peer , 2) any previous (pending) requests to this sender for which peer has not received yet the corresponding data units,4 and 3) the transmission bandwidth of the channel . In particular, requesting a data unit comprises sending a small control packet to a designated neighbor. Moreover, the frequency of sending such packets is typically much smaller than the rate at which the corresponding data units are returned in response. That is because multiple data units can be requested with a single request packet. Hence, requesting data units typically consumes a very small fraction of the transmission bandwidth between two peers. Thus, it is reasonable to assume that the network effects in terms of delay and packet loss that requests exare quite marginal and perience on the forward channel can be ignored for practical purposes. This is the approach that in rewe follow here as we associate the overall delay ceiving a requested data unit to the characteristics of the backonly. ward channel we In order to be able to compute need a statistical characterization for the backward channel. 4This includes any data units in that are going to be requested in this round prior to from the same sender .
(23)
We attribute the existence of to the prospective backlog of previously requested data units from that has not been received yet by and in addition to the required amount of time to empty out data unit itself from the transmission buffer of node . Furthermore, we relate the random component of the delay to transient bandwidth variations of the network links comprising which in turn are caused by random occurthe channel rences of cross traffic on these links. The requesting peer estibased on gaps in sequence numbers of arriving data mates units from and similarly it estimates the parameter based on the jitter of the inter-arrival times of these data units. Finally, let denote the download rate from node that node experidenote the set of data units previences at present and let ously requested from that has not been received yet. Then, computes as (24) Once node
has values for , , and , it can compute using (22) and (23) as (25)
VI. PERFORMANCE EVALUATION Here, we evaluate the performance of the optimization techniques proposed in this paper. In some cases, we also study their efficiency relative to other conventional methods employed in practice today. We start by examining the performance of the algorithms for maximizing the information flow in a social network described in Section III. Then, in Section VI-B, we investigate the operation of the tracker-based system for selecting neighbors in P2P systems, as designed in Section IV. Finally, the performance of the context-aware technique from Section V for scheduling the packet transmissions among the members of a social network interested in sharing specific content is explored in Section VI-C. It should be mentioned that all our simulation
740
IEEE JOURNAL OF SELECTED TOPICS IN SIGNAL PROCESSING, VOL. 4, NO. 4, AUGUST 2010
experiments were carried out in an event-driven environment especially written in Matlab [27]. A. Network Flow Maximization For the purposes of our experiments, we synthesize social network data as follows. First, we create the topology of the social other graph by allowing each node to randomly connect to nodes-members of the social network. A node would not accept any more connections from its peers if the number of its connecnodes. The network cost of tions at present reaches sending data between two neighboring nodes in the social graph , where is chosen uniformly from an interval and are set respectively to one and four. In terms of network bandwidth characteristics, 25% of the nodes in the graph are characterized as Ethernet peers while the rest are declared as cable/DSL peers. Their corresponding uplink and downlink rates are selected in accord with the defining characteristics of these two classes of nodes. Finally, the content preference probat a node are generated abilities for the set of media assets in according to a suitably selected exponential distribution in order to mimic what is typically encountered in practice where some content exhibit much higher popularity than some other content. We would like to mention that we needed to synthesize our social network data as to the best of our knowledge such data is still not freely available for research purposes. Still, while generating the data we tried to follow as closely as possible what has been reported so far publicly about its defining characteristics encountered in practice. Therefore, we are confident that the optimization techniques presented in this paper and the related conclusions that we draw about their performance would still apply in the case of data obtained from actual online social networks. In the following, in addition to the centralized and distributed optimizations for network flow maximization from Section III we also study the performance of two other approaches. The first one ignores the content preferences exhibited by the social network members when maximizing the network information flow. In other words, this method considers that , i.e., all nodes exhibit the same equal preference across all content in . The second method, in addition to ignoring the content preferences of the nodes, also disregards the cost values associated with the network connections between the various nodes in the graph. In other words, in this case it . In practice, the latter two also holds that methods correspond to solving the maximization problem P1 from (1)–(3) under their specific additional conditions for the content preference and network cost parameters as described above. The performance of each of the four techniques studied here is then assessed by evaluating the objective function in (1) , as respectively using the optimal rate allocations computed by each technique. First, in Fig. 7 we examine the overall information flow-cost ratio that each of the flow allocation techniques achieves as a function of the size of the network. It can be seen that the proposed optimization method denoted henceforth Opt substantially outperforms the other two approaches denoted Opt (no SN) and Opt (no SN, no Netw. Cost), where no social network data (content preferences) and no social network data + no net-
Fig. 7. Objective function in (1) at optimal allocations of four algorithms. Influence of network size.
work cost information are considered, respectively. Specifically, by judiciously placing network resources on most popular content and least expensive links Opt is able to achieve a significant performance margin over both Opt (no SN) and Opt (no SN, no Netw. Cost). Furthermore, as expected an additional drop in information flow-cost is observed when in addition to content preferences we also disregard network cost information, as evident from the performances of Opt (no SN) and Opt (no SN, no Netw. Cost) in Fig. 7. We can also see from Fig. 7 that the information flow-cost ratio for all four techniques increases linearly as a function of . This is not surprising as the optimization described in (1)–(3) represents a linear function of the number of nodes in the network. Finally, the distributed optimization technique provides performance that closely matches that of its centralized counterpart, as seen from Fig. 7. This is quite encouraging as it could lead to actual deployments of the proposed optimization in practical systems. It should be mentioned that Opt and Opt, Distr exhibited very similar performances in all our experiments. Therefore, in the rest of the figures included in this section we will only show the performance of Opt. Next, in Fig. 8 we study the performance of the three techniques as a function of the number of media assets available in the social network. As expected, the performance of Opt is unaffected by the size of , as seen from Fig. 8. Specifically, no matter how many media assets are shared in the social network the optimization technique should always maximize to the same value the information flow in the network, as the sum of the content preferences will always be one. On the other hand, Opt (no SN) and Opt (no SN, no Netw. Cost) are sensitive to as increasing the number of assets could lead to an increased number of inefficient allocation decisions. This is evident from Fig. 8 where the performances of Opt (no SN) and Opt (no SN, no Netw. Cost) degrade as increasingly more media assets are shared across the social network. Finally, as in Fig. 7 there are relative performance differences between the three techniques which are due to the same reasons explained earlier. Finally, in Fig. 9 we investigate the influence of network cost on the operation of the optimization techniques. In particular,
CHAKARESKI AND FROSSARD: CONTEXT-ADAPTIVE INFORMATION FLOW ALLOCATION AND MEDIA DELIVERY
Fig. 8. Objective function in (1) at optimal allocations versus number of assets.
Fig. 10. Increase in likelihood of content discovery . borhood size
741
as a function of neigh-
network information is considered, when performance is evaluated in the context of (1). B. Peer Tracker Neighbor Selection
Fig. 9. Objective function in (1) at optimal allocations versus network cost range.
we measure the information flow-cost ratio for each of the techniques as we increase the value of while keeping fixed to one, as before. As anticipated, the performances of all three techniques degrade as the range of network cost values exhibited across the edges of the social graph increases. That is because now the nodes encounter increasingly higher transmission costs for sending their data as the upper bound on the range of cost values that the network links can exhibit increases. It should be pointed out that from the perspective of the optimization (1)–(3) considering network cost alone does not provide substantial advantages. This is evident from the relatively smaller performance difference between Opt (no SN) and Opt (no SN, no Netw. Cost) in Figs. 7–9. In particular, by disregarding social network information it may happen that some very popular assets are assigned very low rates and similarly some very unpopular ones are assigned very high data rates in the transport network. Therefore, the positive side of taking network cost into account is averaged out by the fact that no social
1) Increased Likelihood of Content Discovery: In the following, we evaluate numerically the performance improvements provided by the social-network-aware tracker, as described in (12) and (13) in Section IV-A. To this end, we model the content discovery probabilities across the social network graph as being exponentially correlated in the number of hops between , where detwo nodes in the graph, i.e., notes the shortest number of edges between a pair of vertices in the graph. for different values of and In Fig. 10, we examine as a function of the neighborhood size . First, it can be seen that the increased likelihood of content discovery as proincreases, which is vided by the proposed tracker decays as expected. In particular, as we query more and more nodes in the overlay the chance that we will encounter the content of interest increases by both methods, random node selection and the proposed tracker. Moreover, it can also be seen from Fig. 10 that reduces it becomes increasingly important to select peer as neighbors that exhibit similarity in terms of content preference increases. with the new node, i.e., the likelihood factor as a function of , i.e., of Similarly, in Fig. 11 we study how fast the similarity in content selection decays across hops in the graph. First, it can be seen that the increased likelihood of content discovery decreases as increases, which is expected. In particular, as the content of interest is more widely present in the social network then even random node selection would lead to its discovery provided a sufficient number of peers are examined to this end. Furthermore, as in Fig. 10 increasing certainly helps increasing further the likelithe probability hood of content discovery by random selection . Therefore, correthe improvement provided by the proposed tracker spondingly decreases, as evident from Fig. 11. Finally, in Fig. 12 we graph the improved speed in content as a function of . The graph exhibits a linear discovery
742
Fig. 11. Increase in likelihood of content discovery relation factor .
Fig. 12. Increase in speed of content discovery lation factor .
IEEE JOURNAL OF SELECTED TOPICS IN SIGNAL PROCESSING, VOL. 4, NO. 4, AUGUST 2010
as a function of cor-
as a function of corre-
relationship between the two quantities that is independent of , as expected from the expression for in (13). It can been that as the likelihood of discovering the content even at more distant nodes in the social graph increases so do the advantages of the proposed tracker in terms of how quickly the content of interest is detected decrease. Still, even at the social-network-aware tracker provides a substantial improvement over random node selection as it discovers the desired content more than seven times faster, as seen from Fig. 12. In other words, we observe more than a sevenfold increase in the number of peers from which the content of interest can be relative to the condownloaded in a neighborhood of size ventional approach of random selection. 2) Reduced Network Cost: Here, we quantify the savings in network cost provided by the proposed social-network aware tracker, as studied earlier in Section IV-B. In Fig. 13, we show values for some prospective neighbors the normalized from the head of the sorted list of peers as a function of the size of the overlay in number of nodes. Here, the normalizing factor
Fig. 13. Normalized mean value network size (#nodes).
for select neighbors as a function of
is in fact the mean of the uniform network cost distribution characterizing the peers returned by the conventional method (tracker). It can be seen that the proposed tracker provides neighbors featuring much smaller average network cost values relative to the conventional random node selection. Furdramatically degrades as the netthermore, the fraction work size increases, as seen from Fig. 13 where both axis are in logarithmic scale. It should be mentioned that the upper end of the -axis in Fig. 13 is where the sizes of overlay networks encountered in practice would typically lie. It should also be mentioned that the behavior observed in Fig. 13 is not surprising as the distribution of the order statisof network costs becomes heavily skewed tics towards zero even for small to medium network sizes, as illustrated in Fig. 14. For instance, we can see that increasing the network size for one decade on a logarithmic scale corresponds approximately to reducing the mean network cost value for the same factor, as evident from Fig. 14 when the pdf funcfor and are compared (for tions ). denote the average Finally, let network cost at which the new peer communicates data in the overlay, provided that the peer selected to connect to all nodes returned by the tracker. Note that this is a worst case scenario that is very unlikely to occur in practice for two reasons. First, the new peer will preferentially connect to the nodes higher up in the sorted list provided by the tracker. Moreover, even if the peer would connect to all nodes in the list, it would still differentially allocate transmission resources across them using the optimization procedures from Section III. In particular, nodes featuring lower network cost values, i.e., located closer toward the head of the list, would receive more transmission resources from the new peer relative to the neighbors located further down the list. Therefore, even in this latter case the average network cost that the peer will experience will be smaller than , i.e., it will represent a weighted sum of the individual networks costs , where higher weights will be placed on smaller indices. Still, we consider as defined above in order to compare the
CHAKARESKI AND FROSSARD: CONTEXT-ADAPTIVE INFORMATION FLOW ALLOCATION AND MEDIA DELIVERY
Fig. 14. Network cost distribution
as a function of network size.
worst case performance of the proposed tracker relative to the conventional approach. Note that for this latter approach the average network cost would be simply equal to as all prospective neighbors would feature the same mean cost. On the other hand, for the proposed tracker can be evaluated to using the expression for in (19). be for different neighborhood sizes In Fig. 15, we evaluate as a function of the network size . It can be see that similarly to what we observed in Fig. 13 the normalized average network cost exhibits small values that rapidly decrease even further as the number of nodes in the overlay increases. For inthe average network cost exstance, for network size perienced by the new peer when communicating to its neighbors is 150, 117, 95, and 80 times smaller in the case of the proposed tracker relative to the conventional approach of random node selection, for neighborhood sizes of 12, 16, 20, and 24 nodes, respectively. Moreover, these cost savings are computed based on a very unlikely scenario of operation involving the proposed tracker, as explained earlier. Therefore, in reality it is expected that the cost reduction gains experienced in systems employing our node selection mechanism would be even more significant. C. Adaptive Packet Scheduling As explained earlier, the nodes in the social network graph interested in a specific content organize themselves into an overlay network through which they exchange data packets comprising the content of interest. Therefore, here we evaluate the efficiency of the algorithm proposed in Section V for scheduling the transmission of the data packets among the nodes in the social graph comprising this overlay. Specifically, we explore the performance advantages of our context-aware scheduling, henceforth denoted Con-Aw, over two commonly employed techniques for requesting packets from peer neighbors. With EDF we denote the first of these techniques which prioritizes packets based on their delivery deadlines. In particular, earlier expiring packets are requested first, hence the name Earliest Deadline First (EDF). The second technique used for comparison simply requests packets from neighbors without taking into consideration any specific packet
Fig. 15. Normalized average network cost size .
743
as a function of network
information, hence the name Random. In our experiments, the overlay comprises 1000 nodes, out of which 30% are Ethernet peers, while the rest are cable/dsl peers. The upload bandwidth for Ethernet and cable/DSL peers is 1000 and 300 kbps, respectively, while the corresponding download bandwidth values for these two peer type categories are 1500 kbps and 750 kbps. In the simulations, we measure performance as the average Y-PSNR (dB) of the reconstructed video frames at each peer. The content is originally stored at a media server with an upload bandwidth of 6 Mbps. Initially each peer selects eight other peers as its neighbors. The size of a neighborhood for a peer can grow subsequently to contain up to 14 other peers. For the urgency and rarity factors, introduced in Section V, we employed the following functional forms and . As described in Section V, represents is the delivery deadline of data unit , is the current time, the size of a node’s neighborhood, and is the number of neighbors that have data unit . The specific forms for and selected here allow us to adequately differentiate data units based on spatio-temporal information. There are certainly other possible choices for these functions that one can design. The content employed in the experiments is the common test video sequence Foreman in CIF image size encoded at 30 fps using a codec based on the scalable extension (SVC) of the H.264 standard [28]. Foreman is encoded into four SNR-scalable layers, with data rates of 455, 640, 877, and 1212 kbps, respectively. The corresponding video quality of the layers is 36.5, 37.8, 39.1, and 40.5 dB, respectively, measured as the average luminance (Y) PSNR of the encoded video frames. The group of pictures (GOP) size of the compressed content is 30 frames, comprising the following frame type pattern IBBPBBP..., i.e., there are two B-frames between every two P frames or P and I frames. The 300 frames of the encoded sequence are concatenated multiple times in order to create a 900 second long video clip that is used afterwards in our simulations. In Fig. 16, we examine the cumulative distribution function (CDF) of average video quality for cable/dsl peers in the case of each of the three scheduling techniques. In particular, the
744
IEEE JOURNAL OF SELECTED TOPICS IN SIGNAL PROCESSING, VOL. 4, NO. 4, AUGUST 2010
network flow allocation, tracker-based peer selection, and data packet scheduling, and can be applied independently or in synergy across the various domains they address. Through our techniques we have been able to study the influence of relevant system parameters and the employed social information on the overall performance of the context-aware services that they enable. In our ongoing work, we are exploring personalized content adaptation and coding based on contextual information. Such mechanisms could further enhance the performance of the optimization techniques studied in this paper as they would provide yet another dimension of context-driven computing in the online media world of social networks. ACKNOWLEDGMENT
Fig. 16. CDF of average video quality (Y-PSNR) for different scheduling methods in the case of cable/DSL peers.
-axis records the fraction of peers from the overall population that experienced average video quality of the decoded content smaller than a specific value shown on the -axis. It can be seen from Fig. 16 that Con-Aw significantly outperforms the other two techniques. In particular, under the proposed context-aware scheduling the peer population exhibits a video quality distribution that is quite narrow in range and steep in slope relative to the corresponding distributions for EDF and Random. Therefore, the variations (variance) in video quality encountered across the nodes in the overlay is much smaller in the case of Con-Aw. Furthermore, context-aware scheduling also provides for much higher absolute video quality values as evident by the relative positions of the three CDF graphs in Fig. 16. For instance, the average video quality gain over EDF is around 4 dB, while the average gain over Random is even larger, i.e., around 8 dB, as denoted in Fig. 16. The performance improvements that Con-Aw enables are due to the fact that our technique takes into account the utility of each packet for the overall reconstruction quality of the content at any given time, while simultaneously it alleviates the dissemination of less frequently encountered data. These aspects are certainly overlooked in the design and operation of EDF and Random. Furthermore, it is expected that EDF outperforms Random, as seen from Fig. 16, since the former at least takes into account the timing information associated with the video packets when requesting them. Finally, it should be mentioned that analogous results were obtained for the case of Ethernet peers that are not included here due to space constraints. VII. CONCLUSION Perhaps the most important lesson of the present paper is that more efficient networking services can be provided through context-aware operation. By taking advantage of data on contacts and content preferences found in profiles of social network members we can enable network optimization strategies that substantially outperform their conventional counterparts that typically disregard such information. Our optimization techniques address different segments of online media delivery where exploiting social data can be advantageous. They target
The authors would like to thank the associate editor for his guidance in revising the paper and the anonymous reviewers for their invaluable comments. Through their support we have greatly improved the quality of the manuscript. REFERENCES [1] “Flickr: Share Your Photos, Watch the World.” [Online]. Available: http://www.flickr.com [2] “YouTube: Broadcast Yourself.” [Online]. Available: http://www. youtube.com [3] “Facebook: Connect and Share With the People in Your Life.” [Online]. Available: http://www.facebook.com [4] J. A. Pouwelse, P. Garbacki, J. Wang, A. Bakker, J. Yang, A. Iosup, D. H. J. Epema, M. Reinders, M. van Steen, and H. J. Sips, “Tribler: A social-based peer-to-peer system,” in Proc. 5th Int. Workshop Peer-toPeer Syst., Santa Barbara, CA, Feb. 2006. [5] J. Wan, L. Lu, X. Xu, and X. Ren, “A peer-to-peer assisting scheme for live streaming services,” in Advances in Grid and Pervasive Computing, ser. Lecture Notes in Computer Science. Berlin/Heidelberg, Germany: Springer-Verlag, 2008, vol. 5036, ch. 34, pp. 343–351. [6] A. Fast, D. Jensen, and B. N. Levine, “Creating social networks to improve peer-to-peer networking,” in Proc. 11th Int. Conf. Knowl. Discov. in Data Mining, Chicago, IL, Aug. 2005, pp. 568–573, ACM SIGKDD. [7] W. Wang, L. Zhao, and R. Yuan, “Improving cooperation in peer-topeer systems using social networks,” in Proc. 3rd Workshop Hot Topics in Peer-to-Peer Syst., Rhodes, Greece, Apr. 2006, pp. 50–57. [8] H. Zhao, W. Lin, and K. Liu, “Behavior modeling and forensics for multimedia social networks: A case study in multimedia fingerprinting,” IEEE Signal Process. Mag., vol. 26, no. 1, pp. 118–139, Jan. 2009. [9] W. Lin, H. Zhao, and K. Liu, “Incentive cooperation strategies for peer-to-peer live multimedia streaming social networks,” IEEE Trans. Multimedia, vol. 11, no. 3, pp. 396–412, Apr. 2009, special issue on Community and Media Computing. [10] A. Bagherjeiran and R. Parekh, “Combining behavioral and social network data for online advertising,” in Proc. Int. Conf. Data Mining Workshops, Washington, D.C., USA, Dec. 2008, pp. 837–846, IEEE. [11] P. Mitra and K. Baid, “Targeted advertising for online social networks,” in Proc. Int. Conf. Netw. Digital Technol., Ostrava, The Czech Republic, Jul. 2009, pp. 366–372. [12] G. Bigwood, D. Rehunathan, M. Bateman, T. Henderson, and S. Bhatti, “Exploiting self-reported social networks for routing in ubiquitous computing environments,” in Proc. Int. Conf. Wireless and Mobile Comput. Netw. Commun., Avignon, France, Oct. 2008, pp. 484–489. [13] S. Khan, Y. Peng, E. Steinbach, M. Sgroi, and W. Kellerer, “Application-driven cross layer optimization for video streaming over wireless networks,” IEEE Commun. Mag., vol. 44, no. 1, pp. 122–130, Jan. 2006. [14] J. Yuan, Z. Li, W. Yu, and B. Li, “A cross-layer optimization framework for multihop multicast in wireless mesh networks,” IEEE J. Sel. Areas Commun., vol. 24, no. 11, pp. 2092–2103, Nov. 2006. [15] J. She, X. Yu, P.-H. Ho, and E.-H. Yang, “A cross-layer design framework for robust iptv services over ieee 802.16 networks,” IEEE J. Sel. Areas Commun., vol. 27, no. 2, pp. 235–245, Feb. 2009. [16] S. Boyd and L. Vandenberghe, Convex Optimization. Cambridge, U.K.: Cambridge Univ. Press, 2004.
CHAKARESKI AND FROSSARD: CONTEXT-ADAPTIVE INFORMATION FLOW ALLOCATION AND MEDIA DELIVERY
[17] R. A. Tapia, Mathematical Optimization and Lagrange Multiplier Theory for Scientists and Engineers, ser. Course notes CAAM-460. Houston, TX: Rice Univ., 2000. [18] D. Bertsekas, Network Optimization: Continuous and Discrete Models. Nashua, NH: Athena Scientific, May 1998. [19] L. He and J. Walrand, “Pricing and revenue sharing strategies for Internet service providers,” in Proc. Conf. Comput. Commun. (INFOCOM), Miami, FL, Mar. 2005, vol. 1, pp. 205–217. [20] M. Hefeeda, A. Habib, and B. Bhargava, “Cost-profit analysis of a peer-to-peer media streaming architecture,” Purdue Univ., Tech. Rep. CERIAS 2002-37, Oct. 2002. [21] Pando Networks, Inc. [Online]. Available: http://www.pando.com [22] Enable ISP & P2P to Work Together. [Online]. Available: www.openp4p.net [23] H. A. David and H. N. Nagaraja, Order Statistics, 3rd ed. New York: Wiley-Interscience, Aug. 2003. [24] G. Casella and R. L. Berger, Statistical Inference, 2nd ed. North Scituate, MA: Duxbury Press, Jun. 2001. [25] J. Chakareski, J. Apostolopoulos, S. Wee, W.-T. Tan, and B. Girod, “Rate-distortion hint tracks for adaptive video streaming,” IEEE Trans. Circuits Syst. Video Technol., vol. 15, no. 10, pp. 1257–1269, Oct. 2005, special issue on Analysis and Understanding for Video Adaptation. [26] P. A. Chou and Z. Miao, “Rate-distortion optimized streaming of packetized media,” IEEE Trans. Multimedia, vol. 8, no. 2, pp. 390–404, Apr. 2006. [27] “Matlab (version 7.6),” The MathWorks, Inc. [Online]. Available: http://www.mathworks.com [28] Advanced Video Coding for Generic Audiovisual Services, Amendment 3: Scalable Video Coding, ITU-T and ISO/IEC JTC 1, Draft ITU-T Rec. H.264-ISO/IEC 14496-10(AVC), Apr. 2005. Jacob Chakareski received the M.S. degree in electrical and computer engineering from the Worcester Polytechnic Institute, Worcester, MA, and the Ph.D. degree in electrical and computer engineering from Rice University, Houston, TX, in 2006 for his doctoral thesis done at Stanford University, Palo Alto, CA. From 2006 to 2007, he was a Senior Research Engineer with Vidyo, Inc., Hackensack, NJ, where he worked on advanced methods for real-time video communication. Currently, he is an Associate Scientist at Signal Processing Laboratory (LTS4), Ecole Polytechnique Fédérale de Lausanne (EPFL), Lausanne, Switzerland, where he conducts research, lectures, and supervises students. He has broad research interests spanning multimedia systems, computer networks, optimization and control, and wireless communications. He has held research positions with Microsoft
745
and Hewlett-Packard. He has authored one monograph, three book chapters, and over 80 international publications, and has nine pending or approved patent applications. Dr. Chakareski is a member of Tau Beta Pi and Eta Kapa Nu. He is a recipient of fellowships from the Soros Foundation and from the Macedonian Ministry of Science. At Rice University, he was awarded the Texas Instruments Graduate Research Fellowship. Most recently, he was granted the Ambizione fellowship for 2009–2012 from the Swiss NSF that recognizes research excellence among foreign nationals working at Swiss universities. He actively participates in technical and organizing committees of several IEEE conferences and symposia on a yearly basis. He was a publicity chair for the Packet Video Workshop in 2007 and 2009 and for the Workshop on Emerging Technologies in Multimedia Communications and Networking at ICME 2009. He organized and chaired a special session on telemedicine at MMSP 2009. He won the best student paper award at the IS&T/SPIE VCIP 2004 conference.
Pascal Frossard (S’96–M’01–SM’04) received the M.S. and Ph.D. degrees, both in electrical engineering, from the Swiss Federal Institute of Technology (EPFL), Lausanne, Switzerland, in 1997 and 2000, respectively. From 2001 to 2003, he was a member of the research staff at the IBM T. J. Watson Research Center, Yorktown Heights, NY, where he worked on media coding and streaming technologies. Since 2003, he has been a Professor at EPFL, where he heads the Signal Processing Laboratory (LTS4). His research interests include image representation and coding, visual information analysis, distributed image processing and communications, and media streaming systems. Dr. Frossard was the General Chair of IEEE ICME 2002 and Packet Video 2007. He was the Technical Program Chair of EUSIPCO 2008 and a member of the organizing or technical program committees of numerous conferences. He has been an Associate Editor of the IEEE TRANSACTIONS ON MULTIMEDIA (2004–2010), the IEEE TRANSACTIONS ON IMAGE PROCESSING (2010-) and the IEEE TRANSACTIONS ON CIRCUITS AND SYSTEMS FOR VIDEO TECHNOLOGY (2006-). He is an elected member of the IEEE Image and Multidimensional Signal Processing Technical Committee (2007-), the IEEE Visual Signal Processing and Communications Technical Committee (2006-), and the IEEE Multimedia Systems and Applications Technical Committee (2005-). He served as Vice-Chair of the IEEE Multimedia Communications Technical Committee (2004–2006) and as a member of the IEEE Multimedia Signal Processing Technical Committee (2004–2007). He received the Swiss NSF Professorship Award in 2003, the IBM Faculty Award in 2005, and the IBM Exploratory Stream Analytics Innovation Award in 2008.