refers to the ”required pause”. Speech synthesized as per the tags for sentences 1 and 3 will be perceptually natural, whereas for the sentences 2 and 4, a wrong pause will make the speech sound unnatural. Hence POS information and pause are important in the context of TTS. In this section, we focus on the pause insertion between successive words by predicting pause from the estimated POS tags. A. Parts-of-Speech Fig. 1.
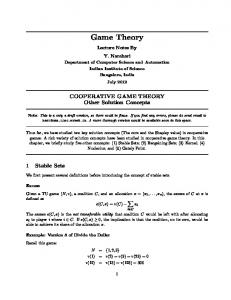
Block diagram of MILE TTS
current version of MILE-TTS. The missing polyphone can be generated by a simple concatenation of the constituent phones. Speech synthesis is carried out on a word by word basis for the input text. From the candidate units chosen by NLP module, the optimal units are selected by Viterbi search considering the lowest total join cost for a word. Selected units may be concatenated by spectral smoothing algorithm such as LSF interpolation for further enhancement of the output speech quality. A detailed block diagram of MILE-TTS is shown in Fig.1. In the proposed method, emphasis is laid on selecting a best unit for concatenation based on prosody match. Prosody is an important aspect of speech, which includes rhythm, stress, and intonation. In quantifiable terms, prosody is defined as the collection of the features of speech such as pitch, intonation, timbre, duration and pause. Prosody information is crucial to a natural sounding TTS [7], and it is also a challenge to incorporate prosody into TTS without compromising on the output speech quality. MILE-TTS incorporates an online parts-of-speech (POS) tagging module shown in Fig.1. From the sequence of POS output, pause between the words is decided. This work is carried out for Tamil and may be extended to all Dravidian languages taking into account the nuances of the language structure. The complete description of pause modeling and POS tagging is explained for Tamil language in the next section. III. PAUSE MODELING WITH POS
INFORMATION
One of the important characteristic of a natural sounding synthesized speech is the right amount of pauses at appropriate places in a sentence. The stress and pause can be modeled using the POS and other syntactic information. A wrong pause inserted between two words may make the synthesized speech unnatural. This is illustrated in Fig. 2 with an example each from English and Tamil. Here, the notation denotes
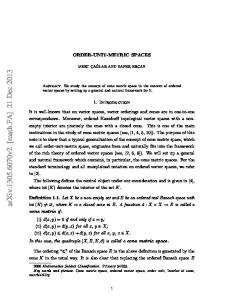
POS indicates the classification of words into different classes such as noun and verb, which decide the prosody of a sentence. An automated POS tagger is developed for this purpose, which uses lexical and context sensitive rules [8] for finding the POS of each word in a sentence. POS tagging is language specific and a recent system reported to be the comprehensive by the authors provides low accuracy while being computationally intensive [6]. Nevertheless even an approximate POS tagger helps to improve the naturalness of TTS synthesis. Hence an approximate, computationally efficient POS tagger is implemented for Tamil in MILE-TTS. Twelve main-tags and 27 sub-tags have been defined for Tamil, some of which are given below: Main tags: NN-noun, VB-verb, ADJ-adjective, AJP–adjectival participle, Q–quantifier, PP–post position Sub-tags: prs-present tense, pst–past tense, fut–future tense, 1,2,3–first, second, and third person respectively, s–singular pl–plural, neg–negative, acc–accusative case, dat–dative case –specifies the default pause between any two words. B. Pause Estimation using POS Basic syntactic information of POS of words in a sentence is considered for forming rules for pause insertion. The prosodic structure of a sentence can be represented by different levels of break markers in the model [7]. For natural pause between words in a sentence, nine different levels of pause are considered as shown in Table I. Pause duration is highest at the sentence end. Fig.3 shows a sample Tamil sentence in the first line, the corresponding meaning of the respective words in English in the second line and predicted POS information in the third line. Pause level estimation between the words is indicated within < > in the fourth line. Some of the pause estimation rules employed for the above sentence are explained below. 1) Rule1: Considerable pause duration is needed after semicolon, , colon or a comma . As per
TABLE I D IFFERENT L EVELS OF PAUSE B ETWEEN W ORDS Pause Label P0 P1 P2 P3 P4 P5 P6 P7 PW
of sub-costs [2]:
Pause duration No Pause 10 to 15 ms 100 to 150 ms 200 to 250 ms 400 ms 400 to 500 ms 600 to 700 ms 1000 ms 15 to 25 ms
Csel =
N ∑
n wsel Csel (n)
(2)
n=1
Cjoin =
Q ∑
n wjoin Cjoin (n)
(3)
n=1
Fig. 3. Estimated POS tags and pause levels for a sample Tamil sentence. The pause level indicated below any word corresponds to the pause duration between the current and the following words.
where N and Q are the number of sub-costs for selection and concatenation costs respectively. In order to minimize the total cost, the individual costs Csel and Cjoin need to be minimized. Some of the recent methods have focussed on minimizing the target and join costs separately. In [12], statistical prosody models are used in unit selection to minimize target and join cost. This work employs separate probabilistic models for pitch, duration and energy. In [13], signal dependent transformations are used to obtain the discontinuity metric for each candidate unit instead of considering features such as pitch and spectrum separately to compute the total cost. Lambert [14] talks about unit selection employing the Mel frequency cepstral coefficients (MFCC) as features at the concatenation boundaries with phonetic context. Another method of unit selection is to choose complete words or sentences from the database [4]. V. U NIT C ONTINUITY M ETRIC
this rule, is inserted wherever a comma occurs in the sentence. 2) Rule2: There should be a pause level before any quantifier. 3) Rule3: Combine the words with POS tag AJP and NN (any noun) occurring together, with a pause duration between them There are 15 such rules which identify the pause level according to the word and its parts-of-speech. The pause model has been incorporated into MILE-TTS. The performance is evaluated by group of natives for naturalness of the output speech on sentences synthesized with and without pause rules.
We propose a new algorithm to minimize the total cost Ctotal by employing unit-continuity-metric (UCM) to minimize Csel in (1). The sub-costs of Csel can be broadly grouped under spectral and pitch based features. It must be noted that the sub-costs of Csel in (1) are considered only at the concatenation boundary. However the proposed continuity metric looks for continuity of features up-to several frames on both sides of the concatenation boundary. In the present work, two continuity metrics are proposed namely, the pitch continuity metric (PCM), and the spectral continuity metric (SCM). PCM employs pitch track and SCM employs the sequence of spectral centroids of the signal about the concatenation boundary as features. Hence Csel in (1) can be written as,
IV. U NIT S ELECTION -R EVIEW
p s Csel = wp Csel + ws Csel
This section describes the traditional techniques [9] employed for unit selection. The selection of possible candidate units for matching the specifications of target unit. The cost incurred in selecting the candidate units is called target cost and the cost of concatenating any pair of units is known as join cost. Total cost incurred is the sum of target and join costs [2].
p s where, Csel and Csel are the costs incurred for pitch based features and the spectral features respectively. Optimal values for the weights ws and wp can be obtained by training on a reference database as suggested in [2] with the condition ws + wp = 1. Obtaining optimal values for wp and ws will be involved as it requires a reference database and objective evaluation of all the output sentences with different values for each variable. Let us consider the boundary of concatenation between the units i and i + 1 in a word as shown in Fig. 4. The individual unit-continuity-metrics at the ith concatenation boundary in a ¯ (i) consisting of PCM and SCM word can be defined as Csel
Ctotal = Csel + Cjoin
(1)
where, Ctotal is the total cost, Csel is target cost or selection cost and Cjoin is the join cost between the two consecutive units. Target and join costs, in turn are a weighted combination
(4)
pˆ s ˆ (i) respectively. The above contributions, Csel (i) and Csel discussion can be symbolically stated as,
¯ (i) = wp C p¯ (i) + ws C s ¯ (i) Csel sel sel Each of these sub-costs are computed as, v u K u ∑ p¯ Csel (i) = t |pi (k) − pi+1 (k)|2
(5)
(6)
k=−K
and,
v u K u ∑ s ¯ (i) = t |si (k) − si+1 (k)|2 Csel
(7)
k=−K
where, pi (k) is the average pitch value and si (k) is the spectral centroid of the k th frame from the ith unit concatenation boundary shown in Fig.4 and K is the number of frames employed on either side of the concatenation boundary. The value K = 0 represents the matching based only on the frames at the concatenation boundary. From (6) and (7), we may observe that larger value of K would lead to better unit selection. However value of K is limited by the duration of the polyphonic unit and it is experimentally found that K = 4 is sufficient for the application. A. Algorithm In Fig. 4, the unfilled boxes indicate the units to be concatenated and the continuity metric features are extracted from either side of the concatenation boundary. In this paper, SCM and PCM are considered separately for evaluation. SCM features are obtained by low pass filtering the signal at 2000 Hz and calculating the spectral centroid by zero crossing rate. 1) Given a word input for TTS, the candidate units for concatenation are obtained from NLP module. 2) PCM features across the concatenation boundary are computed. PCM features are the pitch values pi (k) in (6). Typically 4 frames on either side of the boundary with 20 msec frame size without overlap is considered in experiments. 3) Pitch tracks of the consecutive units for a word are compared by Euclidian or absolute distance measure. This new distance measure is termed as pitch continuity measure (6). 4) Viterbi algorithm is employed to find the best path to minimize the continuity metric accumulated over the word. 5) Similarly SCM features are also employed to synthesize speech. Perceptual experiments have shown that pitch continuity is more relevant in selecting units rather than units which are spectrally similar and the argument is supported in [5]. If the pitch continuity is ignored across the concatenation boundary, the output speech sounds unnatural. The spectral continuity is also an important factor in prosody, and it is
Fig. 4.
Proposed unit selection method using PCM features.
TABLE II R ATING G UIDELINES F OR S UBJECTIVE E VALUATION O UTPUT S PEECH Score 1 2 3 4 5
Subjective Perception Poor speech, with discontinuities and very low comprehension Poor speech with discontinuities, but comprehendible Good speech quality with less discontinuity, and comprehendible Very good speech quality, with less naturalness As good as natural speech
shown through perceptual experiments that spectral continuity is not so important as the pitch continuity. B. Test Setup To validate the proposed method, sentences corresponding to the synthesis database are given as input to the MILE-TTS. Also, speech is synthesized for input sentences from outside the database for subjective evaluation by MOS. Table II shows the basis for evaluation of synthesized sentences. Subjects are requested to rate the output speech on a scale of 1 to 5, based on intelligibility, speech continuity and naturalness. Three methods are compared for evaluation, (i) MFCC based unit selection, which considers single frames at the boundary (ii) SCM and (iii) PCM based unit selection. MOS score is given by 10 native people on a set of eight paragraphs each for Tamil and Kannada. VI. E VALUATION For the validation of our claim for better unit selection using the proposed method, PCM and SCM features are tested independently on 10 test sentences from the database as input for synthesis. PCM and SCM features for unitselection returned an accuracy of 100%, which means all the polyphonic units are selected from the corresponding polyphones in synthesis database. The same set of 10 test sentences are employed to synthesize speech by non-continuity metric for unit-selection. For such a case MFCC feature is employed, and the method returned an average self-selection of 83% for the same database sentences in Kannada and Tamil. To compare the performance of different features for unitselection, test input that is not present in the synthesis corpus
TABLE III P ERFORMANCE COMPARISON OF UCM AND NON -UCM BASED UNIT SELECTION . MOS SHOWN ARE MEANS OVER 8 PARAGRAPHS OF K ANNADA AND TAMIL EVALUATED BY 10 PEOPLE EACH Language Kannada Tamil
MFCC 2.5 3.0
PCM 3.1 3.6
SCM 2.7 2.8
TABLE IV MOS
EVALUATION OF A PARAGRAPH SYNTHESIZED WITH AND WITHOUT PAUSE MODEL
MOS
Pause Model 3.2
No pause Model 2.6
is used. A set of eight input paragraphs are synthesized using PCM, SCM and MFCC features for Kannada and Tamil. The MOS score is evaluated for synthesized speech by a group of ten people native to each language. The MOS score for the proposed PCM method is 3.1 on a scale of 1 to 5 for Kannada and 3.6 for Tamil and the MOS scores for the other features are shown in Table III. To test the effectiveness of pause prediction, ten Tamil sentences were synthesized using MILE-TTS and MOS scores are evaluated for naturalness as compared to the fixed pause insertion. Table IV shows that by employing pause prediction model in TTS the output sounds natural. VII. C ONCLUSION A ND D ISCUSSION In this paper, we have proposed a new approach to evaluate and minimize the join cost of speech units. We have found from experiments that the pitch continuity measure is key to achieve better naturalness of output speech when compared to spectral continuity. With the new pause estimation module, the naturalness of TTS output is improved. The Kannada and Tamil TTS with PCM features for unit-selection can be tested at http://mile.ee.iisc.ernet.in/tts. In the future work, we propose to consider the combination of the spectral and pitch continuity metrics for a unified unit selection. ACKNOWLEDGEMENT The authors would like to thank Ministry of Social Justice and Empowerment, Government of India for funding the TTS project, Sri.K. Suchendra Prasad and Sri. Jayam Kondan for the Kannada and Tamil TTS voices, respectively, Dr G Sita for giving valuable suggestions and feedback, and K. Parthasarathy, Shiva Kumar HR, Arun Sriraman and Abhinava Shivakumar for the TTS code and creating the web demo, and Shanthi Devaraja and Sri Lakshmi for segmenting and annotating the synthesis databases. R EFERENCES [1] Samuel Thomas, M. Nageshwara Rao, Hema A. Murthy, C.S. Ramalingam, “Natural sounding TTS based on syllable -like units”, EUSIPCO, 2006. [2] Hunt, A.J. and Black, A.W., “Unit selection in a concatenative speech synthesis system using a large speech database”, Proc. ICASSP, vol. 1, pp. 373–376, 1996.
[3] M. Beumagel, A. Conkie, A. Syrdal, “Diphone synthesis using unit selection”, Proceedings. third ESCHCOCOSDA Workshop Speech Synthesis, pp. 185–190, 1998. [4] Esther Klabbers, Jan P. H. van Santen and Alexander Kain, “The Contribution of various sources of spectral mismatch to audible discontinuities in a diphone database”, IEEE Transactions on Audio, Speech, and Language Processing, Vol. 15, No. 3,pp. 949–956, 2007. [5] Kun Liu, Zhiwei Shuang, Yong Qin, Jianping Zhang, Yonghong Yan, “Mandarin accent analysis based on formant frequencies”, ICASSP, Vol. 4, pp. 637–640, 2007. [6] Dhanalakshmi V, Anand Kumar, Shivapratap G, Soman KP and Rajendran S, “Tamil POS tagging using linear programming”, International Journal of Recent Trends in Engineering, Vol. 1, No. 2, pp. 166–169, 2009. [7] Fu-chiang Chou, Chiu-yu Tseng, Keh-jiann Chen and Lin-shan Lee, “A Chinese Text-To-Speech System based on Part-of-Speech analysis, prosodic modeling and non-uniform units”, IEEE International Conf on Acoustics, Speech, and Signal Processing, Vol 2, pp. 923–926, 1997. [8] Arulmozhi. P, Sobha. L, Kumara Shanmugam. B. “Parts of speech tagger for Tamil”, Proc. Symposium on Indian Morphology, Phonology & Language Engineering, pp. 55-57, 2004. [9] Paul Taylor, “Text to speech synthesis”, Cambridge Press, First edn, 2009. [10] G L Jayavardhana Rama, A G Ramakrishnan, R Muralishankar and P Prathibha, “A complete text-to-speech synthesis system in Tamil”, Proc. IEEE 2002 Workshop Speech Synthesis, pp. 191–194, 2002. [11] K Parthasarathy, AG Ramakrishnan, “A research bed for unit selection based text to speech synthesis”, Proc. II IEEE Spoken Language Technology (SLT) workshop, pp. 229–232, 2008. [12] Wei Zhang, Liang Gu, Yuqing Gao, “Recent improvements of probability based prosody models for unit selection in concatenative text-speech”, IEEE Intl. Conf. on Acoustics, Speech, and Signal Processing, pp. 3777– 3780, 2009. [13] Jerome R. Bellegarda, “A Global Boundary-Centric Framework for Unit Selection Text-to-Speech Synthesis”, IEEE Trans. on Audio Speech and Language Processing, Vol. 14, pp. 990–997, 2009. [14] T. Lambert, Andrew P. Breen, Barry Eggleton, Stephen J. Cox, Ben P. Milner, “Unit selection in concatenative TTS synthesis systems based on mel filter bank amplitudes and phonetic context”, Proc. 8th European Conf. on Speech Commn. and Tech, EUROSPEECH, pp. 273–276, 2003.