Electronic Supplementary Material (ESI) for Lab on a Chip. This journal is © The Royal Society of Chemistry 2015
Supplemental Information
Continuous aerosol size separator using inertial microfluidics and its application to airborne bacteria and viruses Seung Chan Hong1†, Joon Sang Kang2†, Jung Eun Lee3, Sang Soo Kim1* and Jae Hee Jung2*
1Department
of Mechanical Engineering, Korea Advanced Institute of Science and
Technology, Daehak-ro 291, Yuseong-gu, Daejeon 305-701, Republic of Korea 2Center
for Environment, Health and Welfare Research, Department of Energy and
Environmental Engineering, Korea University of Science and Technology (UST), Korea Institute of Science and Technology (KIST), Hwarang-ro 14-gil 5 Seongbuk-gu, Seoul 136791, Republic of Korea 3Han-River
Environment Research Center, National Institute of Environmental Research
(NIER), Yangseo-myeon, Yangpyeong-gun, Gyeonggi-do 476-823, Republic of Korea ___________________________________________________________________________
†Authors * Authors
equally contributed to this work.
to whom correspondence should be addressed. e-mail)
[email protected] e-mail)
[email protected]
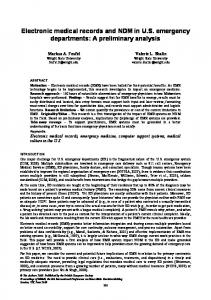
Figure S-1. The separator was fabricated using a conventional soft lithography process.1 (a) A 100-μm layer of SU-8 negative photoresist was spin-coated onto a Si wafer substrate. (b) The wafer was then patterned via UV exposure. (c) The patterned wafer was developed using SU-8 developer then washed with IPA and SDW. (d) PDMS was poured over the developed wafer. (e) The patterned PDMS was then removed from the wafer and bonded to a slide glass using an O2 plasma to seal the microchannel.
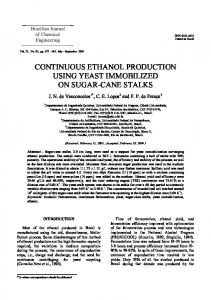
Figure S-2. (a), (b) and (c) show fluorescence micrographs of S. epidermidis sampled at each of the separator’s outlet. S. epidermidis was sampled using polytetrafluoroethylene (PTFE) filters (SKC Inc., Covington, GA), 2 that were placed in a button aerosol sampler (SKC Inc.) with a sampling time of 5 min. The collected bacteria were dissolved in 1 mL of SDW and sonicated in a sonication bath for 10 min to ensure their removal from the filters. The collected bacterial suspensions were dyed with SYBR green I (Life Technologies, USA) to distinguish biological and non-biological particles.3,4 The micrographs show higher fluorescence intensity at the second outlet, indicating that most of the bacteria were ejected from the second outlet (red and blue pixels are defective).
a) S. epidermidis ( 1st Outlet )
200 μm
b) S. epidermidis ( 2nd Outlet )
200 μm c) S. epidermidis ( 3rd Outlet )
200 μm
Figure S-3. (a), (b) and (c) show fluorescence micrographs of Adenovirus sampled at each of the separator’s outlet. Adenovirus was sampled using polytetrafluoroethylene (PTFE) filters (SKC Inc., Covington, GA), 2 that were placed in a button aerosol sampler (SKC Inc.) with a sampling time of 10 min. The collected viruses were dissolved in 1 mL of SDW and sonicated in a sonication bath for 10 min to ensure their removal from the filters. The collected viral suspensions were dyed with SYBR green I (Life Technologies, USA) to distinguish biological and non-biological particles.3,4 The micrographs show higher fluorescence intensity at the third outlet, indicating that most of the viruses were ejected from the third outlet (red and blue pixels are defective).
a) Adenovirus ( 1st Outlet )
200 μm
b) Adenovirus ( 2nd Outlet )
200 μm c) Adenovirus ( 3rd Outlet )
200 μm
References 1
D.Qin, Y. Xia and G. M. Whitesides, Nat. Protocs., 2010, 5, 491–502.
2
N. C. Burton, S. A. Grinshpun and T. Reponen, Ann. Occup. Hyg., 2007. 51. 143–151.
3
D. Lee, S. H. Park, H. Yang, K. Chung, T. H. Yoon, S. Kim, K. Kim, and Y. T. Kim, Lab Chip, 2004, 4, 401–407.
4
R. T. Noble and J. A. Fuhrman, Aquat. Microb. Ecol., 1998, 14, 113–118.