Original Research published: 15 March 2017 doi: 10.3389/fneur.2017.00096
C
Xiaochen Zheng1, Alba Vieira Campos2, Joaquín Ordieres-Meré1, Jose Balseiro2, Sergio Labrador Marcos2 and Yolanda Aladro2* 1 Department of Industrial Engineering, Technical University of Madrid, Madrid, Spain, 2 University Hospital of Getafe, Getafe, Madrid, Spain
I
Edited by: Pille Taba, University of Tartu, Estonia Reviewed by: Aasef G. Shaikh, Case Western Reserve University, USA Andreas Sprenger, University Luebeck, Germany *Correspondence: Yolanda Aladro
[email protected] Specialty section: This article was submitted to Movement Disorders, a section of the journal Frontiers in Neurology Received: 18 October 2016 Accepted: 27 February 2017 Published: 15 March 2017 Citation: Zheng X, Vieira Campos A, Ordieres-Meré J, Balseiro J, Labrador Marcos S and Aladro Y (2017) Continuous Monitoring of Essential Tremor Using a Portable System Based on Smartwatch. Front. Neurol. 8:96. doi: 10.3389/fneur.2017.00096
Frontiers in Neurology | www.frontiersin.org
Keywords: essential tremor, smartwatch, accelerometer, continuous monitoring, remote diagnosis
INTRODUCTION Essential tremor (ET), the most prevalent tremor disorder, is a postural and kinetic tremor affecting 4.6–6.3% of adults above the age of 60–65 (1). It represents a family of diseases rather than a single one, which could be associated with gait disorders and cognitive impairments (2). Although ET is not a life-threatening disease, it has an important negative impact on all
1
March 2017 | Volume 8 | Article 96
Zheng et al.
Continuous Monitoring of Essential Tremor
aspects of life quality, including social and psychological, due to their exacerbation in public (3). It mainly affects the upper limbs with the consequent interference in basic activities of daily living, such as handwriting, dressing, eating, and self-care (4). Progress in the treatment of ET is limited because of the poor understanding of many of the underlying conditions (5). Tremor analysis during daily living is crucial to better understand the patient status and to evaluate treatment effects (6). In clinical practice, it is usually assessed by several tremor validated rating scales (7–12). Although these have demonstrated clinical utility, they require the presence of a clinician for scoring. Their results are subject to clinical judgment and show significant intra- and inter-explorer variabilities. The main limitation is that they only provide an instantaneous, subjective, and qualitative assessment of tremor intensity during a clinical visit and do not allow extended continuous monitoring of tremor fluctuation patterns throughout the day or in home environments (6, 13). Essential tremor shows a frequency between 4 and 12 Hz and variable amplitude, depending on stress level, position, voluntary movements, and disease evolution (14–17). It is higher than the frequency of normal voluntary human movements. Therefore, it is possible to detect tremor on the basis of the frequency difference (3, 13). The feasibility of classifying tremor according to the acceleration data collected from patient’s wrist has also been reported (18). A variety of tremor data collecting systems based on acceleration sensors have been developed and applied in many studies (6, 19–27). However, most of these systems are designed in the laboratory environment and will cause inconvenience to the patient in case of long-term application. For example, the Kinesia™ (CleveMed) system has shown a good correlation with scale tremor scores, for all, rest, positional, and kinetic tremor (6, 28). Although this system is portable, it still limits the movement of the limb and it is hard to monitor the patient remotely due to the distance limitation. The development of wearable technology, such as smartwatch, smart band, and smart glasses, provides a new method to collect motion data more conveniently. The study presented in Ref. (29) has verified the practicability of using a smartwatch to analyze and diagnose tremor. This research testifies to the feasibility and potential clinical utility of a new highly portable system capable of continuously recording arm motion data and sending them to a remote server through a mobile terminal in real time. The aim is to quantify the amplitude and frequency of the tremor and establish greater traceability with daily activities. The main device of the system is an Android smartphone and a smartwatch that contains a triaxial accelerometer. There is a database on a remote server, managing all the data collected from the patient without distance limitation. This system is able to monitor the patient’s movement continuously without introducing much inconvenience. Accordingly, a quantitative overall situation of the patient in a long-range scenario is accessible.
accordance with the Declaration of Helsinki of the World Medical Association. All participant patients have signed an informed consent. The data collecting system only collects anonymous data from the smartwatch and the smartphone. Deidentified data were used, so that only the local investigator was aware of the source of the data and could associate them to a specific patient. Collected technical data are stored in a local server within the network of Technical University of Madrid protected by several firewalls. In addition, only authorized researchers of the team can access them. Therefore, patient privacy has been well protected throughout the study.
Subjects
Nine ET subjects, aged 60–77 years (mean 69.0 ± 6.6 SD, six males and three females), with different levels of ET are included, all of them over the moderate level on Fahn–Tolosa–Marin Tremor Rating Scale (FTMTRS). The data of one patient are destroyed due to hardware problem (Android phone battery) and the data of the remaining eight patients are successfully collected, aged 60–77 years (mean 68.0 ± 6.3 SD, six males and two females). All patients selected showed both, postural and intentional tremor, although the tremor levels are different between patients and in each patient. Five patients were under tremor therapy, two were taking propranolol, another couple of them were on treatment with primidone, and the other one was taking clonazepam. The medication was maintained throughout the study. The data of a healthy male, aged 54 years are also recorded to compare with the data of the patients.
Monitoring System
A portable human movement monitoring system has been previously developed (30). This three-layer system is composed of a Pebble smartwatch,1 which contains a triaxis accelerometer and Bluetooth 4.0, for recording the user’s arm movement data; an Android smartphone for receiving data from Pebble and uploading them to a remote server; and a cross-platform documentoriented NoSQL MongoDB database2 on remote server for data storage and analysis. The information collected using this system includes three-axis arm movement acceleration values. The feasibility of analyzing tremor using the data collected from a smartwatch has been validated in our previous work (31).
Procedures of Data Collection
At the first visit, each patient receives an initial training session to learn how to use the system (smartwatch and Android phone). Then, wearing firmly the watch on his/her wrist more severely affected (on the dominant hand if both are equally affected), the patient realizes the standardized tasks at hospital under the supervision of a neurologist from the research team. The tasks of FTMTRS (12) included are the following: (1) keeping hands relaxed on the lap for evaluating rest tremor, (2) holding their arms extended horizontally for studying postural tremor, and (3) repeating finger–nose test
MATERIALS AND METHODS This study is approved by the ethics committee of the Getafe University Hospital (Madrid, Spain) and is conducted in
Frontiers in Neurology | www.frontiersin.org
https://www.pebble.com/pebble-smartwatch-features (Updated May 2016). https://www.mongodb.com/ (Updated May 2016).
1 2
2
March 2017 | Volume 8 | Article 96
Zheng et al.
Continuous Monitoring of Essential Tremor
several times, writing “this is a sample of my writing,” signing, dating, drawing two spirals and a line between two points and two bars, and emptying a full glass of water into another empty one several times for examining kinetic and intentional tremor. All tasks are performed during 15 s except writing and drawing. Patients perform the tasks several times until they learn them. Each item is rated on a scale from 0 to 4 corresponding to the severity of tremor by the patient (not induced by the neurologist) and by two neurologists. In order to assure an adequate accomplishment of the standardized tasks at home, patients will have a fully documented guide containing clear instructions on how to perform and quantify each task. When performing the standard tasks, the patients were asked to report a self-evaluation score for each task and the system would add a timestamp for each task, so that the task-induced tremor can be identified by comparing the timestamp. During these tasks, all movement data are being collected and uploaded to the remote server in real time. The movement monitoring process begins once the patient is able to manage the system and perform the tasks correctly. The outpatient monitoring consists of continuous capturing of all unrestricted movements since waking up in the morning until bedtime at night and during the predefined task performed three times every day. Patients should perform and rate all tasks according to FTMTRS, oriented by a fully documented guide.
highest reliable frequency was 12.5 Hz. This sampling rate is enough for the analysis of tremor which is lower than 12 Hz. To see details, the reviewer or the readers can consult the original data at https://drive.google.com/file/d/0B3UOl_ J6yg0vOU8wcnhQVWlmYkk/view, where some figures show the original acceleration data and corresponding FFT results of the healthy subject and one of the patients.
Tremor Classification
The acceleration data collected on regular time basis were transformed into the frequency domain with the FFT operation. After the transformation, the frequencies between 4 and 8 Hz were filtered. Since the amplitude can only reflect the information of each corresponding frequency, the tremor energy in this frequency range was calculated to better represent the complete information. Suppose a(t) is the acceleration at the time t and A(jw) is the Fourier transformation of a(t), then: ∞
2
−∞
∞
2 1 A ( jw ) dw 2π −∫∞
where A ( jw ) is the power spectral density of the acceleration a(t). The relevant tremor energy becomes 2
W
Data Analysis
E=
Three ratings of ET were performed on each patient: the assessment of neurologists during standardized tasks at hospital, the self-assessment of the patients during standardized tasks at home, and the analysis result based on the data collected during continuous monitoring. Since each patient performed standardized tasks three times per day and the monitoring lasts for several days, the average value of the patient’s selfassessment scores of all tests for the same patient is calculated to represent the final score of patient’s self-assessment result. Pearson correlation was used to evaluate the agreement degree between different scores.
2 1 U A ( jw ) dw ∫ 2π WL
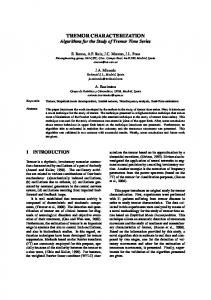
WL and WU are the tremor frequency range, which are 4 and 8 Hz, respectively. And E is the energy assigned to the ET relevant frequencies for the specific period of time. Tremor was classified into four levels corresponding to the FTMS scale according to the energy of the tremor in the frequency domain. The basic analysis unit in this research is 1 min; 1,500 records were included in each basic analysis unit and around 160 values locate in the 4–8 Hz frequency range. The data collected in 1 h from four patients (with tremor grades 1–4, respectively, according to the evaluation of the neurologists) were adopted to define the thresholds. First, FFT operation was applied and the tremor energy was calculated for each minute (60 values for each patient and 240 values in total) as it is shown in Figure 1A. Second, the 240 energy values were classified into four groups using the K-mean clustering method, and the result is explained in Table 1 and Figure 1B. Then, the thresholds are defined as below:
Tremor Identification
Tremor was identified according to the frequency difference between voluntary movements and ET. From previous studies, it is known that the frequency of ET is between 4 and 12 Hz. The tremor of the patients in this research shows a lower frequency, between 4 and 8 Hz. We used a frequency filter of this range to identify tremor and eliminate intended human actions, whose amplitude is usually higher than tremor. When analyzing data collected from a healthy subject, infrequently we found high frequency activities that are easy to identify according to this difference of amplitude. Fast Fourier Transform (FFT) can be used to transfer the raw acceleration data from time domain to frequency domain. After the transformation, relevant frequencies are filtered. Therefore, the method is to cast the collected data into the frequency domain through FFT and check if amplitudes above certain threshold between 4 and 8 Hz (31). All movement data were collected with a frequency of 25 Hz; therefore, after the FFT operation, the
Frontiers in Neurology | www.frontiersin.org
∫
a ( t ) dt =
{
}
Thi = 0.5 * Max(Cluster i) + Min (Cluster i + 1) (i = 1, 2, 3) The results are rounded to integers as the three thresholds, which are 425, 904, and 1,202 (mG2), respectively. They classify the tremor into four levels (“Light,” “Medium,” “High,” and “Very high”) corresponding to grades 1–4 of FTMTRS, respectively. The FTMTRS scores of the neurological rating obtained during standardized assessments at hospital were used as a gold standard, and the mean FTMTRS scores of all six tasks were employed for correlation analysis (Pearson correlation, r = 0.80; p = 0.005). After this procedure, tremor condition of 1 min can
3
March 2017 | Volume 8 | Article 96
Zheng et al.
Continuous Monitoring of Essential Tremor
Figure 1 | (A) Tremor energy between frequency range 4 and 8 Hz of each minute for four patients. (B) K-mean clustering result: the data were separated into four classes corresponding to the four tremor grades of FTMS.
Data Generalization
Table 1 | K-mean clustering result of the tremor energy based on the data collected from four patients.
Cluster size Cluster means Max value Min value
Cluster 1
Cluster 2
Cluster 3
Cluster 4
77 229.30 421.03 124.05
84 620.36 816.34 429.54
57 1,036.89 1,004.71 993.42
22 1,722.60 2,243.06 1,398.99
Since the proposed data collecting system is able to collect the daily movement data of the patients continuously, a larger scale analysis covering a longer period is possible. As the ET energy is not constant in time, it is convenient to provide a time independent yet consistent method to present the ET level. By using this method, it will be possible to compare different episodes for the same patient or different patient results. The proposed method represents a bi-dimensional diagram where on the Y axis represents the maximum energy value, max (E(i)), where N is the i [1,.., N ] number of minutes under consideration and E(i) is the energy
be represented with a single quantitative value. By combining the analysis result of every minute, the tremor condition in longer period can be revealed, for instance, in each hour or each day.
Frontiers in Neurology | www.frontiersin.org
4
March 2017 | Volume 8 | Article 96
Zheng et al.
Continuous Monitoring of Essential Tremor
associated with every minute. On the X axis, the averaged energy
High Y values and low X values or low Y values and high X values mean low ET intensity. Therefore, it is feasible to use the area of the rectangle defined by (0, 0) and the point representing the patient data as the ET intensity metrics. Thus, tremor situation of every hour can be represented with a single point, then, the analysis scale can be enlarged by 60 times.
N
∑E(i)/N is represented, in such a way that the structure of this i =1
chart remembers the Receiver Operating Characteristic diagram. Table 2 | Summary of the data collected from the eight patients. Item Total number of patients Total number of hours (days) Hours per patient (minimum) Hours per patient (maximum) Hours per patient (mean) Hours per patient (SD)
Value
RESULTS
8 208 (16 days) 17 34 26 6.05
All patients wore the smartwatch consistently and performed the standardized tasks as required every day. Each patient wore the smartwatch 3 days at least and the data of 2 days from each of them were selected for the analysis. More details
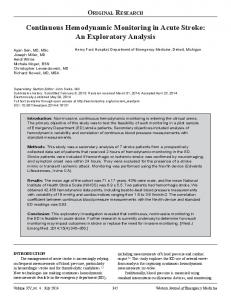
Figure 2 | (A) Day-to-day correlation between patients’ auto-assessment scores during 2-day standardized tasks and, (B) Correlation of standardized tasks between auto-assessment and neurologist scores, of the all eight patients.
Frontiers in Neurology | www.frontiersin.org
5
March 2017 | Volume 8 | Article 96
Zheng et al.
Continuous Monitoring of Essential Tremor
about the data collected from the eight patients are shown in Table 2. Patient’s self-assessment scores between tremor ratings from days 1 and 2 for each patient show good agreement (r = 0.87, 95% CI: 0.72−0.94, p