Int. J. Mol. Sci. 2015, 16, 23210-23226; doi:10.3390/ijms161023210 OPEN ACCESS
International Journal of
Molecular Sciences ISSN 1422-0067 www.mdpi.com/journal/ijms Article
Improved Monitoring of Semi-Continuous Anaerobic Digestion of Sugarcane Waste: Effects of Increasing Organic Loading Rate on Methanogenic Community Dynamics Athaydes Francisco Leite 1, Leandro Janke 2, Zuopeng Lv 1, Hauke Harms 1, Hans-Hermann Richnow 3 and Marcell Nikolausz 1,* 1
2
3
Department of Environmental Microbiology, Helmholtz Centre for Environmental Research-UFZ, Permoserstrasse 15, 04318 Leipzig, Germany; E-Mails:
[email protected] (A.F.L.);
[email protected] (Z.L.);
[email protected] (H.H.) Department of Biochemical Conversion, Deutsches Biomasseforschungszentrum Gemeinnützige GmbH, Torgauerstrasse 116, 04347 Leipzig, Germany; E-Mail:
[email protected] Department of Isotope Biogeochemistry, Helmholtz Centre for Environmental Research-UFZ, Permoserstrasse 15, 04318 Leipzig, Germany; E-Mail:
[email protected]
* Author to whom correspondence should be addressed; E-Mail:
[email protected]; Tel.: +49-341-2434-566. Academic Editor: Marianne Su-Ling Brooks Received: 28 August 2015 / Accepted: 22 September 2015 / Published: 25 September 2015
Abstract: The anaerobic digestion of filter cake and its co-digestion with bagasse, and the effect of gradual increase of the organic loading rate (OLR) from start-up to overload were investigated. Understanding the influence of environmental and technical parameters on the development of particular methanogenic pathway in the biogas process was an important aim for the prediction and prevention of process failure. The rapid accumulation of volatile organic acids at high OLR of 3.0 to 4.0 gvs·L−1·day−1 indicated strong process inhibition. Methanogenic community dynamics of the reactors was monitored by stable isotope composition of biogas and molecular biological analysis. A potential shift toward the aceticlastic methanogenesis was observed along with the OLR increase under stable reactor operating conditions. Reactor overloading and process failure were indicated by the tendency to return to a predominance of hydrogenotrophic methanogenesis with rising abundances of the orders Methanobacteriales and Methanomicrobiales and drop of the genus Methanosarcina abundance.
Int. J. Mol. Sci. 2015, 16
23211
Keywords: sugarcane waste; biogas reactor overloading; methanogenic pathways; stable isotope fingerprinting; monitoring tool
1. Introduction Sugarcane is widely used in Brazil for bioethanol and sugar production. Bioethanol is well established as fuel primarily in Brazil, whereas sugar supplies the national and international markets. However, the waste generated by the bioethanol/sugar industry consisting mainly of filter cake, vinasse, and bagasse is not managed adequately, since it is still rich in energy when disposed. For the treatment of these waste products, the anaerobic digestion (AD) process was chosen as a promising technology for energy recovery, since the digestate could still be used to fertilize the sugarcane fields, as discussed in our previous study [1–4]. Despite the methane potential of sugarcane waste, the use of such novel substrates in AD requires research to achieve a process of practical and economic viability. Applying a continuous feeding biogas process along the entire year is a challenge due to the temporal availability of the substrate during approximately 200 operating days of the Brazilian bioethanol/sugar industry. A rapid start-up of the biogas process for more productivity reaching high levels of OLR at the beginning of the operation season may be the solution. Furthermore, the organic loading rate (OLR) is a factor of interest as it determines how much substrate can be treated and converted into biogas per time and reactor volume. However, at high OLR there is a risk of acidification by overloading, potentially followed by process failure. The tightrope walk between exploiting the reactor potential and maintaining a stable process requires cost effective monitoring which allows predicting and assessing process instabilities/failure particularly when the feeding regime is changed. It has been shown that stable isotope fingerprinting of the produced biogas can provide information about the most sensitive functional guild in the AD, the methanogens [5]. In AD the organic matter degradation into biogas proceeds in four major steps, i.e., hydrolysis, acidogenesis, acetogenesis, and methanogenesis, which are carried out by the complex consortia of various bacteria and methanogenic archaea [6]. Methanogenesis, as the terminal phase for methane production, to which two major pathways (aceticlastic and hydrogenotrophic methanogenesis) contribute, is a major target for biogas process optimization [7]. Acetate, H2, and CO2 (or formate) are the products of the digestion of macromolecules by hydrolytic, acidogenic, and acetogenic bacteria. Aceticlastic methanogens convert acetate into methane and carbon dioxide, whereas hydrogenotrophic methanogens catalyze the conversion of H2 and CO2 (or formate) to methane. In a stable AD process these complex microbial consortia cooperate and self-regulate their abundances and activities. However, overproduction of organic acids by the bacterial community, e.g., triggered by substrate overload, may overexert the downstream consumption and result in drastic acidification which inhibits the methane production [8]. Thus, to establish and optimize a biogas process with novel substrates such as waste products from the bioethanol/sugar industry, it is essential to study the propensity for acidification and its effect on the methanogenic communities.
Int. J. Mol. Sci. 2015, 16
23212
Several research studies using different substrates have assessed the microbial diversity in laboratory- and large-scale biogas reactor [9–11] and the effect of reactor parameters such as organic acid accumulation on the methanogenic diversity and pathway dominance [12–14]. However, to our best knowledge, the effect of acidification by overloading of biogas reactors fed with sugarcane waste has not been investigated. Furthermore, it is known that the susceptibility of AD to overloading depends on the substrate, reactor type, and temperature, thus motivating the present investigation with a novel substrate. The assessment of the methanogenic community in biogas reactors requires appropriate methods. Variations of the methanogenic community can be analyzed by molecular techniques [15,16], whereas analysis of the biogas isotope composition provides information about the relative contributions of the methanogenic pathways [5,17–19]. While molecular biological analyses appear very time-consuming and costly for routine process monitoring, biogas isotope composition appears to be a promising monitoring parameter for industrial biogas processes [20]. Laboratory-scale, semi-continuously-fed, stirred digesters were established to observe the changes of the activity of methanogens as a function of reactor acidification triggered by overloading. Two parallel reactors with mono-digestion of filter cake as substrate, and two other parallel reactors with co-digestion of filter cake and bagasse were monitored by molecular and isotopic techniques to determine the contributions of the methanogenic pathways. Statistical analyses served to correlate isotope signatures and community structures. 2. Results and Discussion 2.1. Biogas Reactor Performance In Table 1 the technical parameters and reactor performance during the eight phases of operation are shown. An average value was calculated for each of the two reactor pairs performing mono- and co-digestion. Due to the high volatile organic acids (VOA) concentration (2.45 g·L−1) of the digestate mixture used as inoculum, an acclimation of 10 days was required for degradation of the remaining organic matter from the previous reactors. The OLR increased from 0.5 to 4.0 gvs·L−1·day−1 within nine weeks. As a consequence, the hydraulic retention time (HRT) decreased from 36 to 7 and from 37 to 12 days for the mono- and co-digestion reactors, respectively. Along the experiment until Phase 5, the biogas yield was lower for mono- than for co-digestion, whereas the methane content, in mono-digestion reactors was higher. After exceeding the OLR of 2.5 (Phase 5) and 3.0 gvs·L−1·day−1 (Phase 6) for co- and mono-digestion, respectively, the biogas yield decreased drastically. In the co-digestion reactors, the biogas production was inhibited earlier because the pH and the buffering capacity were lowered already in Phase 6. In the following phases, the buffer capacity was insufficient to neutralize the VOA accumulation. The acidification led to decreased biogas yield followed by process failure in both digestion set-ups. Reactor overload and imbalance were already noticed in Phase 6, when the propionate-to-acetate ratios rose from 0.043 to 1.434 (33×) and 0.037 to 1.999 (54×) for mono- and co-digestion, respectively. The results from this phase for mono-digestion were consistent with some other studies, thus confirming that the overload effect is seen earlier from the propionate-to-acetate ratio than from changes in pH or in biogas yield [12,14,21]. Prochazka, et al. [22]
Int. J. Mol. Sci. 2015, 16
23213
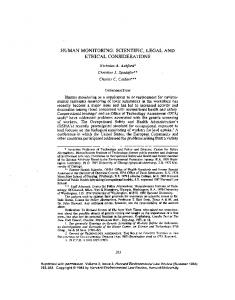
reported that low ammonium nitrogen (NH4-N) concentration (0.5 g·L−1) caused low methane yield, loss of biomass and loss of aceticlastic methanogenic activity, and further presented lower buffer capacity and less stable pH. However, this statement does not corroborate our results until Phase 5, indicating that these findings were circumstantial, i.e., depending on the substrate and microbial adaptation. Although the low NH4-N concentration during mono-digestion in Phase 6 did not influence negatively the methane yield, foaming was observed in both parallel reactors, which necessitated liquid volume reduction for mono-digestion. The foaming can be ascribed to non-degraded soluble organics, which result in the surface tension reduction of reactor content [23]. At high volatile organic acids per total inorganic carbonate buffer (VOA/TIC) values (3.1 gVOA·gCaCO3−1) in Phase 7, the total- (TS) and volatile solids (VS) values also increased due to the lack of further degradation of the organic matter. This indicated that not just the methanogenesis, but the whole process was inhibited eventually. 2.2. Methanogenic Community Dynamics The diversity and structure of the methanogenic communities from the mono- and co-digestion were investigated by terminal restriction fragment length polymorphism (T-RFLP) fingerprinting of the mcrA/mrtA gene (Figure 1) and further validated by sequence analysis of clone libraries (Supplementary Table S1). Immediately before the first feeding on day 10, the reactors displayed similar mcrA/mrtA profiles for both reactor types, but a slight difference in the relative T-RF abundances was observed, indicating distinct acclimatization of the inoculum mixture. In Phase 1, the strictly aceticlastic genus Methanosaeta and the versatile genus Methanosarcina were more abundant in mono- than in co-digestion set-ups, whereas the strictly hydrogenotrophic genus Methanoculleus was more predominant in the co-digestion reactors. In both digestions, the abundance of Methanosarcina increased gradually from Phase 2 to Phase 6, reaching a proportion of approximately 80%. Methanosaeta was not detected after the acetic acid concentration started to increase in the process in Phase 4. The high affinity of Methanosaeta for acetate is a competitive advantage over Methanosarcina at low acetic acid concentrations [24], but at higher concentrations Methanosarcina is outcompeting Methanosaeta. Our observation of Methanosaeta at low acetic acid concentration is consistent with the findings of other studies [12,25,26]. To our surprise, at very high acetic acid concentrations during the Phase 7 and Phase 8 of mono-digestion, Methanosaeta was detected again, whereas the abundance of Methanosarcina dropped. Chen and He [27] also demonstrated competitiveness of Methanosaeta with Methanosarcina at high acetate levels. In the co-digestion reactors Methanobacterium predominated mainly in Phases 7 and 8. Sequences affiliated to the hydrogenotrophic genus Methanoregula were relatively abundant in the last phases of the experiment, when the propionate-to-acetate ratio drastically increased and the pH decreased. According to Yashiro, et al. [28] the genus Methanoregula includes acid-tolerant strains.
Int. J. Mol. Sci. 2015, 16
23214 Table 1. Major reactor parameters along the eight phases of the experiment set-up.
Reactor’ Parameters
Phase 1
Phase 2
Phase 3
Phase 4
Phase 5
Phase 6
Phase 7
Phase 8
(sampling Day: 19)
(sampling day: 26)
(sampling day: 33)
(sampling day: 40)
(sampling day: 55)
(sampling day: 61)
(sampling day: 68)
(sampling day: 75)
Mono-
Co-
Digestion (mL·gVS−1)
Biogas yield * CH4 § (%) CO2 § (%) Acetic acid (mg·L−1) Propionic acid (mg·L−1) n-Butyric acid (mg·L−1) VOA (g·L−1) VOA/TIC (gVOA·gCaCO3−1) pH * NH4-N (g·L−1) TS (%) VS (%)
1086.3 57.7 42.3 55.7 10.7 4.7 0.8 0.2 7.5 1.0 3.1 2.1
1198.2 55.6 44.4 37.3 6.9 2.5 0.8 0.2 7.5 1.1 2.9 2.0
Mono-
Co-
Digestion 506.9 57.4 42.6 26.7 6.7 3.1 0.6 0.2 7.4 0.8 2.7 1.8
541.0 56.6 43.4 25.4 4.9 2.0 0.7 0.1 7.3 0.8 2.6 1.7
Mono-
Co-
Digestion 283.9 60.3 39.7 46.1 5.3 2.2 0.6 0.2 7.5 0.6 2.5 1.7
409.6 53.9 46.1 69.6 4.6 1.8 0.6 0.2 7.5 0.9 2.7 1.8
Mono-
Co-
Digestion 292.8 57.8 42.2 160.3 13.1 19.5 0.5 0.2 7.2 0.5 2.3 1.6
329.2 54.9 45.1 120.5 8.8 12.1 0.5 0.2 7.1 0.5 2.8 1.9
Mono-
Co-
Digestion 368.3 61.3 38.7 240.6 10.4 5.3 1.0 0.2 7.2 0.3 2.1 1.5
410.9 54.9 45.1 155.6 5.8 1.8 0.8 0.2 6.9 0.3 2.3 1.7
Mono-
Co-
Digestion 397.6 61.1 38.9 145.1 208.0 26.0 0.6 0.7 7.0 0.1 2.1 1.6
251.2 na na 141.9 283.7 6.7 0.6 0.6 6.5 0.1 2.1 1.5
Mono-
Co-
Digestion 127.9 na na 1003.0 537.6 428.9 2.2 3.1 6.3 0.2 5.6 3.8
58.3 na na 914.2 550.7 403.3 2.1 3.1 5.7 0.1 na na
Mono-
Co-
Digestion 69.7 na na 1370.0 433.9 1144.8 na na 5.4 0.1 6.9 4.5
33.7 na na 1334.1 391.8 1193.0 na na 5.2 0.2 7.6 5.0
* Only for these parameters an average of all measurements during each specific Phase was done, since these parameters were analyzed almost every day; § Trace gases were not detected in our measurements with the applied technique, therefore we rounded our CH4 and CO2 values to 100%; “sampling day” corresponds to the last Phase day, when the samples were analyzed; “na” refers to not analysed due to technical operation problems: the very low biogas production on the last two phases hindered the GC measurement for gas composition; the low pH values detected on the last phase hindered the titration of sample for measuring VOA and VOA/TIC; and the TS and VS measurement was hindered by technical mistake while handling the samples.
Int. J. Mol. Sci. 2015, 16
23215
Figure 1. Methanogenic community dynamics in the mono- (a) and co-digestion (b) reactor. The relative T-RF abundance of methanogens in the digestate samples are given as function of experiment time. For each of the parallel reactors in the specific digestion set-up, two samples were analyzed, that in total four samples were analyzed for each, mono- and co-digestion. All samples belonging to the same digestion set-up had similar methanogenic community based on the relative T-RF abundances. Therefore, each bar on the graphic represents the T-RFLP profile calculated by the average of the four analyzed samples in each digestion set-up. The supporting clone libraries and sequence analysis of the selected clones allowed the taxonomic affiliation of the T-RFs from the community T-RFLP profiles of the complex reactor samples.
Int. J. Mol. Sci. 2015, 16
23216
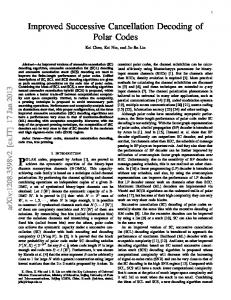
2.3. Isotopic Changes of the Produced Biogas Carbon-stable isotope compositions of filter cake and bagasse samples were analyzed since they influence the final isotope composition of the produced methane [5]. Filter cake and bagasse had isotope signatures of −14.30‰ and −13.64‰ δ13C, respectively, which are in the typical range for C4 plants (δ13C values between −12‰ and −16‰) [29]. The gradual overload of the mono- and co-digestion reactors resulted in process changes that were monitored via the isotope composition of the biogas in terms of δ13CCH4, δ13CCO2, and δ2HCH4 (Figure 2). Both digestion set-ups had very similar dynamics. The δ13CCH4 became enriched from −52‰ to about −32‰ along the gradual OLR increase until Phase 5 at 2.5 gvs·L−1·day−1 (Figure 2a). Following, the Phase 6 had similar isotope values as the previous phase. This stationary isotope signature around −32‰ is consistent with former studies that found similar isotope fractionation of biogas samples from continuous stirred tank reactors (CSTRs) fed with C4 plant maize silage [5,19]. The inhibition of biogas production in co-digestion in Phase 6 also coincided with the isotopic depletion of the methane associated with slightly lighter δ13CCH4 values. In the last two phases of the experiment, when the process was clearly inhibited, depletion of δ13CCH4 values was observed. The δ13C of carbon dioxide in the produced biogas in the mono- and co-digestion presented also similar trends (Figure 2b) with an enrichment from 4‰ to about 15‰. However, only in Phase 6 the tendency between both digestion set-ups differed. In this case, the biogas production inhibition in co-digestion may have resulted in abrupt δ13CCO2 depletion. Phase 7 had the most enriched δ13CCO2 composition, followed by drastic depletion in 13C values in Phase 8. However, the observed isotope effect is at certain extent due to the decreasing pH and the associated fast degassing of the CO2 from the bicarbonate in the liquid. The hydrogen isotope composition of methane (δ2HCH4) in the mono- and co-digestion shows similar trends (Figure 2c). The hydrogen isotope compositions showed an opposite tendency to carbon isotope composition regarding enrichment and depletion periods. After the feeding regime has stated at Phase 1 the isotope values depleted from around −327‰ to −342‰ at the end of the stable operation phases. In the final phases, δ2HCH4 enriched to about −322‰ when OLR drove the methanogenic process to collapse.
Int. J. Mol. Sci. 2015, 16
23217
Figure 2. Isotopic dynamics of δ13CCH4 (a); δ13CCO2 (b); and δ2HCH4 (c) along gradual OLR increase in biogas reactors fed with sugarcane waste products. Isotope data of CO2 during the last overload phase contains data uncorrected regarding the pH shift induced degassing.
Int. J. Mol. Sci. 2015, 16
23218
2.4. Methanogenic Pathways The apparent fractionation factor (αC) calculated based on δ13CCH4 and δ13CCO2 composition as previously described [30–32] was used to identify a predominance of hydrogenotrophic and aceticlastic methanogenesis (Figure 3a). An intermediate αC value ranging between 1.065 (>for hydrogenotrophic) and 1.025 (