INTERSPEECH 2007
Continuous-Speech Phone Recognition from Ultrasound and Optical Images of the Tongue and Lips Thomas Hueber 1,3, Gérard Chollet 3, Bruce Denby 1,2, Gérard Dreyfus 1, Maureen Stone 4 1
Laboratoire d’Electronique, Ecole Supérieure de Physique et de Chimie Industrielles de la Ville de Paris (ESPCI-Paristech), 10 rue Vauquelin, 75231 Paris Cedex 05 France 2 Université Pierre et Marie Curie – Paris VI, 4 place Jussieu, 75252 Paris Cedex 05 France 3 Laboratoire Traitement et Communication de l’Information, Ecole Nationale Supérieure des Télécommunications (ENST-Paristech), 46 rue Barrault, 75634 Paris Cedex 13 France 4 Vocal Tract Visualization Lab, University of Maryland Dental School, 666 W. Baltimore Street, Baltimore, MD 21201 USA
[email protected],
[email protected],
[email protected],
[email protected],
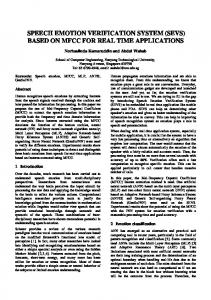
[email protected] the present article focuses on speech recognition from videoonly data; the use of an ultrasound video stream for denoising a corrupted audio stream will be addressed in future work. Our approach is based on building a corpus associating videoextracted visual feature sequences to phoneme labels. HMMbased stochastic models trained on this database are then used to predict target phonetic sequences. An overview of the system is given in figure 1. Section 2 of the article details data acquisition and ultrasound image preprocessing, while speech segmentation techniques appear in section 3. The visual feature extraction is discussed in section 4. Procedures involved in speech recognition from video-only data are presented in section 5 and our results detailed in section 6. A discussion of the results and some ideas for future improvements appear in section 7.
Abstract The article describes a video-only speech recognition system for a “silent speech interface” application, using ultrasound and optical images of the voice organ. A one-hour audiovisual speech corpus was phonetically labeled using an automatic speech alignment procedure and robust visual feature extraction techniques. HMM-based stochastic models were estimated separately on the visual and acoustic corpus. The performance of the visual speech recognition system is compared to a traditional acoustic-based recognizer. Index Terms: speech recognition, audio-visual speech description, silent speech interface, machine learning
1. Introduction In recent years, several systems using articulatory data to synthesize speech in real time have been described in the literature. These data may be derived from EMG/EPG measures [1], from a “non audible murmur microphone” signal (NAM [2]) or, in our case, from ultrasound and optical images of the voice organ [3]. Such a synthesizer, driven only by articulatory data, may be qualified as a “silent speech interface” (SSI), in that it could be used as an alternative to tracheo-oesophageal speech or electrolarynx for laryngeal cancer patients, in situations where silence must be maintained, or for voice communication in noisy environments. Laptop based high performance ultrasound medical imaging systems are available today, allowing to envisage, for example, an ultrasound-based SSI telephone for home use. Ultimately, a wearable real-time SSI system with an embedded ultrasound transducer and camera, piloted by a personal digital assistant (PDA), should be possible. In [4], a static neural network was used to learn the “visuo-acoustic” mapping between the ultrasound tongue and optical lip images (called the “video” data) and a set of Line Spectrum Frequencies (LSF). That study demonstrated the relevance of visual features for describing the voice organ but permitted only LPC-based synthesis without an appropriate excitation signal. Here, we propose visual speech recognition as a first step towards corpus-based silent speech synthesis, which furthermore allows the possibility of introducing linguistic constraints in our analysis. In the context of "silent" speech,
Ultrasound video of the vocal tract
T R A I N I N G
Optical video of the speaker lips
Recorded audio
Text
Speech Alignment
Visual Feature Extraction
Visual Units Database
HMM-based Modeling
T E S T
Visual Data
Visual Speech Recognition
Phonetic Targets
Figure 1: An overview of the visual speech recognition system. Features derived from images, text and acoustic signals are combined together in an audio-visual speech corpus. HMM-based modeling method is used for speech recognition from videoonly data.
658
August 27-31, Antwerp, Belgium
2. Data acquisition and preprocessing
from the temporal boundaries of the phonemes in the audio signal. The alignment procedure can thus be viewed as a simplified recognition task in which the phonetic sequence is already known. The HTK front-end [7] was used to accomplish this task. The speech acoustic signal is first parameterized using 12 Mel-frequency cepstral coefficients, with their normalized energies, deltas and accelerations (zero mean and unit standard deviation). The transcribed multispeaker DARPA TIMIT speech database [8] is then used to build initial HMM acoustic models. These 5-state (with one non-emitting initial state, and one non-emitting terminating state), 16 mixture, left-to-right HMM models are finally applied to segment the audio stream of the corpus.
An audio-visual database comprising video sequences of the voice organ together with the uttered speech signal was constructed using the Vocal Tract Visualization Lab HATS system [5]. This system is needed to fix the speaker’s head and support the ultrasound transducer under the chin without disturbing speech. A lip profile image is embedded into the ultrasound image, as shown in figure 2.
a d
c
4. Visual feature extraction The ultrasound images are first reduced to a polar region-ofinterest grid delimited by the acoustic shadows (figure 2) of the hyoid bone and mandible. In [4], a PCA-based feature extraction approach, called “EigenTongues” in analogy to Turk and Pentland’s “EigenFaces” for face recognition [9], interpreted the ultrasound image as a linear combination of standard vocal tract configurations, thus extracting more information from the images than a contour-based approach. In the present study, this method was improved by adapting the coding of the standard vocal tract configurations to a speech description context. Rather than using a random subset of frames to build the basis vectors of the “EigenTongue” decomposition, visual units from each phone class were picked to constitute the training database. This guarantees a better exploration of the possible vocal tract configurations, and tests showed that equivalent coding quality could be obtained with fewer input features than in the previous method. An analogous approach, called “EigenLips,” was used to code the lip frames. The first three basis vectors of the “EigenTongue” and “EigenLip” decompositions are shown in figure 3. Finally, in order to improve the segmentation precision, visual feature sequences were oversampled from 30 Hz to 100 Hz, using linear interpolation.
c
b
Figure 2: Example of an ultrasound vocal tract image with embedded lip profile and regions of interest: (a) tongue surface; (b) hyoid bone; (c) hyoid & mandible acoustic shadows; (d) muscle, fat, connective tissue The recorded speech dataset consists of the 720 sentences (organized in 72 lists) of the IEEE/Harvard corpus [6] pronounced by a male native American English speaker. After cleaning the database, the resulting speech (43 minutes) was stored as 72473 JPEG frames and 720 WAV audio files sampled at 16000 Hz. Though acquisition of longer datasets would clearly be advantageous, speaker comfort issues render this impossible with our acquisition system in its present form. The synchronous acquisition of two different video streams with the audio signal is also a critical issue. An analog video mixer limits the frame rate of our acquisition chain to 30 Hz, which, compared to a standard speech analysis rate of 100 Hz, is insufficient to register all vocal tract configurations. The recording of larger databases with higher frame rate with an improved system is in the planning stages. The IEEE/Harvard base was initially chosen because all sentences have roughly equal intelligibility and approximately the same duration, grammatical structure and intonation across lists. They are furthermore constructed to preserve the mean frequencies of occurrence of segmental phonemes in the English language. The 1889 words of the IEEE/Harvard base were transcribed into phoneme sequences using the CMU 1 and British English 2 (BEEP) pronunciation dictionaries. Nonetheless, with mean and standard deviation of the number of phone occurrences of 393.5 and 358.5, respectively, the phonetic coverage of the sentences is rather sparse, and some of the phonetic models undoubtedly suffer from a lack of examples in the training database.
Figure 3: The first three EigenTongues (top) / EigenLips (bottom), from left to right.
5. Visual speech recognition
3. Segmental speech description
As our speech database is less than one hour long, and has rather sparse phonetic coverage, the use of context-dependant models cannot be envisioned in this study. Rather, a set of 45 left-to-right, 5-state (3 emitting states), continuous monophone HMM’s is used to model the visual observation sequences of each phoneme class. Each visual observation is composed of 15 EigenTongues and 5 EigenLips with their
As the visual and audio streams are synchronized, the initial phonetic segmentation of the video sequences can be obtained
1 2
www.speech.cs.cmu.edu/cgi-bin/cmudict svr-www.eng.cam.ac.uk/comp.speech/Section1/Lexical/beep.html
659
delta and acceleration coefficients, centered and normalized (unit variance). The number of projections onto the set of EigenTongues or EigenLips used for coding is obtained by empirically evaluating the quality of the image reconstruction from its first few components. Once this initial set of models has been created and initialized, embedded training is performed, and the HMM models are incrementally refined by increasing the number of Gaussians per state to 32. Visual speech recognition is performed using a Viterbi algorithm which finds the optimal path through the word model network, where word models are obtained by concatenating phone HMM models. As the experiment is intended to show the quality of the HMM-based modeling, no statistical language model is used in this study. Thus, speech recognition is constrained only by the use of a pronunciation dictionary built from the IEEE/Harvard sentences, containing in our case 2390 items (some words of the IEEE/Harvard corpus are transcribed with several pronunciations). In order to increase the statistical relevance of the speech recognizer performance, a jackknife (leave-one-out) technique [10], in which each list of ten sentences was used once as the test set, was employed. For each phone class, a representative measure P of the recognizer performance is defined as P = 100
The overall performance figures of video-only and audioonly speech recognition experiments are presented in table 1. As the visual (VSR) and audio (ASR) speech recognizers share the same decoding dictionary and do not use language models, the accuracy of the visual HMM models as compared to ASR can be directly deduced from the table. Though as yet inadequate for synthesis purposes, the results are nonetheless quite promising. Table 1. Performance comparison of the visual (VSR) and acoustic-based (ASR) speech recognizers. Criterion P Δ D S I N
ASR VSR 71.0 % 54.5 % 1.3 % 1.4 % 874 2994 2485 4123 2101 1459 18874
The high deletion error rate in visual speech recognition, defined as d = 100 !
X N ! D ! S ! I (1) = 100 N N
D N
(3)
may be due to the original video sampling rate of 30 Hz. Indeed, this rate makes the visualization of the vocal tract configuration difficult for very short phones, as illustrated in table 2.
where N is the total number of phones in the test set, S the number of substitution errors, D deletion errors, and I insertion errors. A 95% confidence interval Δ is computed from the Wilson formula [11]:
Table 2. Relation between deletion error rate and mean phone duration. Illustration for phones having the first three highest/lowest deletion error rates.
t" 1 + 4NX(1 # X) (2) ! = 100 N 1 + t"2 / N
using tα = 1.95 and a normal approximation. An identical procedure was used for traditional speech recognition based on acoustic features. As in visual speech recognition, a set of 45 context-independent, left-to-right, 5state, 16-mixture, continuous monophone HMM’s is estimated on each training pass. Because the goal of this study is not to achieve high accuracy on audio speech recognition, no more sophisticated modeling methods have been employed. In fact, adding or removing state transitions, tying parameters between models or forming some contextdependant models where possible could have refined these acoustic models. As such, the performance of our acousticbased recognizer can be considered a target for this database.
Phoneme dh t ax
d 37.3 % 19.3 % 17.7 %
Mean Duration 0.05 s 0.09 s 0.05 s
sh uw ey
4.0 % 3.2 % 1.6 %
0.17 s 0.12 s 0.16 s
A decomposition of our results into the different phoneme classes appears in table 3. The recognition scores of plosives (p, b), fricatives (f, v) and nasal (m,n) phonemes show that labial movements are relatively well detected. Velar sounds (ng, k, g), formed by the tongue body and articulated near the soft palate, are also well recognized. However, vocal tract configurations corresponding to dental sounds (th, dh) and alveolar sounds (s, sh, t, d) are more difficult to detect. This can be explained by the lack of information about the relative position of the apex (tip of the tongue) and the teeth. Indeed, in the ultrasound images, the apex is hidden by the acoustic shadow of the mandible. Finally, the performance on vowel detection, which can theoretically be classified by how far forward and how high the tongue is in the mouth, is more difficult to interpret, and for some phonemes (ah, uh), the performance of our VSR system is quite low. It seems likely that context-independent HMM models used are not efficient enough to cope with the variability of these phones caused by the co-articulation phenomena.
6. Results Figure 4 illustrates qualitatively the performance of the visual speech recognizer on an example in which the predicted phone sequence is time aligned with the reference phonetic transcription via a dynamic programming based string alignment procedure. Correct predictions as well as errors are apparent.
Figure 4: Reference phonetic transcription (Ref) and predicted phonetic transcription (Rec) derived from visual features.
660
Table 3. Visual speech recognizer performance P by phoneme, where Δ is the 95 % confidence interval and N the number of occurrences. Phone zh hh ah ch sh uh jh er ih ae z th dh y d eh ax t b uw n v ao aa g ey ow m ix f p s ng el aw iy ay r k w l oy
Typical word azure hay but choke she book joke bird bit bat zone thin then yacht day bet about tea bee boot noon van bought bott gay bait boat mom debit fin pea sea sing bottle bout beet bite ray key way lay boy
P (in %)
N
0 9.7 19.6 27.4 32.9 34.2 35.3 41.9 43.4 47.4 52 52 53 53.5 54 58 58.5 58.9 59.3 59.8 60.6 60.7 62 62 62.5 64 66.5 68.5 68.7 69.6 70.6 71.8 74.7 75 75.1 75.2 76.2 82.5 86.4 87.9 90 91.8
1 256 322 142 149 114 99 203 934 449 713 98 915 114 995 379 1767 1733 440 249 1453 349 600 261 224 425 323 524 32 539 582 1131 186 24 173 733 425 1157 805 537 1121 49
articulators. The visual speech recognition will furthermore have to be validated on a larger dictionary with a robust language model, or as a limiting case, without any dictionary. Finally, the construction of a larger database, with a higher video sample rate and an additional front view of the speaker’s face, is foreseen.
Δ (in %) NA 7.2 8.5 14.3 14.7 16.9 18.1 13.3 6.3 9.1 7.2 19.1 6.4 17.7 6.1 9.8 4.6 4.6 9.1 11.9 5 10 7.7 11.6 12.4 9 10.1 7.9 29 7.7 7.3 5.2 12.2 30.6 12.6 6.2 8 4.3 4.7 5.5 3.5 14.7
8. Acknowledgements The authors would like to acknowledge useful discussions with Leila Zouari, Elsa Angelini, Yacine Oussar, and Pierre Roussel and the reviewers for their suggestions. This work is supported by the French Department of Defense (DGA) and the French National Research Agency (ANR).
9. References [1] Maier-Hein, L., Metze, F., Schultz, T., Waibel, A., “Session independent non-audible speech recognition using surface electromyography,” IEEE Workshop on Automatic Speech Recognition and Understanding, pp. 331-336, 2005. [2] Nakajima, Y., Heracleous, P., Saruwatari, H., Shikano, K., “A Tissue-conductive Acoustic Sensor Applied in Speech Recognition for Privacy,” Smart Objects & Ambient Intelligence Oc-EUSAI 2005, pp. 93-98, 2005. [3] Denby, B., Oussar, Y., Dreyfus, G., Stone, M., “Prospects for a Silent Speech Interface Using Ultrasound Imaging,” IEEE ICASSP, Toulouse, France, pp. I365- I368, 2006. [4] Hueber, T., Aversano, G., Chollet, G., Denby, B., Dreyfus, G., Oussar, Y., Roussel, P., Stone, M., “Eigentongue Feature Extraction for an UltrasoundBased Silent Speech Interface,” IEEE ICASSP, Honolulu, pp. I1245-I1248, 2007. [5] Stone, M., and Davis, E., “A Head and Transducer Support System for Making Ultrasound Images of Tongue/Jaw Movement,” Journal of the Acoustical Society of America, vol. 98 (6), pp. 3107-3112, 1995. [6] IEEE, “IEEE Recommended Practice for Speech Quality Measurements,” IEEE Transactions on Audio and Electroacoustics, vol. 17, pp. 225-246, 1969. [7] Young, S., Evermann, G., Hain, T., Kershaw, D., Moore, G., Odell, J., Ollason, D., Povey, D., Valtchev, V., Woodland, P., The HTK Book, Revised for HTK Version 3.3, September 2005, http://htk.eng.cam.ac.uk/. [8] Garofolo, J. S., Lamel, L. F., Fisher, W. M., Fiscus, J. G., Pallett, D. S., Dahlgren, N. L., The DARPA TIMIT Acoustic-Phonetic Continuous Speech Corpus CDROM. NTIS order number PB91-100354, 1993. [9] Turk, M. A., Pentland, A. P., “Face Recognition Using Eigenfaces,” IEEE Computer Society Conference on Computer Vision and Pattern Recognition, Proceedings CVPR, pp. 586-591, 1991. [10] Efron, B., “Nonparametric Estimates of Standard Error: The Jackknife, the Bootstrap and Other Methods,” Biometrika, vol. 68, pp. 589-599,1981. [11] Hogg, R.V., Tanis, E.A., Probability and statistical inference (5th ed.), Upper Saddle River, NJ: Prentice Hall, 1996. [12] Angelini, E., Gerard, O., “Review of myocardial motion estimation methods from optical flow tracking on ultrasound data,” IEEE EMBS Annual International Conference, New York, NY, USA, pp.1537-1540, 2006.
7. Conclusions and perspectives The ability to extract discrete phones from continuous physiological data of the voice organ will be an important step in the design of a silent speech interface. In this article, promising, relevant performance measures have demonstrated the feasibility of phone recognition from ultrasound images of the tongue and optical images of the lips. At present, the single target phonetic sequence derived from the visual features cannot directly be used to drive the research of acoustic segments in the corpus. The single target will have to be enlarged to a lattice of phonetic targets through which a data-driven unit search of the corpus can correct the stochastic model prediction errors. It would also be desirable to provide improved visual features. The use of optical flow based techniques [12], for example, is currently under study in order to model the movement of the visible
661