Proceedings of the Regional Conference on Statistical Sciences 2010 (RCSS’10)
June 2010, 117-125
Control Charts Based on Regression Adjustment Nurazlina Abdul Rashid1 Ishak Ab Ghani2 Shafie Mehad3 1,2,3 Centre for Statistical Studies Universiti Teknologi MARA (UiTM) E-mail:
[email protected].,
[email protected],
[email protected] ABSTRACT Regression residual control charts are applicable to multivariate data which has dependent and independent variables. The control chart consists of plotting univariate regression residuals against time. The control chart can be used to monitor and continuously improve the performance of the dependent variable. In this paper, the control chart for phase I is developed by using the data on the Bachelor of Statistics graduates of UiTM. Then, the developed control chart can be used in phase II, that is, to control and continuously improve the performance of the students by adjusting the process, if necessary. Keywords: control chart, regression adjustment, multiple regressions, residual of multiple regression.
Introduction As reported in Utusan Malaysia (2006), UiTM has one clear objective that is to increase the size of students intake. However the quality has still to be maintained. At present, the system for monitoring student performance has room for improvement. This paper is proposing an improved version to achieve the purpose. Monitoring and controlling academic performance and related factors independently can be very misleading in the sense that if there exists correlated variables, these variables will be inadvertently omitted. This distortion in the process-monitoring procedure increases as the number of factors increase. Process–monitoring problems in which several related variables are of interest are sometimes called multivariate quality control problems. The original work in multivariate quality control was done by Hotelling (1947). In multivariate process monitoring procedure, Hotelling T2 is used to monitor the means of the factors in the process. Various researchers have developed methods to monitor multivariate processes that do not depend on the Hotelling T2 statistics. Hawkins (1991) has developed a procedure called regression adjustment which consists of plotting univariate control chart of regression residuals. Once we have identified a list of important variables that affect the process output, it is usually necessary to model the relationship between dependent variable (Y) and independent variables (X). Statistical techniques which are useful in constructing such models include regression analysis. The multiple regression model Y on X should represent the process that we want to control. In the literature, many writers have mentioned about the relationship between academic performance and students’ characteristics. According to the study undertaken by Tho (1994), the gender variable is a significant explanatory variable of performance. Chansarkar and Mishaeloudis (2001), mentioned that performance of students is not affected by factors like age, sex and place of residence but it is associated with qualification in quantitative subjects. Furthermore, those who live near the university perform better than other students. Hijazi and Raza (2006) explained that family income represents the level of affluence of the student, how much facility, and comforts the student can acquire. A study was conducted by Borde (1998) to determine the extent to which factors like gender, age, academic origin, grade ISBN 978-967-363-157-5 © 2010 Malaysia Institute of Statistics, Faculty of Computer and Mathematical Sciences, Universiti Teknologi MARA (UiTM), Malaysia
117
Proceedings of the Regional Conference on Statistical Sciences 2010 (RCSS’10)
point average, extra curricular activities and employment influence the grades obtained in the course. Husein and Abdel (2002) showed that credit hour had insignificant negative impact on student performance. Performance in mathematics has been shown to be significantly related to positive attitudes toward mathematics (Gallagher & De Lisi, 1994). Shashaani (1995) found that attitudes toward mathematics are an important factor in determining the achievement and participation of students in mathematics.
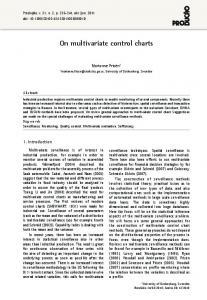
Methodology The approach of this paper is shown in Figure 1.
Figure 1: Approach of the Paper
118
Control Charts Based on Regression Adjustment
Data The data set for this study was obtained from the Department of Research and Innovation UiTM Shah Alam. This study is focused on the BSc Statistics graduates of the Faculty of Computer and Mathematical Sciences, UiTM Shah Alam, for sessions 2006 until 2008. The chosen sampling technique for this study is stratified random sampling. Figure 2 shows the target population and it was divided into six strata, that represents six sessions.
Figure 2: Bachelor of Statistics graduates from 2006 until 2008
The sample size in each stratum will be different because the number of graduates in each session are different. The sample size is shown in Table 1. The sample of graduates was drawn proportionately from the target population using a simple random sampling from each session. Table 1: Sample Size of Graduates According to Intakes by Proportional Allocation Sessions Sample Size
May 06 27
Nov 06 35
May 07 20
Nov 07 26
May 08 28
Nov 08 53
Total 189
Multiple Regression Model Multiple Linear Regression Model is used to describe the relationship between the dependent variable Y, Cummulative Grade Point Average (CGPA), and nine explanatory variables X, entry qualifications (Diploma, Matriculation and STPM), family income, gender, MUET, results in SPM for Mathematics, Additional Mathematics, Malay and English Language. The relationship between Y and X1, X2... X9 is formulated as a multiple linear regression model as follow:
y = β 0 + β 1 X 1 + β 2 X 2+... + β 9 X 9+ε
where Y denotes the CGPA; X1, X2,…,X9 denote the explanatory variables; β0, β1,β2,...,β9 are constants referred to as the model partial regression coefficients and ε is the error term. The random errors are assumed to be normally distributed with mean zero and constant variance σ2. The model is checked to ensure that the underlying assumptions are fulfilled. The diagnostic checks for the model are normality, heterocedasticity and linearity of the error terms and uncorrelated errors with the fitted model.
119
Proceedings of the Regional Conference on Statistical Sciences 2010 (RCSS’10)
Regression Adjustment Control Charts Hawkins (1991) has developed a procedure called regression adjustment control chart. It is very important application when the process has a distinct hierarchy of variables, such as, a set of input process variables (say, the x’s) and a set of output variables (say, the y’s).The residuals are found simply by subtracting the fitted value from the multiple regression model from each corresponding observation on y, that is, ei = yi - ŷi. The residual is regarded as the observed error, while the true error is ε I. Regression adjustment has another nice feature. If the proper set of variables is included in the regression model, the residuals from the model will typically be uncorrelated, even though the original variables of interest yi exhibited correlation. In this paper the individual and moving range control charts are used to monitor the mean and variability of residuals respectively (refer Montgomery (2009) page 259-261). The variance of the error, σ2 , is estimated through the mean of moving range, that is, MR . The theoretical error terms εi are to be independent normal random variable with mean 0 and constant variance σ2, that is, ε ~ N (0,σ 2) . Control Limits for Individual (Residual): Center line = e (mean of the residual) Control limits = e ± 3 MR / 1.128 Control limit for moving range: Center line = MR Upper Control limits = D 4 MR = 3.268MR Lower Control limits = D 3 MR = 0
Analysis Description of this section is on the development of the multiple regression model and the setting up of the regression adjustment control chart. Multiple Linear Regression Model
The model from stepwise method is yˆ = 3.869 – 0.147 x 1 – 0.153 x 2 + 0.082 x 3 – 0.021 x 4 It is the best model compared to models obtain from other methods (forward, backward and enter). The model has some characteristcs such as: 1. The value of R-square is (83%). 2. There are four significant variables: additional mathematics, mathematics, matriculation and Malay language. 3. The error term is normally distributed. 4. The variance of the error term is constant. 5. Residuals fall within a horizontal band centered at 0 6. A linear relationship between dependent variable y and independent variables (x’s). 7. The estimate of standard error is 0.143 8. There is no multicollinearity 9. The model is simple. The multiple regression analysis shows that the model is adequate since all the assumptions on the model have been met. In order to control and maintain the students’ performance, we use the error in this model to construct the regression asdjustment control chart for phase I.
120
Control Charts Based on Regression Adjustment
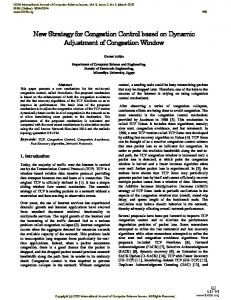
Control Chart The residulas for the six sessions (198 data points) are plotted on individual control chart to monitor the model on CGPA as in Figure 3. Based on the results in Section 2.3, the center line of this control chart is 0.1569, upper control limit is 0.4058 and lower control limit is -0.0921. There are three ponits are out of control. The points no. 139, 152 and 189. 178 which indicate that the residuals are not part of the process. Therefore, these three points need to be excluded from the process.
Figure 3: Individual Control Chart for Residuals
Figure 4 shows a control chart for moving range for the residuals which is used to monitor the variability of the residuals. Based on the results in Section 2.3, the center line of this control chart is 0.1221, upper control limit is 0.4236 and lower control limit is 0. There are four points out-ofcontrol. The points no.71, 73,151 and 189 which indicate that the residuals are not part of the process. Therefore, these four points need to be excluded from the process.
121
Proceedings of the Regional Conference on Statistical Sciences 2010 (RCSS’10)
Figure 4: Moving Range Control Chart for Residuals
A new revised control limits for the individual and moving range control charts should be obtained by ignoring the out-of-control points in the individual and moving range charts. The new centre line and control limits are: Individual Control Chart: Mean = 0.1206 Upper Control Limit = 0.3053 Lower Control Limit = -0.0641 The new control chrt for individual is shown in Figure 5.
122
Control Charts Based on Regression Adjustment
Figure 5: Revised Control Limit of Individual Control Chart
Similarly the moving range chart has to be revised by excluding the out-of-control points. The cente line, uper the control limit and lower control limit are 0.865, 0.3004 and 0 respectively. Figure 6 shows the revised control chart for the moving range of the residuals. Once a phase I has been established, the next step is to implement phase II where the process has to be controlled or improved, if necessary. For example, we have a data set for the coming session. The variables for this data set are CGPA (the dependent variable), additional mathematics, mathematics, matriculation and Malay Language (the four significant variables in
123
Proceedings of the Regional Conference on Statistical Sciences 2010 (RCSS’10)
Figure 6: Revised Control Limit of Moving Range Control Chart
the multiple regression model). Then, we plot the residual on the same control chart of the phase 1. If the residual on the control chart is in-control and do not exhibit any systematic pattern, the process or the multiple regression model of the student performance is said to be the same as before. If the error is outside the control limits, then the process or the multiple regression model of the student performance is said to be different from before. Investigation should be done to find out the reason for the change. Probably, new multiple regression model and control limits have to be developed.
CONCLUSION At present, there is no systematic way for monitoring performance of students in a statistics programme. Regression adjustment control chart can be one of the systematic ways to control and improve the performance of the students. This proposal is in line with the requirements of ISO9001 where the Faculty of Computer and Mathematical Sciences has been rewarded ISO 9001 certification. If this proposal is successful, then it can be implemented for other programmes in UiTM and other institutions of higher learning.
124
Control Charts Based on Regression Adjustment
References Chansarkar, B. A. and Michaeloudis, A. (2001). Student profiles and factors affecting performance. International journal of Mathematical Education Science Technology, 2001, vol. 32, no. 1, 97–104, 103-104. Borde, S.F. (1998). Predictors of student academic performance in the introductory marketing course. Journal of Education for Busines, Vol. 73 No.5, 302-6. Gallagher, A. M., and R. De Lisi. (1994). Gender Differences in Scholastic Aptitude Test - Mathematics ProblemSolving among High-ability Students. Journal of Educational Psychology, 84, 204-211. Hawkins, D. M. (1991). Multivariate Quality Control Based on Regression Adjusted Variables. Technometrics, Vol. 33(1), 61-75. Hijazi, S.T and Raza Naqvi S.M.M. (2006.). Factors Affectings Students’ Performance. Bangladesh eJournal of Sociology, Volume 3, Number 1, January 2006. Hotelling,H. (1947). Multivariate Quality Control, Techniques of Statistical Analysis. Eisenhart, Hastay, and Wallis(eds.), McGraw-Hill, New York. Hussein A. And Abdel.R. (2002). Factors Affecting Student Performance in the Introductory Finance Course. Journal of Economic & Administrative Sciences, Vol.18,No.2. Montgomery, D. C. (2009). Statistical Quality Control: A Modern Introduction, 6th Edition, Wiley, New York. Shashaani, L. (1995). Gender Differences in Mathematics Experience and Attitude and Their Relation to Compute Attitude. Educational Technology, 35(3): 32 – 38. Tho, L.M. (1994). Some determinants of student performance in the University of Malaya introductory accounting course. Accounting Education: An International Journal, Vol. 4, 331-40. Utusan Malaysia (2006). Rencana Fahami realiti penubuhan UiTM. Utusan Malaysia, Malay newspaper, 26 Mac 2006
125