In operations management the statistical conformity control has a vital role. ... al.,
2006), (Slack, et al., 2007), (Heizer & Render, 2011) and (Krajewski, et al., .....
This paper was written as the part of project TÁMOP-4.2.2/B-10/1-2010-0025. ...
Heizer, J. & Render, B., 2011. Operations Management. Global Edition,Tenth ed.
Development of risk-based control charts considering measurement uncertainty Csaba Hegedűs, Zsolt Tibor Kosztyán Department of Quantitative Methods, University of Pannonia, Veszprém, Hungary E-mail:
[email protected]
Abstract In operations management the statistical conformity control has a vital role. Most of the conformity control decisions based on measured values and use reliability approach, but do not take measurement uncertainty and consequences of the decisions into account at the design of the acceptance or rejection rules. This paper points out the flaws of the classical statistical conformity and process control in consideration of uncertainties and consequences, and suggest a new approach to revise these shortcomings. With the suggested method acceptance sampling and statistical control charts can be modified to minimize the risk of the decision. Keywords: risk, decision, statistical process control (SPC) Introduction The fundamental textbooks of operations management – (Russell & Taylor, 2000), (Chase, et al., 2006), (Slack, et al., 2007), (Heizer & Render, 2011) and (Krajewski, et al., 2013) – discuss the statistical quality (conformity) control as a key element of Six Sigma and TQM approaches in the supply chain management. Since Walter A. Shewhart (1931) introduced the control charts they have been widespread in the industrial conformity control without any significant modification. The growing availability and increasing complexity of measurement systems often raises practical problems that require the adaptation of the classical statistical process control (SPC) frameworks in order to accommodate for them (Dale & Shaw, 1987; Thomas, 1987). Current SPC methodologies do not explicitly take into consideration measurement uncertainty information. Thus, the imprecise data rule out the implementation of conventional SPC techniques and tools. So the validity of conventional SPC approaches is questionable (Massotte & Bataille, 2000) and some alternate approach is required Background of the study According to SPC a process is said to be controlled when, through use of past experience, one can predict at least approximately the probability that the observed values of a product characteristic will fall within given limits (Besterfield, 1994). SPC is an optimisation philosophy concerned with continuous process improvements, using a collection of (statistical) tools for data and process analysis, making inferences about process behaviour and decision-making. The goal of SPC is the elimination of variability in the process being aimed at detection of assignable causes of variation, hence at reduction of the overall variability of the control parameters (Montgomery, 1996; Schippers, 1998). Even if the variability of the process cannot be reduced further at a given state of development the variation can be characterized. The consideration of this variation in the decisions improve their effectiveness. There are some shortcomings in the use (and misuse) of statistical conformity control. In classical SPC the distribution of observed values is assumed normal in most of the cases. Though traditional control charts work even if the normality criteria is violated (Montgomery,
1
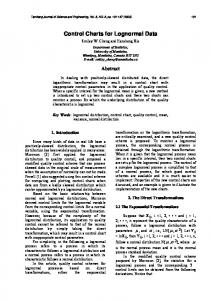
1996) if the sample size below 4 or individual value chart is applied the non-normality could increase the decision errors significantly (particularly type I errors) (Schilling & Nelson, 1976). However the MA and EWMA charts are insensitive for normality and the other charts can be modified to compensate the effect of sensitivity none of these charts take into account the measurement uncertainty and the consequence of the wrong decision. It is not enough to reduce the number of decision error type I or type II, the risk of the decision must be minimized. The method proposed in the next section gives a solution for these problems, it takes the decision errors of the estimation from samples (even in case of non-normality), the measurement error and the consequences of these decision errors into account. The Guide to the Expression of Uncertainty in Measurement (shortly GUM) (BIPM, et al., 1993) proposes methods to evaluate and express this uncertainty in a uniform way. However, GUM does not give any suggestions, how to decide about the conformity of a product or a process on the basis of uncertainty. Following the GUM many studies (Carbone, et al., 2003; Pendrill, 2006; Cox, et al., 2008) discussed this problem from a metrological aspect, focusing on the measuring instrument and calibration, and some dealt with the conformity decisions based on the measurement results (Forbes, 2006; Pendrill, 2008; Kosztyán, et al., 2010), but there was no solution to implement the measurement uncertainty handling in statistical control chart applications. Measurement uncertainty can be expressed in two ways (JCGM, 2008). On the one hand the measurement uncertainty can be expressed as a probability distribution of measurement results described by the value of standard deviation (standard uncertainty and combined standard uncertainty). On the other hand, the uncertainty can be described as an interval. The length of the interval calculated as a multiplication of the combined standard uncertainty and a k coverage factor. The value of k is determined by the confidence level and the type of the probability distribution function, but it is often specified as 2 or 3 (JCGM, 2008; Ellison & Williams, 2007; ILAC, 2009). This approach assumes the symmetry of the probability distribution, but this assumption is not valid in every case (Rossi & Crenna, 2006), that is why 2 different (KL and KU) values are used in this paper instead of a joint k and these new altered coverage factors were determined not by the reliability but by the risk of decisions (Figure 1). In this approach the risk-based modification of the statistical control chart limits is an equivalent solution (Hegedűs, et al., 2012).
y
y(t)
KU
KL
y(2) y(1)
U
L
t
Figure 1 – Decision-making of conformity based on measuring intervals instead of measuring points (left side) and the alteration of limits as an equivalent solution (right side)
2
Methods Because of the uncertainty at least four cases can be distinguished as a combination of real conformity and the decision itself (Table 1). If control is not required, but unnecessary control is done based on the measured value, decision error type I is made. If the real value of observed characteristic is nonconforming but it is undetected because of the measurement uncertainty decision error type II is made. Appropriate decisions are made if a non-conform process gets controlled or conform process runs. Table 1 – Profits influenced by the decisions and the actual state of the product or process Decision Control is not performed Control is performed (1) (0) Control is not π11=r11 - c11 π10=r10 - c10 required(1) Appropriate acceptance Superfluous control Fact Control is required π01=r01 - c01 π00=r00 - c00 (0) Inappropriate acceptance Appropriate control The cij costs, assigned to the 4 cases of decision outcomes, depend on the number of executed measurement, the cost of production and the actions in accordance with the decisions. In order to calculate the unrealized profit an alternative decision is made the rij revenues must also be taken into account beside the costs. So πij=rij-cij proportional profits are used to calculate the ∑Π total profit in reference to decisions.
∑ Π = q11 ⋅ π11 + q10 ⋅ π10 + q01 ⋅ π01 + q00 ⋅ π00
(1)
To maximize the expected profit let the decision rules be modified: the process will be treated as conform if LCL+KL ≤ y ≤ UCL-KU where KL and KU the correction components belong to the LCL and UCL lower and upper control limits. The value of correction components are calculated in the simulation. These correction components are not coefficients; they give directly the extent of the alteration of control limits. If the risk of decision error type II is low the value of correction component can be negative. In this case the control limits do not become stricter rather wider. Our Monte Carlo simulation searches the value of KL and KU that determines the maximum of total profit in reference to decisions. The estimated probability distributions of the real process [with cumulative distribution function F(x) or probability distribution function f(x)] and the measurement uncertainty [with G(m) or g(m)], the πij profits of each decision outcome, the number of the samples n and the sample size m are the input variables of the simulation. The LCL and UCL control limits are calculated variables. The simulation gives the qij numbers of elements falling in into each decision outcome case as a function of KL and KU, and the calculated sum of profits. From this data the maximal profit and KL* and KU* optimal correction components belonging to it can be determined. This approach does not require the normality of the probability distributions, because the correction components adjust all the estimation errors caused by the deviation from the normal distribution. The simulation allows us to fit multiple charts or chart combinations to the actual process and choose the one with the highest expected profit value. In addition, if the observed values drift or alter after the process control, and this alteration can be expressed as a function of the time or the measured value, it can be taken into account during the simulation with its regression function. The outcomes of decisions considering the measurement uncertainty, the alteration of observed values and regardless of them can be contrasted to each other.
3
Results The previously introduced method was tested on the statistical conformity control of aluminum alloy pivot bearings. This pivot bearing fixes the wheel bearing and all of the fittings directly connected to the wheel bearing in automobiles, this system connects the wheel to the suspension. One of the inspected parameter on this bearing is the deviation from the reference axis at the connection to the suspension. The target value is 0 with ± 0.7 mm tolerance. The initial inspection of the parameter showed that the probability distribution of the deviation from the reference axis can be estimated as a normal distribution with the mean =0.266 and standard deviation =0.1459. However, the statistical process control is performed before the heat treatment; the deviation parameter alters during the heat treatment and quenching (after the SPC). The connection between the parameters measured before and after the heat treatment is assumed multiplicative. The deformation – alteration of the deviation from the reference axis – is a stochastic variable that also follows normal distribution with the parameters def=1.03 and def=0.4. The measurement uncertainty of the positioning and measuring gauge have been estimated during the calibration and it is described with m=0 mean and m=0.0332 standard deviation. The profits or losses of the four outcomes of the decision are 11=4.5 ,= -9.75 , 01=-12.75 and 00=-8.25. Table 2 – The profit loss and its proportion that can be avoided by the consideration of uncertainty and risk in each case Profit loss Avoidable loss (% of ideal (% of original Chart Type decision) decision) Absence of Original decision 24.64 32.95 deformatio Considering measurement uncertainty and 16.52 X-bar risks decision 78.36 Presence of Original 83.6 Chart Considering the deformation and decision 12.85 deformatio Original decision, recalculated control 18.44 30.37 n Considering the deformation and decision 12.84 Absence of Original decision 24.37 30.41 Considering measurement uncertainty and 16.96 deformatio MArisks decision 84.54 Presence of Original 84.49 Chart Considering the deformation and decision 13.11 deformatio Original decision, recalculated control 18.47 29.18 n Considering the deformation and decision 13.08 Absence of Original decision 24.63 29.96 deformatio Considering measurement uncertainty and 17.25 EWMArisks decision 92.96 Presence of Original 85.69 Chart Considering the deformation and decision 13.3 deformatio Original decision, the recalculated control 18.16 28.85 n Considering the deformation and decision 12.92 Three cases have been studied: the absence of deformation after SPC, the presence of deformation without the recalculation of the control charts and the case when control limits are recalculated after the deformation. In every case three charts are examined with and without the consideration of measurement uncertainty and decision risks (Table 2). The ideal decision is defined in this example as the decision that evaluate all the observations properly, that is there is no decision error type I or type II. The value of avoidable loss gives the rate of the difference between the good and the actual decision that can be averted, through taking the measurement uncertainty, decision risk and parameter value alteration into consideration, with the modification of control limit by the correction components.
4
The design of X-bar Chart
The deformation is neglected in specification of LCL and UCL
NO
Are the uncertainties and risk considered?
Do we measure after the heat treatment?
NO
YES
NO
YES
The deformation is considered in specification of LCL and UCL
Are the uncertainties and risk considered?
YES
KL=KU=0
KL* and KU*
KL=KU=0
KL* and KU*
21.6%
87.15%
81.7%
87.16%
Figure 2 – Decision tree and results in percent of ideal decisions profit in design of x-bar control chart The results in the use of the three control charts are similar to each other. The instance of the application of x-bar chart in presence of deformation is shown on Figure 2. The first choice is about the schedule of the control, whether the control limits are specified before or after the heat treatment. After that we can decide to consider the measurement (and sampling) uncertainty, parameter drift and risk and determine optimal value of KL and KU or ignore them and not modify the control limits. All the results are profits in the percentage of the ideal decision, when no uncertainty perturbs the decision and no decision error is taken. The results appertain to the state of the pivot bearings after the heat treatment regardless the scheduling of the SPC in the production process. If the control is performed before the heat treatment lots of products become non-conform because of the drift of the observed parameter value, which reduces the profit to ideal’s 21.6%. Taking the uncertainties from measurement, sampling and parameter drift into account increase the profit up to 87.15%. Controlling the conformity after the heat treatment eliminates the effect of the drift, but the other uncertainties remain in the decision (81.7%). These remaining effects are reduced by the modification of the control limits with the optimal correction factors (87.16%).
5
Conclusion The results of the simulations and the studied case show that the reliability-centered approach in statistical conformity control can be enhanced by the consideration of consequences of decision errors and measurement uncertainty. The risk-based modification of control charts taking the measurement and sampling uncertainty into account increase the profit. The proposed method opposes the costs and revenues of decision outcomes to each other in order to minimize the total cost or maximize the total profit associated with the conformity control decisions. This method gives to decision-makers a tool that helps to determine the rules of sampling and conformity control. With the simulations we can choose the best fitting risk-based control chart, and the normality of the parameters’ probability distribution is not necessary. Modelling other uncertainties (e.g. drift of parameters after inspection) and implementing their handling into the control rules increase the profitability of the decision further. The preprocessing control with the proposed method gives the same result in the quality as the postprocessing quality control after the drift have appeared. The alteration of the parameter values can be predicted before they become non-conform, hence the superfluous processing of these products can be avoided.
Acknowledgements This paper was written as the part of project TÁMOP-4.2.2/B-10/1-2010-0025. The project is being co-financed by the European Social Fund with the support of the European Union.
6
References Besterfield, D. H., 1994. Quality Control. Engelwood Cliffs: Prentice Hall. BIPM, et al., 1993. Guide to the Expression of Uncertainty in Mesurement. Geneva: International Organisation for Standardisation. Carbone, P., Macii, D. & Petri, D., 2003. Measurement uncertainty and metrological confirmation in quality-oriented organizations. Measurement, Volume 34, pp. 263-271. Chase, R. B., Jacobs, F. R. & Aquilano, N. J., 2006. Operations Managements for Competitive Advantage. 11 ed. New York: McGraw-Hill/Irwin. Cox, M. G., Rossi, G. B., Harris, P. M. & Forbes, A., 2008. A probabilistic approach to the analysis of measurement processes. Metrologia, 45. kötet, pp. 493-502. Dale, B. G. & Shaw, P., 1987. Some problems in applying statistical process control. Quality Assurance, 12(1), pp. 14-17. Ellison, S. L. & Williams, A., 2007. Use of uncertainty information in compliance assessment (Eurachem/CITAC Guide), hely nélk.: Eurachem. Forbes, A. B., 2006. Measurement uncertainty and optimized conformance assessment. Measurement, Volume 39, pp. 808-814. Hegedűs, C., Kosztyán, Z. T. & Katona, A., 2012. Risk based enhancement of statistical control charts taking measurement uncertainty and shift of parameters into account. University of Barcelona, Spain, 3rd World Conference on Information Technology (Nov 14-16 2012). Heizer, J. & Render, B., 2011. Operations Management. Global Edition,Tenth ed. Upper Saddle River, NJ: Prentice Hall/Pearson. ILAC, 2009. Guidelines on reporting of compliance with specification (ILAC-G8:03/2009), Silverwater: ILAC. JCGM, 2008. Evaluation of measurement data - Guide to the expression of uncertainty in measurement, Paris: Joint Committee for Guides in Metrology. Kosztyán, Z. T., Csizmadia, T., Hegedűs, C. & Zoltán, K., 2010. Treating measurement uncertainty in complete conformity control system. In: T. Sobh, ed. Innovations and Advances in Computer Sciences and Engineering . s.l.:Springer Netherlands, pp. 79-84. Krajewski, L. J., Ritzman, L. P. & Malhotra, M. K., 2013. Operations management: processes and supply chains. Upper Saddle River, NJ: Prentice Hall. Massotte, P. & Bataille, R., 2000. Future production systems: Influence of self-organization on approaches to quality engineering. International Journal of Production Economics, 1 March, 64(1–3), pp. 359-377. Montgomery, D. C., 1996. Introduction to Statistical Quality Control. 3rd ed. s.l.:John Wiley & Sons. Pendrill, L. R., 2006. Optimised measurement uncertainty and decision-making when sampling by variables or by attribute. Measurement, Volume 39, pp. 829-840. Pendrill, L. R., 2008. Operating ‘cost’ characteristics in sampling by variable. Accreditation and Quality Assurance, 13. kötet, pp. 619-631. Rossi, G. B. & Crenna, F., 2006. A probalistic approach to measurement-based decision. Measurement, Volume 39, pp. 101-119. Russell, R. S. & Taylor, B. W., 2000. Operations Management. 3 ed. Upper Saddle River, NJ: Prentice Hall. Schilling, E. G. & Nelson, P. R., 1976. The Effect of Non-Normality on the Control Limits of X-charts. Journal of Quality Technology, 8(4), pp. 183-188. Schippers, W. A., 1998. Applicability of statistical process control techniques. International Journal of Production Economics, 20 September, Volume 56–57, pp. 525-535. Shewhart, W. A., 1931. Economic control of quality of manufactured product. New York: D Van Nostrand Company. Slack, N., Chambers, S. & Johnston, R., 2007. Operations Management. 5 ed. Essex: Prentice Hall. Thomas, M. A., 1987. The implementation and benefits of statistical process control. Quality Assurance, 13(1), pp. 10-13.
7