Memory & Cognition 2004, 32 (2), 260-270
Convex hull or crossing avoidance? Solution heuristics in the traveling salesperson problem JAMES N. MACGREGOR University of Victoria, Victoria, British Columbia, Canada EDWARD P. CHRONICLE University of Hawaii, Honolulu, Hawaii and THOMAS C. ORMEROD Lancaster University, Lancaster, England Untrained adults appear to have access to cognitive processes that allow them to perform well in the Euclidean version of the traveling salesperson problem (E-TSP). They do so despite the famous computational intractability of the problem, which stems from its combinatorial complexity. A current hypothesis is that humans’ good performance is based on following a strategy of connecting boundary points in order (the convex hull hypothesis). Recently, an alternative has been proposed, that performance is governed by a strategy of avoiding crossings. We examined the crossing avoidance hypothesis from the perspectives of its capacity to explain existing data, its theoretical adequacy, and its ability to explain the results of three new experiments. In Experiment 1, effects on the solution quality of number of points versus number of interior points were compared. In Experiment 2, the distributions of observed paths were compared with those predicted from the two hypotheses. In Experiment 3, figural effects were varied to induce crossings. The results of the experiments were more consistent with the convex hull than with the crossing avoidance hypothesis. Despite its simplicity and intuitive appeal, crossing avoidance does not provide a complete alternative to the convex hull hypothesis. Further elucidation of human strategies and heuristics for optimization problems such as the E-TSP will aid our understanding of how cognitive processes have adapted to the demands of combinatorial difficulty.
In the everyday world, the capacity of human beings to make optimal decisions may be constrained by lack of time, lack of information, and limited processing capacity (Simon, 1947). Indeed, circumstances frequently require that we react to complex situations with rapid decisions under uncertain and incomplete information. The fact that the decisions are often good, or at least satisfactory, has been a subject of continuing interest to cognitive psychology. One adaptive response to complex environmental demands appears to be that the cognitive system applies various simplifying heuristic procedures. For example, in the field of problem solving, heuristic search procedures, such as hill-climbing and means–ends analysis, have been recognized for some time (Newell & Simon, 1972). Various heuristic devices have also been identified in the area of probabilistic judgment and reasoning (Tversky & Kahneman, 1973). More recently, a number of simple cognitive algorithms for inferential reasoning that “satisfice” have been proposed (Gigerenzer & Goldstein, 1996). The authors thank Evan Heit, Iris van Rooij, and two anonymous reviewers for their helpful comments. Correspondence concerning this article should be addressed to J. N. MacGregor, School of Public Administration, University of Victoria, P. O. Box 1700 STN CSC, Victoria, BC, V8W 2Y2 Canada (e-mail:
[email protected]).
Copyright 2004 Psychonomic Society, Inc.
A potentially fertile source of complex problems for exploring the human capacity to find good, quick solutions is the field of combinatorial optimization, where many computationally intractable problems have now been identified. One problem from this field that has already attracted the interest of psychologists is the Euclidean traveling salesperson problem (E-TSP), described below. A reason for this interest is that people appear to be able to find optimal or near-optimal solutions to E-TSPs quickly and with little apparent effort (MacGregor & Ormerod, 1996; Vickers, Butavicius, Lee, & Medvedev, 2001). This ability of normal adults on E-TSPs has also suggested that it is a kind of task that may be useful in the context of neuropsychological testing (Basso, Bisiacchi, Cotelli, & Farinello, 2001; Vickers et al., 2001). An E-TSP consists of finding the shortest closed path (tour) that passes through each of a set of n points in the plane and returns to the start. Because the number of possible paths, given by (n 2 1)!/2, increases rapidly as n increases, finding the shortest path by exhaustive search of the problem space quickly becomes infeasible. For this reason, there has been a long-standing interest in the fields of computer science and operations research in devising approximate procedures that can construct near-optimal paths in reasonable times. An investigation of human
260
E-TSP: CONVEX HULL OR CROSSING AVOIDANCE? performance on E-TSPs reported that untrained adults, solving “by eye,” produced paths that were as good as, or better than, those produced by a number of such tour construction heuristics (MacGregor & Ormerod, 1996). This finding held across problems with sets of points from n 5 10 to n 5 60, the largest studied, and has been corroborated and extended by subsequent research (MacGregor, Ormerod, & Chronicle, 1999). The results suggest that people have available some effective heuristic procedures for finding short paths. As an explanation of these and related results, we proposed the convex hull hypothesis. The convex hull is the polygon formed by connecting the points that fall on the outermost boundary of the array of nodes that constitute an E-TSP. Our proposal was that human solutions are guided by this set of points (MacGregor & Ormerod, 1996; Ormerod & Chronicle, 1999). The essential notion is that the solution process begins by supposing that adjacent boundary points are connected by arcs (MacGregor, Ormerod, & Chronicle, 2000). The problem then simplifies to a series of decisions about which arcs to disconnect in order to “insert” interior points between them. This proposition has the double attraction of appealing, on the one hand, to general principles of human perception and, on the other, to effective heuristics that have been discovered in the area of operations research (Golden, Bodin, Doyle, & Stewart, 1980). Despite a broad base of empirical support, the convex hull hypothesis has not gone unchallenged (Graham, Joshi, & Pizlo, 2000; Lee & Vickers, 2000; Vickers et al., 2001). The most recent challenge has come in the form of the crossing avoidance hypothesis, which proposes that people construct tours that avoid crossing lines (van Rooij, Stege, & Schactman, 2003). Here, we examine this hypothesis in detail from several perspectives: first, its capacity to explain existing data; second, its theoretical adequacy and psychological plausibility; and third, how well it compares with the convex hull hypothesis in explaining the empirical results of three new experiments. Empirical Support for Crossing Avoidance Van Rooij et al. (2003) did not propose any psychological mechanism for crossing avoidance, nor did they suggest that it operates in isolation of other possible strategies. Nevertheless, in evaluating the hypothesis, it is worth examining how well a crossing avoidance strategy can explain existing empirical findings without additional assumptions. Consequently, in what follows, we will take a baseline approach and examine the crossing avoidance hypothesis in a pure form. We do not imply that this is what van Rooij et al. had in mind. As was noted above, a well-established empirical finding is that human solutions to E-TSPs are of a high quality. Consequently, a fundamental issue is whether a strategy of avoiding crossings will produce similarly high-quality solutions. There is no logical requirement that it must. Although it is true that the optimal solution has no crossings, it does not follow that a tour with no crossings will be optimal or, necessarily, close to opti-
261
mal. Some tours with crossings are longer than some without, and it is by no means a given that avoiding crossings automatically leads to good solutions. We addressed this issue by having an algorithm generate random solutions (with the constraint of no crossings) to instances of TSPs we had used in a previous experiment and compared the results with human solutions. The test used six 10-node instances, with numbers of interior points ranging from one to six (from MacGregor & Ormerod, 1996, Experiment 1). The algorithm produced 100 tours without crossings for each of the problems. The results are summarized in Table 1, which shows, for each of the six instances, the mean path lengths for (1) 100 no-crossing tours, (2) 45 subject-generated tours, and (3) 45 tours generated by our convex hull model (MacGregor et al., 2000). In all instances, the mean lengths of the paths produced by the crossing avoidance heuristic were significantly longer than those of the 45 experimental subjects (t values ranged from 6.47 to 18.53, df 5 143, all ps , .001). In the best case, crossing avoidance resulted in a mean path length that was 12% longer than the subjects’; in the worst case, it resulted in a mean that was 18% longer. In comparison, the best and the worst fits for our convex hull model were 0.5% and 3.4% shorter than the subjects’ means, respectively (MacGregor et al., 2000). A standard measure of problem difficulty, widely used in both operations research (Golden et al., 1980) and psychological studies (Graham et al., 2000; MacGregor et al., 1999; Vickers et al., 2001), is to express path lengths as a percentage above the optimal path length (PAO). By this metric, the average subject performance ranged from 0.8% to 3.8% above optimal across the six problems, the convex hull model ranged from 0% to 4.8%, and the crossing avoidance heuristic ranged from 14.6% to 21.4% above optimal. Clearly, simply avoiding crossings does not produce solutions that are as close to optimal as those of untrained adults or those of the convex hull approach. Theoretical basis and psychological plausibility of crossing avoidance. Mathematically, optimal tours follow the hull because optimal tours have no crossings. Because of this, van Rooij et al. (2003) argued that crossing avoidance is more elementary than following the convex hull. Although this is true mathematically, crossing avoidance may not be psychologically more elementary. In fact, van Rooij et al. provided little psychological support for the
Table 1 Mean Percentage Above Optimal for Euclidean Traveling Salesperson Problem Paths Produced by Crossing Avoidance, Human Subjects, and a Convex Hull Model Instance
Crossing Avoidance
People
Convex Hull
1 2 3 4 5 6
14.6 20.2 21.4 16.2 19.0 18.9
0.8 3.5 2.8 3.8 3.0 3.8
0.0 0.0 1.7 4.8 2.5 0.8
262
MACGREGOR, CHRONICLE, AND ORMEROD
hypothesis, other than that “it seems plausible to assume that people are, at least, sensitive to the fact that optimal tours have no crossings” (p. 217). People may be, but this sensitivity, by itself, is an inadequate basis for finding optimal or near-optimal tours, as has been illustrated above by the relatively poor performance of a crossing avoidance heuristic. It also raises the question of what psychological process or processes might underlie the production of tours without crossings. A possible process might be to plan tours mentally, reject any that result in a crossing, and repeat this until a noncrossing tour is found. There are at least two reasons that this approach is psychologically implausible. One is that tours without crossings are likely to be relatively scarce. Consider, for example, an instance with n points and no interior points. Here, there is only one closed path without crossings, but for n . 3, there are (n 2 1)!/2 2 1 paths with crossings. This differential frequency of tours with and without crossings becomes increasingly large as n increases. For example, with n 5 12, there are almost 20 million paths with crossings, as compared with only one without. With sufficiently large n, the relative sparseness of noncrossing tours would make an unguided search of the solution space an unworkable strategy. A second problem with the unguided search approach arises because of the limitations of mental lookahead, the capacity to plan one or more moves ahead. Research in other areas of problem solving has suggested that this capacity may be quite limited (MacGregor, Ormerod, & Chronicle, 2001; Phillips, Wynn, McPherson, & Gilhooly, 2001). In the case of E-TSPs, it has been reported that normal subjects plan a small section of the route before the first move and then program their moves during execution, exhibiting a constant degree of planning in the process (Basso et al., 2001). This result suggests that a small moving window of mental lookahead is applied during the solution process. In contrast, since a crossing can occur on any connection up to the nth, it appears that a minimum lookahead of n connections would be required to guarantee crossing avoidance. Given both of these processing capacity issues, of search space and lookahead, it seems likely that for people to avoid crossings, they must have available some heuristic procedure that aids them in doing so, without requiring excessively broad or deep searches. One extremely effective heuristic that reduces crossings is the convex hull approach we favor, although we do not propose that people use the boundary points as a guide intentionally to avoid crossings. Nevertheless, despite the potential difficulties of specifying a process for crossing avoidance, the simplicity of the proposal demands that it be examined closely. For this reason, we conducted three experiments designed to examine the crossing avoidance hypothesis and contrast it to the convex hull hypothesis. EXPERIMENT 1 A prediction from the convex hull hypothesis is that the relative difficulty of E-TSPs will be a direct function
of the number of interior nodes, rather than the total number of nodes (MacGregor & Ormerod, 1996). This prediction arises because the hypothesis holds that the hull points are essentially given, in that they form the perceptual boundary of the array, leaving the person free to focus on how to connect the interior points. Adding to the number of boundary points should, therefore, add little or nothing to the psychological complexity of the task. In MacGregor and Ormerod (1996), this prediction was tested in two experiments in which the total number of points was held constant (at n 5 10 and n 5 20 for Experiments 1 and 2, respectively) and the number of interior points varied. In both cases, problem complexity, measured by the uncertainty of solution paths across subjects, was found to vary directly with increasing numbers of interior points. In addition, a reanalysis of existing data with E-TSPs ranging from 10 to 60 nodes showed that number of interior points correlated significantly with problem difficulty measured by the mean path length of the 50 subjects, expressed as PAO (MacGregor & Ormerod, 1996). Lee and Vickers (2000) questioned the meaningfulness of the distinction between total and interior points, claiming that they were “diagnostically equivalent.” In a reply, MacGregor and Ormerod (2000) pointed out that it was possible to vary total points and number of interior points orthogonally, although at that time no single experiment had done so. Subsequently, such an experiment was reported (Vickers et al., 2001). Unfortunately, the way in which number of interior points was manipulated made the relevant results uninterpretable. Specifically, for each of three levels of total points (n 5 10, 25, and 40), two levels of number of interior points were defined, high and low. Across the three levels of total points, problems in the high interior points condition had 5, 18, and 32 interior points. The low interior points condition had 3, 16, and 28 interior points. The resulting overlap between conditions was extreme, with instances in the low interior points condition having five times as many interior points as instances in the high interior points condition. Even if we were to interpret interior points as a proportion of total points (rather than as the absolute number), the same problem remains. Consequently, the experiment did not manipulate number of interior points in a clear and systematic way, and the results regarding the effect of interior points are uninterpretable. At this point in time, it is not clear whether the difficulty of E-TSPs varies only with the number of interior points or with both the number of interior points and the total number or whether the two factors interact in some way. The convex hull hypothesis makes the strong prediction that there will be an effect of interior points but no independent effect of total points (since the total points that are not interior points are, therefore, boundary points and their connection order is held to be a psychological given). For the same reason, the convex hull approach predicts no interaction effect. The crossing avoidance hypothesis, since it makes no distinction in the status of boundary versus interior points, would have no basis for making a
E-TSP: CONVEX HULL OR CROSSING AVOIDANCE? similar prediction. In fact, as was outlined in the introduction, the psychological difficulty of avoiding crossings presumably increases as some function of the number of potential crossings to be avoided, which in turn will vary with n. Consequently, a strict crossing avoidance hypothesis would appear to predict only a main effect of total points. However, observing such an effect will depend on the dependent variable used to measure problem difficulty, as will be discussed below. In previous studies, a number of measures of problem difficulty have been used, including the proportion of optimal tours (Graham et al., 2000; MacGregor et al., 1999), the variety of different solutions across subjects (MacGregor & Ormerod, 1996), response point uncertainty (RPU), which reflects the relative frequency with which subjects’ paths incorporate the same point-topoint connections (MacGregor & Ormerod, 1996; Vickers et al., 2001), and path length expressed as PAO (Graham et al., 2000; MacGregor & Ormerod, 1996; Vickers et al., 2001). Normally, these measures will be correlated. For example, the simplest problem used by MacGregor and Ormerod (1996) had one interior point. In this case, most subjects found the optimal solution, resulting in a high proportion of optimal tours, a low variety of different tours, low RPU, and low PAO. The most difficult problem had 16 interior points. In this case, no subject found the optimal solution, resulting in the lowest possible proportion of optimal tours and a necessarily higher PAO. The subjects produced a wider variety of different tours, resulting also in a higher RPU. In previous experiments, we measured the effect of number of interior points by the variety of different paths produced across subjects, expressed as RPU. With few interior points, people tended to produce the same or similar paths. With more interior points, the paths they produced tended to diverge. However, a problem arises in using this measure in the present case to distinguish between the convex hull and the crossing avoidance hypotheses, for the following reason. It is a mathematical fact that avoiding crossings means that boundary points are connected in sequential order of adjacency. Thus, a successful crossing avoidance strategy will result in tours with virtually no uncertainty about the order of connection of boundary points, and therefore, RPU will tend to vary only with the number of interior points. In other words, the two hypotheses predict the same outcome. Note, however, that they differ in terms of the potential demands on processing capacity. In the case of the convex hull hypothesis, boundary points impose no or little processing load. In the case of a strict crossing avoidance hypothesis, there is no reason why boundary points should impose lower processing demands than do interior points, unless additional assumptions are introduced. An alternative measure to RPU is the length of path produced, expressed as PAO. From the perspective of the convex hull hypothesis, the decision-making load in E-TSPs is concentrated on connecting the interior points. The more interior points there are, the more options have
263
to be considered and, other factors being equal, the more frequently nonoptimal decisions will occur. Consequently, PAO should increase as the number of interior points increases. From the perspective of crossing avoidance, unless other mechanisms are introduced, the number of decisions will increase as the total number of nodes increases. From this perspective, the more nodes there are, the more choices there are to be considered in a limited time period, and the more nonoptimal choices will occur. Consequently, PAO should increase as the total number of nodes increases, not the number of interior nodes. Method
Subjects. Twenty-seven graduate and undergraduate students from Lancaster University were tested in an individual setting. Materials. The materials were four E-TSPs with 40 points (two with 5 interior points and two with 15) and four E-TSPs with 20 points (two each with 5 and 15 interior points). Each problem was laser printed on a separate A4 sheet. The 40-point problems were created in the following way. The h points on the hull (h 5 either 25 or 35) were generated by randomly sampling an angle from 0º to 359º. If any angle was within 360/2h degrees of one previously selected, it was resampled. Angles were converted to radians and were plotted at 80 units from the center of the sheet. For the m interior points, the same procedure was followed, except that points were plotted at a random distance that was from 0 to 60 units from the center. (This ensured that no interior points were close to the hull, since points close to the hull may effectively act like hull points.) Each of the four 40-point problems was used to create an equivalent 20-point problem by randomly deleting 20 points from the hull (with the constraint that no point that was previously an interior point became a boundary point). The result was that each 20- and 40-point pair had an identical arrangement of interior points. The four 40-point problems were combined into booklets, as were the 20-point problems. The order of problems within booklets was counterbalanced. Procedure. The subjects were randomly assigned to either a 40-point or a 20-point condition. The nature of the task was briefly introduced, and the subjects were instructed to start from any point and to connect the points in the shortest path, so that each point was visited once and once only, before returning to the start. The subjects were asked to circle their starting point and indicate the direction of travel of the path. A time limit of 2 min per problem was imposed.
Results and Discussion Initially, there were 14 subjects in the 20-point condition and 13 in the 40-point condition. Subsequently, 2 were excluded from the former and 4 from the latter condition for producing incomplete or ambiguous paths. Six of the remaining 12 subjects in the 20-point condition and 5 of the 9 in the 40-point condition were male. Path lengths. For each instance, the subjects’ path lengths were calculated and transformed into a PAO. (In 3 of the 40 node instances, we were unable to find a guaranteed shortest path. In these cases, we used the lower bound—the shortest length possible for the optimal path.) Within each of the total points conditions, there were two examples of the interior points conditions. For each subject, the average score across these two examples was computed, yielding a single score for each subject on the 5 interior point problems and on the 15 interior point
264
MACGREGOR, CHRONICLE, AND ORMEROD
problems. The resulting mean PAOs for the 20-point problems were 5.82 (SD 5 4.08) and 12.20 (SD 5 8.67) for the 5 and 15 interior point problems, respectively. The corresponding results for the 40-point problems were 5.36 (SD 5 3.37) and 8.18 (SD 5 10.09). The results were analyzed using an analysis of variance, with total points as a between-subjects factor and number of interior points as a within-subjects factor. There was a significant main effect of interior points [F(1,19) 5 6.73, MSe 5 0.003, p , .02]. The direction of the findings indicated that the quality of the subjects’ tours decreased significantly as the number of interior points increased. The main effect of total points was not significant [F(1,19) 5 0.75, MSe 5 0.007], nor was the interaction effect significant [F(1,19) 5 1.01, MSe 5 0.003]. The results supported the prediction from the convex hull hypothesis, that the number of interior points, and not the total number of points, is a main source of problem difficulty. On the other hand, it is not clear how the crossing avoidance hypothesis could explain the results without introducing additional assumptions. Indentations. A descriptive characteristic of tours is the number of indentations they exhibit. (An indentation occurs whenever interior points are connected between adjacent boundary points.) Previously, we reported evidence that people’s tours tend to have fewer indentations than would be expected by chance (MacGregor & Ormerod, 1996). We examined the present results for similar tendencies. Of the 84 subject tours, 49 (58%) had only one indentation, the minimum possible. In these cases, the path passed through each adjacent boundary point, except for the “gap” that accommodated the interior points. For the four stimuli with 5 interior points, the expected number of indentations by chance was 3. In contrast, the mean number for the subjects’ tours ranged from 1.08 to 1.83. For all four stimuli with 5 interior points, the mean number of indentations was significantly lower than would be expected by chance (all ps , .01, by one-sample t tests). Similar results obtained for the four instances with 15 interior points. For these, the expected number of indentations by chance was 8, whereas the observed means were in all cases significantly lower, ranging from 1.33 to 3.00. Van Rooij et al. (2003) have argued that because the optimal tours of MacGregor and Ormerod (1996) had few indentations, the finding that subjects’ tours have few indentations “follows directly from the close to optimal performance by participants” (p. 217). However, although this would have been true for optimal performance, there is no reason why it should also be true for “close to optimal” tours, since there is no necessity that close-tooptimal tours will have the same number of indentations as the optimal. Nevertheless, here we tested whether the mean number of indentations of the subjects’ tours was lower than the mean for the optimal tours. In doing so, we excluded tours in which the optimal had only one indentation. We also excluded subject tours that were optimal, since, by necessity, those would have the same
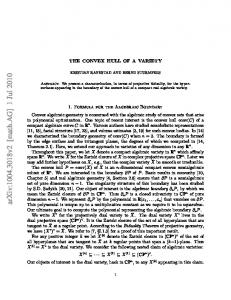
number of indentations as the optimal. For the four optimal tours with more than one indentation, the mean number of indentations was 2.5. The corresponding mean for the subjects’ tours, 2.19, was significantly lower, by a onesample t test [t(42) 5 22.46, p , .02]. Thus, the observed number of indentations not only was significantly lower than those of chance tours, but also was significantly lower than those of optimal tours. The result suggests that the low number of indentations is not an artifact, as was proposed by van Rooij et al., but arises from the process by which tours are generated. A possible criticism of the present experiment concerns the artificial nature of the stimuli it employed. In particular, the method of generating stimuli and the large number of boundary points gave many of the present stimuli an overall circular appearance. This may have influenced performance, a possibility previously voiced by Lee and Vickers (2000). If the circular appearance of the outlines influenced performances in this case, it would be reasonable to expect that responses would vary systematically with an increasing degree of circularity. This would be determined by the number of points on the boundary. In these terms, the most circular stimuli were those with 35 boundary points (40 total, 5 interior), followed by 25 (40 points, 15 interior) and then 15 (20 total, 5 interior), with the least circular having 5 boundary points (20 total, 15 interior). If perceived circularity drives performance, the quality of the tours should decrease in this order. It did not. In terms of the analysis reported earlier, this would predict a main effect of total points, with the 40-point problems being superior to the 20-point problems, as well as a main effect of interior points. The complete absence of any main effect of total points argues against such an interpretation. EXPERIMENT 2 The first experiment contrasted conditions in which the convex hull hypothesis made a strong prediction about the effect of interior points and the crossing avoidance hypothesis made no clear prediction. In the second experiment, we sought to create conditions in which the two hypotheses made contrasting predictions. To do so, the experiment used E-TSPs with a single interior point. Two such TSPs were used in the experiment, one in which the single point was positioned equidistant from each of the boundary points and one in which it was slightly offset by 13 mm, approximately 10% of the diameter of the figure. The instances are shown in Figure 1, together with the optimal paths. Predictions Strict crossing avoidance. A strict interpretation of the crossing avoidance hypothesis is that it is the necessary and sufficient explanation of performance on E-TSPs. Each of the instances shown in Figure 1 has nine solutions that avoid crossings. If human solutions are guided solely by a strategy of avoiding crossings, each of the
E-TSP: CONVEX HULL OR CROSSING AVOIDANCE?
Figure 1. The Euclidean traveling salesperson problems used for the offset point (upper panel) and the center point (lower panel) conditions in Experiment 2.
nine possible solutions should be generated with approximately equal frequency. Modified crossing avoidance. A less extreme interpretation of the crossing avoidance position would be to assume that when given more than one option that avoids crossings, people will select what appears to be the shortest. One simple way to implement this would be to combine crossing avoidance with a nearest neighbor heuristic. This could be done, for example, by assuming, that a starting point is selected at random from the 10 points, a connection is made from this to the nearest point that does not cause a crossing, and this is repeated until the path closes. Applying this heuristic to the offset interior point instance results in the following set of outcomes.
265
Of the nine noncrossing paths, one (the optimal) results from 3 of the 10 starting points. It, therefore, has a frequency of 30%. Of the remaining possible paths, two occur at a frequency of 20%, three at a frequency of 10%, and three at 0%. A modified prediction is, therefore, that the observed frequencies of each possible solution will be proportional to these theoretical frequencies. (We note that a heuristic similar to this has been proposed in Vickers, Lee, Dry, & Hughes, 2003.) For the center interior point instance, the modified version of the crossing avoidance predicts something closer to an equiprobable distribution. Because every point on the boundary is nearer to an adjacent boundary point than it is to the center point, any boundary start will lead the path around the hull until there is no option remaining but to connect to the interior point. When the center is selected as the start point, the connection should be made with equal likelihood to any of the boundary points. Thereafter, the path will move in the direction of the closest point and will continue in that direction. Overall, these principles result in three solutions that have a predicted frequency of 22.2%, three with a frequency of 11.1%, and three with a frequency of 0%. Convex hull. From the perspective of the convex hull hypothesis, an E-TSP with one interior point reduces to a decision about which two adjacent points on the hull to connect to the interior point. The criterion for this decision most consistent with human performance is that of cheapest insertion (MacGregor et al., 2000). In the present context, cheapest insertion means connecting the interior point to the two boundary points that will add least to the current path length. The resulting increment in path length is given by the sum of the distances of the interior point to each of the boundary points minus the distance between the two boundary points. A strict application of this rule leads to the prediction that all solutions will conform to the paths illustrated in Figure 1, which are the optimal solutions. However, this requires that people operate with perfect information about the distances between points. A more realistic prediction, recognizing that there will be some error associated with distance judgments, is that the frequency of selection of possible solution paths will be a decreasing monotonic function of the incremental distances associated with them. Method
Subjects. The subjects were 117 undergraduate students at Lancaster University. Materials. The materials consisted of the E-TSPs shown in Figure 1, centered on A4 paper and laser printed in black on white. The points were approximately 2 mm in diameter, and the diameter of the roughly circular array of points forming the E-TSPs was about 127 mm. Procedure. Testing was conducted in a group setting. The subjects were randomly assigned to the two conditions, resulting in 57 participants in the center point condition and 60 in the offset condition. The problem was briefly introduced, and they were instructed to start from any point and to connect the points in the shortest path, so that each point was visited once and once only, be-
266
MACGREGOR, CHRONICLE, AND ORMEROD
fore returning to the start. No time limit was imposed, but in practice, all the subjects completed the task within 2 min.
Results and Discussion Nine subjects failed to follow the problem instructions and were excluded from further analysis, 2 from the center condition and 7 from the offset condition. Of the remaining 108, 3 subjects produced solutions with crossings (2.9%). Since our interest here was in the relative frequency of the nine possible noncrossing solutions, these three solution paths were also excluded from subsequent analyses. This left 105 paths for analysis, 53 for the center point TSP and 52 for the offset. The results of primary interest were the frequencies of the different noncrossing solution paths. These are shown in Table 2, together with information relating to the predictions. The left half of the table provides the results for the offset condition; the right half provides the corresponding results for the center condition. Within each half of the table, the first column shows the nine possible noncrossing paths, expressed as the adjacent boundary points between which the interior point is inserted. The second column shows the observed frequency of occurrence of each path. The third column gives the increment in path length associated with that choice, and the fourth, gives the relative frequency of that path predicted by the modified crossing avoidance heuristic. Since, for both conditions, the nine paths in the table are those that avoid crossings, a strict interpretation of the crossing avoidance hypothesis would predict that all nine should be selected with equal frequency. The results did not support this prediction for either condition. For the offset condition, the hypothesis of equidistribution was rejected beyond the .001 level of significance [c2(8, N 5 52) 5 83.83]. A similar result was obtained for the center condition [c2(8, N 5 53) 5 118.56, p , .001]. The modified version of the crossing avoidance hypothesis predicted that the frequency of path selection for the offset condition should be directly proportional to
the values shown in the fourth column of Table 2. The correlation of these values with the observed frequencies shown in column 2 of the table was r 5 .47. Although it was in the predicted direction, the correlation failed to reach significance. A similar result was obtained for the center condition, where r 5 .41. To increase statistical power, the results were combined across both conditions, resulting in r 5 .43, which approached statistical significance ( p 5 .07). The convex hull hypothesis predicted that the observed frequency of selection of paths would be a decreasing monotonic function of the associated incremental path lengths, shown in Table 2. This prediction was strongly supported for both the offset and the center point conditions. For the offset condition, a negative exponential function of incremental path length accounted for 92% of the variance in the observed frequency of path selection [F(2,6) 5 66.83, p , .001]. For the center condition, incremental path length accounted for 93% of the variance in path selection [F(2,6) 5 74.26, p , .001]. The experiment provided strong evidence against a strict crossing avoidance explanation of performance on E-TSPs. Following a strategy that simply avoids crossings, even if a feasible process for such a strategy could be implemented, does not appear to be sufficient to account for the wide variation in the frequency with which noncrossing paths were generated. Supplementing crossing avoidance with a nearest neighbor decision rule improved the fit somewhat. In this case, the correlation was positive between the predicted and the observed frequencies of solution paths, although still not significant. By combining the data across the experimental conditions, the result approached significance. However, it accounted for less than 20% of the variance in observed frequencies, as compared with over 90% for the convex hull approach. It is conceivable that by adding additional mechanisms, a suitably elaborated form of the modified version might do better. However, at this point, it appears that to the extent that crossing avoidance guides human
Table 2 Observed Frequencies of the Nine Noncrossing Solutions for the Offset and Central Conditions of Experiment 2, Together With the Associated Increm ental Path Lengths and Predicted Relative Frequencies Under a Modified Crossing Avoidance (C-A) Hypothesis Offset Interior Point
Central Interior Point
Path
Observed Frequency
Increment in Path Length
Modified C-A Frequency
3–4 2–3 9–1 1–2 4–5 5–6 6–7 7–8 8–9
22 14 8 7 1 0 0 0 0
57.83 60.00 78.70 70.19 83.79 82.66 114.01 117.34 114.79
.3 .0 .2 .1 .0 .2 .0 .1 .1
Path
Observed Frequency
Increment in Path Length
Modified C-A Frequency
9–1 1–2 6–7 5–6 2–3 8–9 3–4 4–5 7–8
29 11 4 3 2 2 1 1 0
64.51 76.03 97.39 79.99 81.10 90.01 80.04 96.48 93.95
.222 .111 .000 .222 .000 .111 .222 .000 .111
E-TSP: CONVEX HULL OR CROSSING AVOIDANCE? performance, it must do so in consort with other, unknown mechanisms. On the other hand, the results observed here are consistent with the convex hull approach. EXPERIMENT 3 In the first two experiments, most of the paths generated by the subjects connected adjacent boundary points in order and exhibited no crossed lines. This is consistent with previous findings. In the next experiment, we tried to distinguish between the convex hull and the crossing avoidance hypotheses by inducing paths that contravened both principles. The convex hull hypothesis proposes that boundary formation is fundamental to human E-TSP solution. However, we recognize that it is not the only Gestalt factor involved. Other figural effects have been observed, including grouping by proximity and regularity (MacGregor & Ormerod, 1996; MacGregor et al., 1999). This raises the possibility that the relative salience of the convex hull could be varied by changes in other figural factors. If boundary perception is critical to E-TSP performance, as the convex hull hypothesis proposes, a manipulation of boundary salience should influence E-TSP performance. Similarly, if crossing avoidance is subject to figural effects, it may be possible to induce crossings by manipulating other factors. To test
267
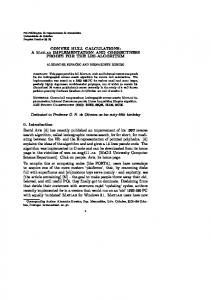
this, we used the stimuli shown in Figure 2, modified from an example suggested previously (MacGregor & Ormerod, 1996, Figure 5). The annotation of some points as shown in the lower figure was not present in the stimuli given to the subjects. In both of the instances in Figure 2, the principle of good continuation invites a solution path that will ultimately result in a crossing. One question is whether people apply enough lookahead to foresee this and take the steps necessary to avoid it. There is also a difference between the two instances. Although there are an equal number of boundary points in each case, the convex hull is somewhat more salient in the lower instance, because of the relative positioning of the boundary points. The expectancy is, therefore, that although there are likely to be more crossings in both instances than is usual in E-TSPs, this tendency will be greater in the upper instance, where the effects of the convex hull will be weaker. On the other hand, neither the strict nor the modified crossing avoidance hypothesis appears to have any basis for predicting a difference between the instances. Furthermore, if crossing avoidance “follows directly from a very basic and visually-transparent property of the Euclidean plane; that is, the shortest path between two points is a straight line” (van Rooij et al., 2003, p. 218), there is perhaps no reason to expect the incidence of crossings to be any greater than that in previous research. If so, a large majority of tours should avoid crossings in both conditions. Method
Subjects. The subjects were the same as those in Experiment 2. Materials. The materials consisted of the E-TSPs shown in Figure 2, centered on A4 paper. The points were approximately 2 mm in diameter, and the horizontal extent of the problem from the leftmost to the rightmost point was approximately 127 mm. Procedure. The procedure was conducted immediately following the previous experiment, with the subjects first completing the instance for Experiment 2, followed by the present instance. The subjects were randomly assigned to either the low-salience or the high-salience condition (shown by the upper and lower panels of Figure 2, respectively), resulting in 58 in the former condition and 59 in the latter. This was done in such a way as to counterbalance any effects of Experiment 2. That is, 30 of the subjects in the lowsalience condition had been in the offset condition for Experiment 2, whereas 28 had been in the center condition. Similarly, in the high-salience condition, 30 had been in the offset condition and 28 in the center condition. The instructions were identical to those in Experiment 2, with the exception that the subjects were instructed to start from the unfilled point and to connect the points in the shortest path, so that each point was visited once and once only, before returning to the start. No time limit was imposed, but in practice, problems were completed within 2 min.
Figure 2. The Euclidean traveling salesperson problems used for the low-salience (upper panel) and the high-salience (lower panel) conditions in Experiment 3. Points annotated A, B, C, and D are referred to in the text.
Results and Discussion Sixteen subjects failed to follow the problem instructions and were excluded from further analysis, leaving 50 in the low-salience and 51 in the high-salience conditions. The results of primary interest were the proportion of solutions that followed the convex hull or that resulted in crossings in the two conditions. For the low-salience condition, the number following the hull was 26 (52%),
268
MACGREGOR, CHRONICLE, AND ORMEROD
and the number of crossings was 24 (48%). For the highsalience condition, the corresponding results were 38 (75%) and 13 (25%). The difference in the proportion of crossings between the two conditions was highly significant in the predicted direction [c 2(1, N 5 101) 5 15.43, p , .001]. Overall, the incidence of crossings was 37 (37%), which was substantially greater than any observed previously. Van Rooij et al. (2003) reported an overall incidence of 6%. By basing the expected frequency on this value, the frequency observed here was significantly greater than would be expected on the basis of previous results [c 2(1, N 5 101) 5 153.87, p , .001]. The experiment provided further evidence consistent with the convex hull hypothesis, by demonstrating that the incidence of crossings induced by the manipulation varied inversely with the salience of a figure’s boundary. Thus, although the principle of good continuation induced crossings in both conditions, it did so to a lesser extent in the condition in which the boundary was more salient. Nevertheless, the fact that good continuation influenced tours provided additional evidence of the potential importance of perceptual factors in the solution process. We should mention two potential reservations about the results. The first concerns the procedure, which involved the same subjects as those in Experiment 2. However, it is not unusual for people to complete more than one E-TSP during an experimental session, and in fact, it appears to be the norm. Previously, we have found no effects of order (MacGregor & Ormerod, 1996). We intentionally used the present order of presentation to ensure that most of the subjects would have the experience of producing paths without crossings before they participated in the procedure in which we attempted to induce crossings. Thus, if order were to have any effect in the present case, it would be more likely to go against the experimental hypothesis than to support it. A second potential reservation concerns a possible alternative explanation for the observed differences between the two conditions. It might be argued that in the high-salience condition, the proximity of the boundary point, D, to the curve implied by good continuation at Points A, B, and C weakened the effects of good continuation, thereby creating the difference (see Figure 2). However, it is important to note that Points A and B and Points B and C are much closer to each other than they are to Point D. Thus, in both experimental conditions, the principles of good continuation and proximity favored following the curve through A, B, and C, rather than following the boundary through D. GENERAL DISCUSSIO N In previous studies, we have developed a convex hull hypothesis to explain human performance on the E-TSP, a classic problem in combinatorial optimization (MacGregor & Ormerod, 1996; MacGregor et al., 1999, 2000;
Ormerod & Chronicle, 1999). An alternative explanation, based on crossing avoidance, has recently been proposed by van Rooij et al. (2003). The crossing avoidance proposal is attractive, both for its simplicity and for its intuitive appeal. We therefore examined the hypothesis closely from the perspectives of its capacity to explain existing data, its theoretical adequacy, and how well it compared with the convex hull hypothesis in three new experiments. Throughout, we restricted examination to a parsimonious form of crossing avoidance, unsupported by additional assumptions. In doing so, we do not imply that this is what van Rooij et al. had or have in mind as a process model. An important finding to be explained is that adults can readily produce good E-TSP solutions. Because this aspect of performance was not addressed by van Rooij et al. (2003), we compared a crossing avoidance heuristic with previous performance data. The resulting solutions compared poorly with those of experimental subjects. A second limitation appears when considering how crossing avoidance might operate as a process. Statistically, solutions without crossings are likely to be relatively rare, as compared with those with crossings, and may be difficult to discover through an unguided search process. What seems to be required is a heuristic that will avoid or, at least, limit crossings without an extensive search. The convex hull hypothesis provides such a heuristic. In addition, the results of three new experiments lent no support to the crossing avoidance hypothesis as a process account of performance on E-TSPs. The first experiment tested a prediction from the convex hull hypothesis, that performance is a function of the number of interior points, not total points. The results showed a significant main effect of interior points. Since the pure crossing avoidance view makes no distinction between boundary and interior points in terms of processing, it is difficult to see how it could explain the finding. On the other hand, since difficulty of avoiding crossings presumably increases with increases in the number of crossings to be avoided, it might be expected that difficulty would increase with increases in the total number of points. There were no effects of total number of points. In the second experiment, two E-TSPs were used, each with nine possible solutions without crossings. If crossing avoidance were the only strategy, each of the nine solutions should occur with equal frequency. For both instances, the observed distributions differed significantly from this expectation. The third experiment manipulated figural factors in two E-TSPs in an attempt to induce line crossings. This was successful, with crossings appearing in 37% of the solutions, as compared with a base rate of 6% from previous studies. The frequency of crossings was significantly lower for the instance in which the convex hull was more salient. Nevertheless, although the results of this and the other experiments reported here are difficult to reconcile with
E-TSP: CONVEX HULL OR CROSSING AVOIDANCE? an account of human performance on E-TSPs that relies on pure crossing avoidance, it seems very reasonable that people will, at the level of local decisions, make choices in which crossings are avoided. This is supported by some further analysis of the data from Experiment 1 of those tours that exhibited crossings. Of the total of 84 tours, 13 exhibited crossed arcs (15%). This is within the range of 2% –19% reported for previous studies (van Rooij et al., 2003). Of these 13 paths with crossings, 10 (77%) connected boundary points in order of adjacency, consistent with the convex hull hypothesis. This is within the wide range, previously reported, of 0% –83%. Of interest is the way that crossings came about. For these 10 tours, crossed arcs came about in one of two ways. In half of the cases, the subjects started on an interior point and connected all of the interior points before reaching a boundary point. On reaching the boundary, they immediately chose a direction of travel that determined that a crossing must eventually occur. That is, on reaching the boundary, they turned the wrong way. From this point, they followed the boundary points in order of adjacency. With all boundary points connected, the last step closed the path, at which point the crossing took place. In the remaining half of these 10 cases, the subjects worked in the opposite way. That is, the path began with a boundary point and connected all boundary points in order of adjacency, before moving to the interior. Then, in the course of connecting the interior points, a decision was taken that made a crossing inevitable. Finally, the three cases of crossings in which boundary points were not connected in order of adjacency all followed the same pattern, in which the path proceeded from a boundary point through a series of interior points, to emerge at a boundary point on the opposite side of the array. This resulted in the connection of nonadjacent boundary points, making an eventual crossing inevitable. Although all paths with crossings are obviously inconsistent with the crossing avoidance hypothesis, the results nevertheless provided some interesting evidence that could be interpreted as supportive. Specifically, in all 13 cases of crossings, the majority of the subjects deferred the crossing for as long as possible. That is, in 11 of the 13 instances with crossings, the crossing occurred on the final line drawn, even though it was determined at a much earlier point. For the 20 node problems, for example, crossings became inevitable on line 8.3, on average, but did not occur until line 19.6, on average. For the three crossings that occurred on 40-point instances, the equivalent values were 25 and 40, on average. For the first 5 cases described above, this apparent deferral of crossings could have been a result of a strategy of connecting boundary points in order. However, in the remaining cases, it may be evidence for a local heuristic in which crossings were avoided until no degrees of freedom remained. The result is consistent with the interpretation that, in addition to following the convex hull, people have available a heuristic for avoiding crossings when connecting interior points.
269
It seems apparent from the foregoing that considerable research remains to be done in specifying the range of heuristics, and the strategic implementation of those heuristics, that can account for human performance in all instances of E-TSPs. Nonetheless, it is our view, supported by converging experimental evidence, that the convex hull heuristic has considerable explanatory power. The utility of this heuristic may be explainable by a connection between the visual properties of E-TSPs and the capability of the human visual system to discriminate the boundaries of objects from their backgrounds. In this respect, detecting the shortest closed path may be consistent with the computational approach to vision, which takes the perspective that reconstructing environmental structure from visual input involves generating approximately optimal solutions to a series of computational problems (Marr, 1982). The E-TSP represents only one example of a class of optimization problems that is beginning to attract the interest of psychologists. Brusco (2001) studied performance on the p-median problem, an NP-complete distribution problem, and found that people were capable of generating optimal and near-optimal solutions. Vickers, Mayo, Heitman, Lee, and Hughes (2004) compared performance on three different computationally intractable or difficult optimization tasks: E-TSP, minimal spanning tree, and generalized Steiner tree problems. For all three types of problems, average performance was close to optimal. In addition, performance scores across problem type were correlated and were correlated with scores on Raven’s advanced progressive matrices. They proposed that there is a close relationship between intelligence and optimization performance. It has also been proposed that performance on optimization tasks may be useful in identifying impaired cognitive functioning in the context of neuropsychological testing (Basso et al., 2001; Vickers et al., 2001). Whether or not it demands an evolutionary perspective, the capacity of people to quickly find optimal or very good solutions to complex problems is an issue of wide interest in current cognitive psychology. Cognitive responses have been shown to approximate optimal decisions in a wide variety of contexts, including reasoning (Oaksford & Chater, 1994), classification (Nosofsky, 1998), and memory (Anderson & Schooler, 1991). Thanks to Simon (1947), cognitive psychology has long recognized that human behavior occurs under conditions of bounded rationality and that we do not have the time, the information, or the cognitive processing capacity to derive proven optimal answers. Nevertheless, by adopting heuristics that merely “satisfice,” remarkably accurate decisions may be made (Gigerenzer & Goldstein, 1996). The latter authors asked, “What are these simple, intelligent algorithms capable of making near-optimal inferences?” (p. 651). In the present article, we have attempted to answer this question in a specific context. We suggest that, more generally, optimization problem solving may provide a useful set of tasks with which to further explore the question.
270
MACGREGOR, CHRONICLE, AND ORMEROD
The rational approach to cognition holds that the cognitive system may be usefully viewed as adapted to find optimal (or close-to-optimal) solutions to problems that the environment presents (Anderson, 1990). From this perspective, it has been argued that tasks that have been taken to demonstrate the irrationality, or nonoptimality, of behavior may do so because they engage cognitive processes that are adapted to deal with different realworld problems (Oaksford & Chater, 1998). By the same token, one might argue that when tasks do elicit optimal or near-optimal responses, it is because they engage processes adapted to deal with similar real-world problems. This is where the potential usefulness of optimization problems as a research tool may lie. First, they provide a gold standard of optimality against which to measure human performance. Second, when human behavior approximates this standard, these artificial tasks may provide indicators about the structure of real environmental problems to which the human brain has adapted. Third, they offer a flexible set of stimuli for further laboratory study of the cognitive processes involved. REFERENCES Anderson, J. R. (1990). The adaptive character of thought. Hillsdale, NJ: Erlbaum. Anderson, J. R., & Schooler, L. J. (1991). Reflections of the environment in memory. Psychological Science, 2, 396-408. Basso, D., Bisiacchi, P . S., Cotelli, M., & Farinello, C. (2001). Planning times during traveling salesman’s problem: Differences between closed head injury and normal subjects. Brain & Cognition, 46, 38-42. Brusco, M. J. (2001). Human performance on the Euclidean p-median problem. Unpublished manuscript. Florida State University, Department of Marketing. Gigerenzer, G., & Goldstein, D. G. (1996). Reasoning the fast and frugal way: Models of bounded rationality. Psychological Review, 103, 650-669. Golden, B. L., Bodin, L. D., Doyle, T., & Stewart, W., Jr. (1980). Approximate traveling salesman algorithms. Operations Research, 28, 694-711. Graham, S. M., Joshi, A., & P izlo, Z. (2000). The traveling salesman problem: A hierarchical model. Memory & Cognition, 28, 1191-1204. Lee, M. D., & Vickers, D. (2000). The importance of the convex hull for human performance on the traveling salesman problem: A comment on MacGregor and Ormerod (1996). Perception & Psychophysics, 62, 226-228. MacGregor, J. N., & Ormerod, T. [C.] (1996). Human performance on the traveling salesman problem. Perception & Psychophysics, 58, 527-539.
MacGregor, J. N., & Ormerod, T. C. (2000). Evaluating the importance of the convex hull in solving the Euclidean version of the traveling salesperson problem: Reply to Lee and Vickers (2000). Perception & Psychophysics, 62, 1501-1503. MacGregor, J. N., Ormerod, T. C., & Chronicle, E. P . (1999). Spatial and contextual factors in human performance on the travelling salesperson problem. Perception, 28, 1417-1428. MacGregor, J. N., Ormerod, T. C., & Chronicle, E. P . (2000). A model of human performance on the travelling salesperson problem. Memory & Cognition, 28, 1183-1190. MacGregor, J. N., Ormerod, T. C., & Chronicle, E. P . (2001). Information processing and insight: A process model of performance on the nine-dot and related problems. Journal of Experimental Psychology: Learning, Memory, & Cognition, 27, 176-201. Marr, D. (1982). Vision. San Francisco: Freeman. Newell, A., & Simon, H. A. (1972). Human problem solving. Englewood Cliffs, NJ: Prentice-Hall. Nosofsky, R. M. (1998). Optimal performance and exemplar models of classif ication. In M. Oaksford & N. Chater (Eds.), Rational models of cognition (pp. 218-247). Oxford: Oxford University Press. Oaksford, M., & Chater, N. (1994). A rational explanation of the selection task. Psychological Review, 103, 381-391. Oaksford, M., & Chater, N. (Eds.) (1998). Rational models of cognition. Oxford: Oxford University Press. Ormerod, T. C., & Chronicle, E. P . (1999). Global perceptual processing in problem solving: The case of the traveling salesperson. Perception & Psychophysics, 61, 1227-1238. P hillips, L. H., Wynn, V. E., McP herson, S., & Gilhooly, K. J. (2001). Mental planning and the Tower of London task. Quarterly Journal of Experimental Psychology, 54A, 579-597. Simon, H. A. (1947). Administrative behavior. New York: Macmillan. Tversky, A., & Kahneman, D. (1973). Availability: A heuristic for judging frequency and probability. Cognitive Psychology, 5, 207232. van Rooij, I., Stege, U., & Schactman, A. (2003). Convex hull and tour crossings in the Euclidean traveling salesperson problem: Implications for human performance studies. Memory & Cognition, 31, 215-220. Vickers, D., Butavicius, M., Lee, M., & Medvedev, A. (2001). Human performance on visually presented traveling salesman problems. Psychological Research, 65, 34-45. Vickers, D., Lee, M. D., Dry, M., & Hughes, P . (2003). The roles of the convex hull and the number of potential intersections in performance on visually presented traveling salesperson problems. Memory & Cognition, 31, 1094-1104. Vickers, D., Mayo, T., Heitman, M., Lee, M. D., & Hughes, P . (2004). Intelligence and individual differences in performance on three types of visually presented optimization problems. Personality & Individual Differences, 36, 1059-1071.
(Manuscript received November 26, 2002; revision accepted for publication September 25, 2003.)