In this work, we introduce an alternative solution based on a very general class of mul- ... Gaussian hypothesis is an illustration of this a priori know- ledge on the ...
COPULAS IN VECTORIAL HIDDEN MARKOV CHAINS FOR MULTICOMPONENT IMAGE SEGMENTATION Nicolas Brunel, Wojciech Pieczynski
St´ephane Derrode
GET/INT, CITI - CNRS UMR 5157 9 rue Charles Fourier, F91000 Evry
EGIM, Institut Fresnel (CNRS UMR 6133) Dom. Univ. de St J´erˆome, F13013 Marseille
ABSTRACT Parametric estimation of non-Gaussian multidimensional probability density function (pdf) is a difficult problem that is required by many applications in signal and image processing. A lot of efforts has been devoted to methods from multivariate analysis such as Principal or Independent Component Analysis (PCA and ICA). In this work, we introduce an alternative solution based on a very general class of multivariate models called ‘copulas’. Useful copulas models for image classification are used in the frame of multidimensional mixture estimation arising in the segmentation of multicomponent images, when using a vectorial Hidden Markov Chain (HMC). 1. INTRODUCTION The aim of this paper is to introduce copulas for multivariate modelling in the framework of statistical image segmentation and to compare this approach with other methods coming from multivariate data analysis. The main problem of multicomponent images and of their statistical processing is the choice of a relevant statistical model for the relationships between the components. Segmentation procedure of scalar data usually makes the assumption that the expected classes differs from each other by a mean level µ and an inner degree of dispersion σ. The Gaussian hypothesis is an illustration of this a priori knowledge on the classes, and the use of Gaussian vectors for multivariate data shows the same implicit assumption for multicomponent images. This assumption can be very restrictive since the difference between the classes can depend on the ways the components are linked (independently of µ and σ). Moreover, if the abundance of univariate parametric models enables to manage deviance to normality, possibilities are far more restricted for multivariate models especially when we want to respect some constraints on the law of each component (due to physical knowledge about the involved phenomena). Copulas are a statistical tool used for the modelling and estimation of dependence between random variables [1], that
gives a general answer to such problem. It enables to widen the ability of multivariate modelling and to keep the same methodology as the one classically used with HMC [2]. It also brings out the influence of dependence between the components for the characterization of the classes. This paper is organized as follows. In next section, the HMC approach and the estimation methodology are briefly recalled. We then introduce copulas in Section 3, and present some useful models for image analysis. Section 4 discusses estimation methods for multivariate data. In section 5, the methods are illustrated on a multispectral image from a CASI sensor. Conclusions are drawn in section 6. 2. HMC AND UNSUPERVISED ESTIMATION The estimation principle is recalled here to make the paper self-contained (see [2]). The pixels of the M layers of a multicomponent images are first transformed into 1D chains using a Hilbert-Peano scan on each image. Hence, we get N series of M data,� denoted by y = (y 1 , . . . , y N ), where y tn = yn1 , . . . , ynM , 1 ≤ n ≤ N . The objective is to classify each y n into a set of K classes Ω = {ω1 , . . . , ωK } in order to obtain the segmented chain x = (x1 , . . . , xN ). The image is then reconstructed from x by using an inverse Hilbert-Peano scan. Assuming that y comes from a HMC [3], x is the hidden process which can be recovered by Bayesian estimation procedures. This probabilistic approach is possible if we � know the law of the random vector Y tn = Yn1 , . . . , YnM conditionally on the state Xn . In the case of unsupervised segmentation, the distribution P (X, Y ) is unknown. Therefore, we have to estimate the following sets of parameters (1 ≤ k, l ≤ K) : (i) the transition matrix A with entries aωk ,ωl ; (ii) the observation densities, i.e. the parameters of the K M -dimensional distributions fωk . The estimation of all the parameters is usually achieved by an iterative search of the Maximum Likelihood Estimator (MLE), like EM algorithm and variants as Stochastic EM algorithm [4]. We use here another one called Iterative Conditional Expectation (ICE), which uses the conditional expectation of well-suited estimators from the com-
plete data (x, y) [5]. This algorithm faces the problem of estimating the multidimensional pdf arising in the multicomponent HMC model. If Gaussian densities are considered, law parameters can easily be estimated from the first order moments of a M -dimensional sample. However, in a number of image modalities, the noise can not be properly modelled by Gaussians. Moreover, the nature and the form of the distribution of each class in the different layers can vary (e.g. multisensor case). One solution is to use copulas, which are a general tool for modelling multidimensional pdf. 3. MULTIDIMENSIONAL PDF MODELLING WITH COPULAS A (bivariate) copula is a cumulative density function (cdf) on the unit square with uniform margins. Such functions enables to give an exhaustive description of the dependence between two random variables. The clearest way to illustrate it is the Sklar’s existence theorem which clarifies the link between marginal laws and the joint law [1] : Let Y1 , Y2 be two real random variables, with (respectively) cdf F1 and F2 . Let F be the corresponding bidimensional cdf on R2 , then F has a copula representation, i.e. there exists a copula C such that � ∀y 1 , y 2 ∈ R, F (y 1 , y 2 ) = C F1 (y 1 ), F2 (y 2 ) . (1) Moreover, the copula is unique if the cdf of the margins are continuous. If the copula is differentiable, we deduce directly from (1) the relationship between the pdfs of the variables (noted with lowercase letters) : � f1,2 (y 1 , y 2 ) = f1 (y 1 ) f2 (y 2 )∂1,2 C F1 (y 1 ), F2 (y 2 ) , (2) with ∂1,2 denoting the derivation toward the two coordinates. ∂1,2 C = c is called the density of the copula. These results are also available for a cdf F on RM and related marginals F1 , . . . , FM . If we use a copula �for modelling a multivariate variable Y t = Y 1 , . . . , Y M , we need first to specify the marginal laws of each Y m . The latter can be known from a priori knowledge or by univariate statistical analysis of training data sets. Then, a copula is needed to construct the joint law of Y . For illustration purpose and latter use in experiments, three copulas are now presented. Product copula (C1 ) - The product copula is defined by C1 (u1 , . . . , uM ) = u1 . . . uM , and corresponds to the case of independence between the QMcomponents since the density of Y is written f Y (y) = m=1 fm (y m ), where fm is the density of Y m . Gaussian copula (C2 ) - For a multivariate Gaussian model N (µ, Σ), with mean µ ∈ RM and variance matrix Σ = (σij )1≤i,j≤M , two assumptions are made : (i) the mar2 gins are univariate Gaussian variables with law N (µi , σii );
(ii) the dependence structure is such that we have a Gaussian joint law. The Sklar’s theorem explains how to get rid of the Gaussian margins. We write ρ as the correlation matrix deduced from Σ, I the� identity matrix of RM , and ζ t = Φ−1 (u1 ), . . . , Φ−1 (uM ) with Φ the cdf of the normalized Gaussian density. If we invert Eq. (2) that gives the relation between the density of the underlying copula and the density of a Gaussian vector, we get c2 (u1 , . . . , uM ) = |ρ|
− 21
t −1 1 e− 2 (ζ (ρ −I)ζ ) .
(3)
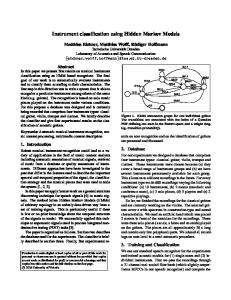
The Gaussian copula is very useful since computations are rather easy and the dependence structure is very intuitive, based on the usual correlation coefficients. Student copula (C3 ) - In the same way, we can compute the Student copula by exploiting the multivariate Student law, with ν degrees of freedom. The computation of the underlying copula is manageable since each margin is a univariate Student law with ν degrees of freedom. The density of the Student copula is then � �M −1 ν+M Γ ν2 − 21 Γ 2 c3 (u1 , . . . , uM ) = |ρ| �M Γ ν+1 2 (4) �− ν+M 2 1 + ν1 ξ t ρ−1 ξ ×Q � ν+1 , M 1 2 − 2 ξ 1 + m=1 ν m −1 with ξ the vector with components ξm = Tm (um ). Tm is the cdf of a (univariate) Student law with ν degrees of freedom, and ρ is a correlation matrix as for C2 . Fig. 1 shows examples of 2D densities obtained with fixed Gamma margins for the three kinds of copulas. The shape and scale parameters of the Gamma laws for the two marginals were set to (1.5, 0.5) and (0.5, 0.5). We can easily observe from the contour plots that the iso-probabilities are quite different, even for C2 and C3 copulas.
4. MULTIDIMENSIONAL PDF ESTIMATION WITH COPULAS Suppose we have an i.i.d. sample y = (y 1 , . . . , y N ) of vectors of dimension M and we� want to estimate its distribution FY 1 ,...,Y M y 1 , . . . , y M . Before examining copulas, let us briefly recall the multivariate analysis viewpoint. 4.1. Parametric multivariate analysis Several strategies are possible, depending on the assumptions made on the links between the components. The most heavy-handed one is independence so that f is written as in C1 copula. A more sophisticated solution is to consider correlations and consists in applying a PCA algorithm on the data before densities estimation. This can be done by projecting y onto an orthonormal system defined by W so that
2
2
2
1.5
1.5
1.5
1
1
1
0.5
0.5
0.5
0.2
0.4
0.6
0.8
1
1.2
1.4
1.6
1.8
2
1
0
0.5 0 0
0.2
1 0.2
0.4
0.6
0.8
1
1.2
1.4
1.6
1.8
2
0.6
0.8
1
1.2
1.4
1.6
1.8
2
1
(a) Product copula - C1
0.2
0
0.5 0 0
2
0.4
1 0.2
0.4
0.6
0.8
1
1.2
1.4
1.6
1.8
(b) Gaussian copula - C2
2
2
0.4
0.6
0.8
1
1.2
1.4
1.6
1.8
2
1
0
0.5 0 0
1 0.2
0.4
0.6
0.8
1
1.2
1.4
1.6
1.8
2
2
(c) Student copula - C3
Fig. 1. Bivariate densities with (a) independent Gamma margins, (b) correlated Gamma margins using a Gaussian copula (ρ = 0.5) and (c) dependent Gamma margins with Student copula (ρ = 0.5, ν = 10). the new data tn = W y n are decorrelated. Hence, we get the following estimation : f (y n ) = |det (W )|
M Y
f m (tm n ).
(5)
m=1
However, ideally, data should be independent and this naturally fits an ICA approach. The objective of ICA is to find a linear transformation W 0 so that the new data sn = W 0 y n are mutually independent. A solution can be find under the assumption that the sm components are not Gaussian. This optimization problem requires the optimization of a ‘nonGaussianity’ criterion such as the kurtosis or the neguentropy [6]. The density f can be reconstructed using a form mula similar to Eq. (5), replacing W by W 0 and tm n by sn . 4.2. Estimation of copulas Instead of looking for a “good” transformation of the data in order to go back to a multivariate independence case, we estimate the margins and the copula in some parametric models, following the Sklar’s decomposition : � FY 1 ,...,Y M y 1 , . . . , y M ; η, (θm )1≤m≤M = (6) � C FY 1 (y 1 |θ1 ), . . . , FY M (y M |θM ) ; η , Parameters θm characterize the margins and η defines the copula. We propose to use the following two-step estimation methodology (‘Inference For Margins’ - IFM [7]) : 1. compute the MLE θˆm of each margins from the M samples (ynm )1≤n≤N and then create the new data set m ˆ ∀n, m, um n = F (yn |θm ). The family of F is chosen among Gamma, Beta, ... distributions. 2. compute the MLE ηˆ from the new sample (u1 , . . . , un ). Gaussian copula (C3 ) Whatever the margins used, ρ can be estimated by the following matrix ˆ= ρ
N 1 X ζ ζt . N n=1 n n
(7)
Student copula (C3 ) The MLE estimation of ρ can be computed by solving a fix point equation, deduced from the first order condition of the maximization of the log-likelihood. The Gaussian estimator given by Eq. (7) can be used for the initialization of the iterative search of the root. The IFM method furnishes only an approximation of the MLE since the global maximization of the likelihood is replaced by two successive (and easier) maximizations. Nevertheless, the procedure gives good estimations and is easy to implement. For its use in HMC, it is only required to adapt the general frame of the ICE algorithm to this twosteps estimation. Remark 1 : One can then ask for the difference between the use of a PCA analysis and of a Gaussian copula for the estimation of the multidimensional pdf. In the first case, we estimate the laws of the principal components of the signal. For instance, we make the assumption that the laws of the principal components belong to an a priori parametric model, such as the Pearson’s system of distributions. It can be seen from Eq. (5) that the densities of the margins are hard to recover since we have to integrate over M − 1 variates, whereas we directly identify the laws of the margins with copulas and then the dependence structure (characterized here by a matrix ρ). So, in general, PCA does not furnish an idea on the induced parametric shape for margins. Remark 2 : The ICA approach supposes that there exists a linear transformation of the data that gives independence, whereas, for copulas, we have to make the choice of a copula family among the numerous existing models, see [1]. 5. SEGMENTATION OF MULTISPECTRAL IMAGES This section is intended to illustrate the multidimensional pdf modelling capability of copulas. Hence, vectorial HMC-based classifications have been applied on an airborne hyperspectral CASI image, reduced to 4 bands through an
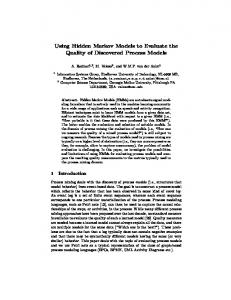
Fig. 2. Four bands of a multicomponent image. 256 × 256. adapted projection pursuit method [8], see Fig. 2. The orignal image contains 17 spectral bands from 450 to 950 nm and ground resolution is two meters. Results from ACI (non-Gaussianity criterion from Hyv¨arinen [6]), and for product, Gaussian and Student copulas are presented in Fig 3. In all the experiments, segmentations have been achieved with 4 classes that should correspond to forest, fields, roads and wasteland. Hence, the parameters to be estimated by ICE correspond to a mixture of 4 classes in a 4D space. Gamma laws have been chosen for independent components in ACI, as well as for margins in copulas. It is obvious that the classifications obtained are all different and this difference is only due to the way multivariate densities are estimated. However, it is quite difficult, and not the purpose of this work, to determine which result is the more appropriate and should depend on the application considered. 6. CONCLUSION Copulas are a statistical concept representing the dependence between random variables in a very general way. In this work, copulas have been used to model multidimensional pdf arising in the segmentation of multicomponent images, when using a vectorial HMC-model. Three types of copulas have been illustrated according to the segmentation of a four spectral band images, and visually compared to the segmentation obtained from ACI analysis. Such copulas are not limited to the context of HMC and will be further investigated in a number of problems and models where multidi-
Product Copula
ACI
Gaussian copula
Student copula (ν = 10)
Fig. 3. Segmentation results. The same colors have been used for most similar classes. mensional pdf estimation is concerned. 7. REFERENCES [1] R. B. Nelsen, An introduction to copulas, vol. 139 of Lectures Notes in Statistics, Springer-Verlag, 1998. [2] S. Derrode, G. Mercier, and W. Pieczynski, “Unsupervised multicomponent image segmentation combining a vectorial HMC model and ICA,” in IEEE ICIP, Barcelona, Spain, 2003. [3] L. R. Rabiner, “A tutorial on hidden Markov models and selected applications in speech recognition,” Proc. of IEEE, vol. 77, no. 2, pp. 257–286, February 1989. [4] G. J. McLachlan and T. Khrishnan, The EM algorithm and extensions, Wiley Interscience, 1996. [5] W. Pieczynski, “Statistical image segmentation,” Mach. Graph. and Vis., vol. 1, no. 1/2, pp. 261–268, 1992. [6] A. Hyv¨arinen and E. Oja, “ICA : algorithms and applications,” Neur. Net., vol. 13, pp. 411–430, 2000. [7] H. Joe, Multivariate models and dependence concepts, vol. 73 of Monographs on Stat. and App. Prob., Chapman and Hall, 1997. [8] G. Mercier, S. Derrode, and M. Lennon, “Hyperspectral image segmentation with Markov chain model,” in IGARSS, Toulouse, France, 2003.