2011 Eighth International Conference Computer Graphics, Imaging and Visualization
COPY-MOVE FORGERY DETECTION USING DYADIC WAVELET TRANSFORM Najah Muhammad1, Muhammad Hussain2, Ghulam Muhammad2, and George Bebis2 1
College of Computer and Information Sciences, Prince Norah Bint Abdul Rahman University College of Computer and Information Sciences, King Saud University, Riyadh, Saudi Arabia Email: {
[email protected];
[email protected]}
2
information. Though non-intrusive approach is attractive, and some work has been done in this direction, the research on this approach is still in its infancy, and more efforts are required for proposing stable solutions for the problem of forgery detection. Digital image forgery is the process of manipulating an original image by applying geometric transformations such as (rotation, scaling, resizing, etc), adding noise, removing/inserting an object or applying any other type of manipulation to hide the real information. Copy move forgery is one type of tempering that is commonly used for manipulating the digital contents; in this case, a part of an image is copied and is pasted on another region of the image. In this paper, the focus is on detecting copy-move forgery, because most of the tampering involves hiding or adding some image contents and it is accomplished by copy and move. The task of tamper detection becomes more difficult with the copy move forgery. This is due to the similarity between the characteristics of the copied and pasted regions of an image; these characteristics include the noise component, color palette, dynamic range etc. This indicates that the detection methods that search for tampered image regions using inconsistencies in statistical measures will fail. There are a number of methods that provide solutions for copy-move forgery detection. Each of these methods provides a solution under a set of conditions or assumptions; the method fails if its assumptions are not realized [3, 13, 9, 14]. In this paper, early findings of our study for the solution of this problem are presented. This solution is based on the idea that copied and pasted regions must have the same internal structures. An image is segmented and then is decomposed using dyadic wavelet transform (DyWT). DyWT is shift invariant and captures the structural information in a better way than discrete wavelet transform. Using DyWT, an image is decomposed up to scale 2. Each pair of segments is compared for their structural similarity using their LL and HH sub-bands at scale 2. The similarity is measured using statistical measures. The two segments are copied and pasted it they are found similar. The rest of the paper is organized as follows. The next section discusses the published work that is related to copymove forgery detection. In Section 3, the proposed method
ABSTRACT The issue of the verification of the authenticity and integrity of digital images is increasingly being important. Copy move forgery is one type of tempering that is commonly used for manipulating the digital contents; in this case, a part of an image is copied and is pasted on another region of the image. The non-intrusive approach for this problem is becoming attractive because it does not need any embedded information, but it is still far from being satisfactory. In this paper, an efficient non-intrusive method for copy-move forgery detection is presented. This method is based on image segmentation and similarity detection using dyadic wavelet transform (DyWT). Copied and pasted regions are structurally similar and this structural similarity is detected using DyWT and statistical measures. The results show that the proposed method outperforms the stat-of-theart methods. Index Terms— Image forgery detection; non-intrusive method; denoising; copy-move forgery. 1. INTRODUCTION Because of recent advances in imaging technologies, it has become very easy to preserve any event in the form of a digital image, and this digital pictorial information is being used widely for multiple purposes including surveillance, scientific discoveries and electronic media. On the other hand, due to the development of sophisticated editing software, even a novice person can tamper the digital contents with an ease. As a result, authenticity of images cannot be taken for granted and the issue of the verification of the authenticity and integrity of digital contents is increasingly becoming important. This motivated the need of techniques which can be used to validate the authenticity of digital content. The existing techniques for forgery detection can be classified into two main categories: intrusive and nonintrusive. Intrusive techniques need that some sort of digital signature be embedded in the image at the time of its creation, and so their scope is limited because all digital devices do not have the feature of embedding digital signature at the time of capturing an image. On the other hand, non-intrusive approach needs not any embedded 978-0-7695-4484-7/11 $26.00 © 2011 IEEE DOI 10.1109/CGIV.2011.29
103
is explained. Section 4 contains the experimental results. In Section 5, we discuss our results and Section 6 concludes the paper.
The algorithm proposed in [16] is based on pixel matching to detect tampering. The approach uses DWT (Discrete Wavelet Transform) to get reduced data representation. Also, phase correlation is used to compute the spatial offset between the copied and pasted regions in the image. The work in [1] uses a feature representation that is invariant to not only noise addition or blurring, but also invariant to several geometric transformations such as scaling and rotation that may be applied to the copied region before pasting. These properties are achieved using FMT (Fourier Mellon Transform) feature representation. The counting bloom filter is used instead of lexicographic sorting to improve the time complexity. Their experimental results showed that the proposed representation of the feature block is more robust to JPEG compression. Furthermore, it can detect rotations up to10°. The method proposed in [8] starts by dividing the image into overlapping blocks of equal sizes. Then, each block Bi is divided into 4 equal sizes sub-blocks S1, S2, S3, S4. The feature vector of dimension 9 is represented as follows: vi = ( f1 , f 2 , f 3 , f 4 , f 5 , f 6 , f 7 , f 8 , f 9 ) where f1 is the average intensity of the entire block B; f2, f3, f4 are calculated as the ratios of the average intensities of the image sub-blocks S1,S2,S3,S4 to f1. Furthermore, f6, f7, f8, f9 are computed as the differences between the average intensities of the sub-blocks S1, S2, S3, S4 and f1. Then, all the computed features are normalized to integers in the range [0, 255]. After that, a counting sort [5] is used to sort feature vectors. The experimental results of this algorithm show that about 98% of detection rates can be achieved with different sets of 50 images with/without modifications such as compression and Gaussian noise. This method can detect a copy-move forgery with rotation. This is done by applying the algorithm in an image that combines three rotated versions of the image rotated by 90,180,270 degrees. Other block features representation can be found in [15]. The most important issues in this approach are: the block feature representation and the sorting algorithm. A robust feature extraction method must be employed that is insensitive to different types of post-processing and involves the lowest complexity. In addition, the sorting algorithm must have the lower run time complexity. We propose a method that is simple and more efficient.
2. RELATED WORK This section focuses on non-intrusive methods dealing with the copy-move forgery. Several approaches are available as results of attempts to detect this type of forgery. The most commonly used non-intrusive approach for copymove forgery detection is based on block matching [3]. In block based methods, an image is partitioned into equal sized blocks, and the tempering is detected using feature similarities between image blocks. Often, the tested image is convolved with a window of a small size. The features of each block are extracted to constitute a feature vector. The feature vectors are then sorted so that the similar vectors are grouped together and neighbor information is analyzed; a similarity threshold is set based on experiments. The similar feature vectors indicate that their corresponding image blocks are copy of each other. In [3], a detection method based on matching the quantized lexicographically sorted discrete cosine transform (DCT) coefficients of overlapping image blocks has been proposed. The experimental results show reliable decisions when the retouching operations are applied. However, the authors do not show robustness tests. Another method which is invariant to the presence of a blur degradation, contrast changes and additive Gaussian noise, is presented in [11]. Features of the image blocks are represented by a blur moment invariants. The experimental results show that the algorithm performs well with the blurring filter and the lossy JPEG compression quality down to 70. However, like other similar methods, this algorithm may falsely label unmatched areas as matched. This problem arises in case of uniform regions such as sky. Another disadvantage of this algorithm is its computational time. The average running time of the algorithm with block size of 20, a similarity threshold 0.97 and image size of 640×480 RGB image, using a processor of 2.1 GHz and 512 MB RAM is 40 minutes. In [6], singular value decomposition is used to obtain singular values feature vectors as blocks representation. The feature vectors are sorted using the lexicographical sort. The experimental results show that the algorithm is comprehensive. It has been shown that the algorithm performs well even in images with uniform areas such as sky and ocean. The running time with one color channel of 256×256 images running on a 1.8 GHz processor and 256MB RAM when block size is 20, is approximately 120 seconds. In [4], features are represented by SIFT algorithm (Scale Invariant Feature Transform) due to its invariance to changes in illumination, rotation, scaling, etc. The experimental results show that about 38 matches can be reached if the Euclidean distance between the matched descriptor vectors is set to 0.45.
3. PROPOSED METHOD In this section, we propose our technique for detecting tampered images and locating the tampered regions in the image. The copy-move tampering is done by copying a region of the image and pasting it on another place in the same image. A blurring may be applied to hide borders and to integrate the pasted region with the image background. When a region is copied and moved to another place, it will keep its internal structure that can be used to indentify tampering. We measure this internal structure using DyWT.
104
We studied the internal structure of an image using its multi-resolution decomposition and found that an original image has different patterns for its different regions related to different objects. However, a tampered image, where one of its regions is replicated, will have almost the same pattern for both the copied and pasted parts. The general framework of the proposed algorithm is as follows: Step-1: Segment the input image. Step-2: Apply DyWT on the input image and get and subbands (scale 2). Step-2: Using the segmented image, extract the corresponding segments from and subbands at scale 2. Step-3: Analyze the pattern of each segment. Step-4: Two segments are indicated as tampered if the Euclidean distance between their patterns is less than a threshold T. In the following subsections, we elaborate the main steps involved in the algorithm.
In this section we give the detail of analyzing the patterns of the smoothed and high-frequency versions of segments for forgery detection. The feature vectors and for each of the segments , , , ,…, , respectively, are calculated. The feature vector contains the mean, mad and skeweness of and the feature vector contains the skeweness and variance of such that: ∑
where
Note that the same definitions are applied for where s is the standard deviation of
.
.
In the next step, the Euclidian distance between the feature vectors of each pair , is calculated such that: ,
,
,…. ,
,…. ,
Similarly, the Euclidian distance between the features of each pair , is calculated such that: , ,…. , ,…. , ,
3.2 Decomposition using Dyadic Wavelet Transform The DWT is decimated (down-sampling) wavelet transform where the size of the image is reduced by half at each scale. Though DWT is useful in applications such as data compression, it does not lead to optimal results in applications such as filtering, detection, pattern recognition, texture analysis. This is mainly because of the reason that DWT is not shift invariant. To overcome this drawback in DWT, the alternative is DyWT pioneered by Mallat and Zhong [20,21]. In the DyWT there is no down-sampling step and more information can be kept and used for better analysis and understanding of the signal properties Using DyWT decomposition of the image, the smoothed and the high frequency versions of each segment are extracted as following: Apply Dyadic Wavelet Transform on the image I with size pixels to get and sub bands at scale 2. Extract the regions from and corresponding to segments , , … , such that: o , , ,,, are extracted from subband. o , , ,,, are extracted from subband. and
.
Central moments of order 3,
3.1 Image Segmentation In this step, the input image is segmented into a number of segments in such a way that an object is fully contained in a single segment, and the segment is almost homogeneous. For this purpose, we use the algorithm presented in [18]. An input image I of size is segmented into r segments S1,S2 ,…,Sr.
3.3 Analyzing the Patterns of the
is the number of pixels in segment
Two lists , and , consisting of the Euclidean distances of all pairs of segments and , ,…, , respectively, are created. Then, , and , , are ordered in increasing order depending on the values of , and , . 3.4. Detecting Tampered Regions
The tests performed with this algorithm show that the values in the lists , and , , that correspond to the tampered segment pair (copied segment, tampered segment) are the minimum. This means that if the copied and pasted segments pair appear at position in one list then it will be found in position where , where T is a threshold determined by experiments. In our experiment we found that gave the optimum performance. We illustrated our findings with a set of test images. 4. RESULTS AND COMPARISON
We tested the performance of our proposed method on a number of forged images, and found encouraging results.
Segments
105
In this section, we present the test results for 4 images, which are shown in Figures 1~4.
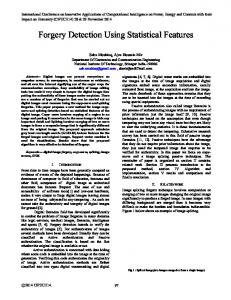
For each image, we choose the minimum number of segments that can segment the image objects correctly. Figure 1(b) is the tampered image where the blue cap in the top row has been copied and pasted in the lower row. Figure 1(c) shows the segmentation of the tampered image. ′ The tampered segment pair is (3,5) .The values of , , , for each segment pair is shown in Table 1. Segment pair (3,5) has the smallest value for their , and ′ , .Also, ′ related to segment pair (3,5) is very small , , , compared with other segment pairs.
(a) (b) (c) Figure 1. (a) Original Image (b) is the tampered image where blue cap in the top row has been copied and pasted in the lower row. (c) shows the segmentation of the tampered image; segment #1, 2, 3 (top row left to right), and segment #4, 5 (bottom row).
Figure 2 (b) is the tampered image where the red and blue objects in the left upper corner have been copied and pasted in the right lower corner. Figure 2(c) shows the segmentation of the tampered image, here each white region correspond to one segment. The tampered segments pair are ′ (6, 9) and (8, 10).The values of , , , for each segment pair is shown in Table 2. Figure 3(b) is the tampered image where the upper object has been copied and pasted in the lower part. Figure 3(c) shows the segmentation of the tampered image. The tampered segment pair is (2, 5). The values of , , , for each segment is shown in Table 3. Figure 4(b) is the tampered image where the picture in the lower part has been copied and pasted in the upper part. Figure 4(c) shows the segmentation of the tampered image. The tampered segment pair is (2, 4). The values of , , , for each segment are shown in Table 4. From Tables 1~4, it is obvious that the tampered regions in each image have been correctly identified by the proposed method. We compare our method with one of the recent nonintrusive forgery detection methods presented by Babak et al. [12]; this method partitions an image into equal size rectangular blocks and uses DWT to estimate image noise for detecting image tampering. The noise feature used by them is MAD ( median absolute deviation), which is employed to measure the noise inconsistency between blocks. If there is no noise inconsistency across all the blocks, then it is original, otherwise it is tempered. We applied their algorithm (provided by Babak) using our test images; the results show that our algorithm can produce more precise and clear results. For example, in Figure 5, which shows the detection results of the tampered image depicted in Figure 4; the regions with homogenous noise level have been shown in black while other regions are assigned random colors. Figure 5(a) means that the noise level is consistent over the entire image and there is no tampering but this is false result. For Figure 5(b), the green (and similarly pink) regions represent the places where the noise level is not consistent; the green region partially detects the tampered region whereas pink region is false detection.
(b) (a) (c) Figure 2 (a) Original Image (b) is the tampered image where red and blue objects in the left upper corner have been copied and pasted in the right lower corner, (c) shows the segmentaion of the tampered image; segment numbers start with 1, 2, …, at the top row from left to right and row by row.
(a) (b) (c) Figure 3 (a) Original Image, (b) is the tampered image where the upper object has been copied and pasted in the lower part., (c) shows the segmentaion of the tampered image; segment numbers start with 1, 2, …, at the top row from left to right and row by row.
(a) (b) (c) Figure 4 (a) Original Image (b) is the tampered image where the picture in the lower part has been copied and pasted in the upper part. (c) shows the segmentaion of the tampered image; segment #1, 2, 3 (top row left to right), and segment #4 (bottom row).
106
5. DISCUSSION The proposed algorithm is a promising non-intrusive algorithm for copy move forgery detection, which is based on the analysis of noise pattern. Other methods that use image noise for forgery detection are proposed in [10, 2, 7, and 17]; some of them require training the classifier with hundreds of images from several cameras. These algorithms can detect tampering in images captured by the same camera used in the training process. Because of that, these algorithms require previous knowledge about the camera used, which is not always being available. However, our proposed algorithm finds the replicated regions in an image without any previous knowledge about the camera used to capture the image. This proposed algorithm is affected by the segmentation of the image. It can provide better results with segmentation algorithm that can segment an image into complete objects more accurately. Depending on the tables shown below, we found that the segment pairs: copied segment and pasted segment have the smallest , values. As the subband represents the smooth part of the image, then it makes sense that the copied and pasted segments will have the smallest difference for their subband features. This rule alone is not sufficient to consider a segment pair as tampered because the un-tampered segments will have small differences for their subband features also. For this reason, we have to check , and , for each of and subbands such that the segment pair that has small values for both of , and , are detected as tampered. By inspection on the tables below, one can conclude that the tampered segments will have the smallest value for , , , ). To make a decision that the other segments are not tampered a threshold must be determined such that .
(a) B=40, T=1
(b) B=20, T=0.5
Figure 5. the detection result for the tempered image shown in Figure 4 using blocks size B and a similarity threshold T In (a) we used the same parameter values which have been used in [12]. In (b) we changed the parameter values Acknowledgment This work is supported by the National Plan for Science and Technology (NPST), King Saud University, Riyadh, Saudi Arabia under the project 10-INF1140-02. We are thankful to Babak, one of the authors of the paper [11], for providing their code to compare their results with ours. REFERENCES [1] S. Bayram, H. T. Sencar and N. Memon, “An Efficient and Robust Method for Detecting Copy-Move Forgery,” Proc. IEEE ICASSP, 2009, pp.1053-1056. [2] M. Chen, et al., “Determining Image Origin and Integrity Using Sensor Noise.” In Information Forensics and Security, IEEE Transactions on, 2008, pp. 74 – 90. [3] J. Fridrich, D. Soukal and J. Lukas, “ Detection of Copy Move Forgery in Digital Images,” Digital Forensic Research Workshop, Cleveland, OH, 2003. [4] H. Huang, et al., “Detection of Copy-Move Forgery in Digital Images Using SIFT Algorithm,” Pacific-Asia Workshop on Computational Intell. Industrial App., 2008, pp. 272-276. [5] T. H. Cormen, C. E. Leiserson, R. L. Rivest, and C. Stein, “Introduction to Algorithms,” Second Edition. MIT Press and McGraw-Hill, 2001. Section 8.2: Counting sort, pp.168–170. [6] X. Kang, S. Wei, “Identifying Tampered regions using singular value decomposition in Digital image forensics,” IEEE Computer Society, USA, 2008, pp.926-930. [7] Y. Li and C-T. Li, “Decomposed Photo Response NonUniformity for Digital Forensics analysis,” Forensics in Telecommunications, Information and Multimedia, LNCS, Volume 8. Springer Berlin Heidelberg, 2009 , pp.166-172. [8] H-J. Lin, C-W. Wang and Y-T Kao, “Fast Copy-Move Forgery Detection,” WSEAS Trans. Signal Process., 2009, pp.188-197. [9] H.J. Lin, C.W. Wang and Y.T, KAO, “Fast Copy-Move Forgery Detection,” World Scientific and Engineering Academy and Society (WSEAS), 2009 , pp. 188-197. [10] J. Lukáš, et al., “Detecting Digital Image Forgeries Using Sensor Pattern Noise.” Proc. of SPIE, 2006. [11] B. Mahdian and S. Saic, “Detection of Copy Move Forgery Using a Method Based on Blur Moment Invariants,” In Forensic Science International, 171, 2007, pp.180-189. [12] B. Mahdian, S. Saic, “Using Noise Inconsistencies for Blind Image Forensics,” Image and Vision Computing, 2009, pp. 1497-1503.
6. CONCLUSION
We have studied a challenging problem of digital image forgery detection. In this paper, we presented the initial finding of our study. We proposed a new algorithm that can effectively detect tampering on the image and does not require any knowledge about the camera and also does not need a large number of images for the decision making process. So far, we have tested our algorithm for images where the background is simple. We will explore it further for images with complicated background and texture. This will require a more robust and reliable segmentation algorithm; we will search for such an algorithm. Furthermore, we would find image-dependent thresholds for the values of , and ′ , so that the algorithm can distinguish between tampered and untampered segments pairs.
107
[13] A.C. Popescu and H. Farid, “Exposing Digital Forgeries by Detecting Duplicated Image Regions,” Dept. Comput. Sci., Dartmouth College ,Tech.Rep. TR2004-515, 2004. [14] Y. Sutcu, et al., " Tamper Detection Based on Regularity of Wavelet Transform Coefficients," Proc. IEEE ICIP. 2007, pp.397-400. [15] J. Wang, et al., "Detection of Image Region Duplication Forgery Using Model with Circle Block," International Conf. Multimedia Inform. Network. and Security, 2009, pp.25-29. [16] J. Zhang, Z. Feng and Y. Su, “A New Approach for Detecting Copy-Move Forgery in Digital Images.” IEEE Singapore Int. Conf. Comm. Sys., China, 2008, pp.362-366.
[17] P. Zhang, X. Kong, "Detecting Image Tampering Using Feature Fusion,", 2009 International Conference on Availability, Reliability and Security, 2009,pp.335- 340. [18] Timothee Cour, et al., “Spectral Segmentation with Multiscale Graph Decomposition,” IEEE International Conference on Computer Vision and Pattern Recognition (CVPR), 2005. [19] R. C. Gonzalez and R. E. Woods (2002).Digital Image Processing. (Second Edition). [20] M. Husain, an introduction to wavelet transform for visual computing [66] s. G. Mallat and s. Zhong, “Characterization of signals from multiscale edges,” IEEE trans. Pattern anal. Machine intell., july 1992, vol. 14, pp. 710–732. [21] S. Mallat, ed., a wavelet tour of signal processing, 2nd ed. New York: Academic, 2009.
Table 1: Segment pair (3,5) has the smallest value for their , and , . Also, , , , related to segment pair (3,5) is very small comparing with other segments pairs. ,
1
,
0.2046
3 5
-
,
Table 3: Segment pair (2, 5) has a small values for their and , and their max ( , , , ) is also the smallest.
,
0.1919
,
,
0.0127
3 5
1
8.9693
2
5
-
,
,
8.3265
0.1550
1 4
2
40.1408 1
2 38.2902
1.0175
1 4
2
10.8077 4
9 8.6505
0.6428
2 5
3
99.2613 2
4 96.3992
1.1996
3 4
3
15.2657 1
4 15.1107
1.0264
5 6
…
….
….
…
,
,
-
,
…
…
Table 4: Segment pair (2,4) has the smallest value for their and ,
Table 2: Segments pair (6,9) and (8,10) have the smallest value for their , and ,
,
,
,
,
,
1.6088
0.0157
2 4
1.0161
6 9
0.8866
0.0881
8 10
1
1.6245
2
4.5463
8 10
4.4582
0.1295
6 9
2
25.7272 3
4 24.2764
1.0922
1 3
3
5.1207
6 7
3.5421
0.1829
7 10
3
25.9841 2
3 24.5483
1.4358
2 3
…
….
…
108
…
4
,
1
…
2
-
,
…