Corn Monitoring and Crop Yield Using Optical and RADARSAT-2 Images Jesus Soria-Ruiz
Heather McNairm
Geomatics Lab. National Institute of Research for Forestry, Agriculture and Livestock (INIFAP) Zinacantepec, Mexico
[email protected]
Remote Sensing Application Agriculture and Agri-food Canada Lethbridge, Alberta, Canada
[email protected]
Yolanda Fernandez-Ordonez
Joni Bugden-Storie
Geo-Informatics Program Colegio de Postgraduados Montecillo, Mexico.
[email protected]
Department of Geosciences Western Carolina University Collowhee, NC 28723, USA
[email protected].
Abstract—In agriculture, soil and crop conditions change from day to day and throughout the growing season. Agricultural targets also vary spatially with differences observed from field to field, as well as within individual fields. The heterogeneity of corn-growing conditions in Mexico makes accurate data for crop type, crop condition and crop yield prediction difficult to obtain. Yield predictions are needed by the federal government to estimate, ahead of harvest time, the amount of corn required to be imported in order to meet the expected domestic shortfall. In this project a methodology for the estimation of corn yield ahead of harvest time is developed which uses radar and optical remote sensing and which specifically considers the corn-growing situation in Central Mexico. Radar based crop type classification requires data sets with multiple polarizations. Recent research to assess relative classification accuracies of multi-polarized combinations for target crops using airborne data has been reported. In addition to identifying crop type and variety, identifying crop growth stage is valuable. Crop condition, loosely defined as the vigor or health of a crop in a particular growth stage, is related to crop productivity and yield; however, the relationship is complex. Main crop condition indicators include biomass, height, leaf area and contents of plant water, chlorophyll and nitrogen. Crop-type and crop-condition mapping are among the applications that are expected to benefit the most from the technical enhancements embodied by RADARSAT-2. The potential of RADARSAT-1 data for these applications has been rated as “limited”, whereas for RADARSAT-2 data this potential is anticipated to be “strong”. The Science and Operational Applications Research for RADARSAT-2 Program (SOAR) is promoting the evaluation of Synthetic Aperture Radar (SAR) capabilities by providing images to selected research projects which include the present one. The objectives of this project are: a) use RADARSAT-2 data and optical data to determine cultivated areas and monitor crop condition for obtaining better estimations of crop yield; b) obtain polarization signatures from RADARSAT-2 data for corn and relate these to Leaf Area Index and photosynthetic active radiation (PAR) crop parameters and vegetation indexes, to
1-4244-1212-9/07/$25.00 ©2007 IEEE.
3655
establish indicators of crop condition and produce estimates for crop yield; c) use field data collected for three key corn crop growth stages over 300 pilot plots during 2001-2006, and increase the number of plots to build a database to support accuracy studies using RADARSAT-2 data. The expected benefits of this project are: to obtain knowledge about crop type, crop condition and crop yield with better accuracy than with current methodologies; to support national corn farmers associations; to design agriculture related activities within State agriculture plans; to support the corn product industry and aid government decision making. Relevant results and economical impact will imply operational usage of RADARSAT- 2 data in the agricultural sector in Mexico. Keywords: corn; crop condition; crop yied;, polarization; RADARSAT-2.
I. INTRODUCTION The main goal of agricultural crop management in any country is to guarantee food resources for its population. At the global level the goal is to adequately feed 8 billion people, a number which will very likely be larger by 2050 [1]. Farming is today an economically, socially and environmentally sensitive sector. Satellite remote sensing now underpins an objective, global and precise approach to resource management and has become crucial to agricultural inventories, crop yield prediction and monitoring crop health. Crop information includes both crop type and crop condition. Crop information is important in the marketing of agricultural products both nationally and internationally, in validating crop claims, in enforcing agricultural practices, and in site specific (potential areas) crop management. Visible, infrared and microwave wavelengths are sensitive to very different crop characteristics. Data from optical and
radar sensors are thus complementary. Synthetic Aperture Radar (SAR) responds to the large scale crop structure (size, shape and orientation of leaves, stalks, and fruits) and the dielectric properties of the crop canopy. The heterogeneity of corn-growing conditions in Mexico makes accurate data for crop type, crop condition and crop yield predictions difficult to obtain. Sensible predictions are needed by the government to estimate well ahead of harvest time, the amount of corn required to be imported to meet the expected domestic shortfall. In this paper a methodology to improve the estimation of corn yield ahead of harvest time is developed for the specific corn-growing conditions in the central region of the country. Crop type classification requires data sets with multiple polarizations. Recent research to assess relative classification accuracies of multi-polarized combinations for RADARSAT-2 has been done using simulations with airborne data [2]. Complete statistical analyses have not been possible due to insufficient field data in some cases, and crop condition assessments have been qualitatively established through visual comparisons. However it has been suggested that multipolarized configurations can detect crop type differences. These preliminary findings should be compared with crops in other geographical areas and under different production systems. In particular, research is needed to assess the significance of saturation effects and to investigate the synergy between the optical and SAR imagery. Crop information includes crop type and crop condition. In addition to identifying crop type and variety, identifying the crop growth stage can be of value. Crop condition is loosely defined as the vigor or health of a crop. Crop condition is often related to crop productivity and yield, but this relationship is complex. Crop condition indicators can include biomass, height, leaf area, plant water content, chlorophyll and nitrogen, among others. These indicators must be linked to crop growth stage, and thus it is necessary to monitor these indicators over the entire growing season [3]. Crop-type and crop-condition mapping are among the three applications that are expected to benefit the most from the technical enhancements embodied by RADARSAT-2 [4]. The potential of RADARSAT-1 data for these applications is rated as “limited”, while the applications potential for RADARSAT2 data is anticipated to be “strong” [5]. Reference [6] presents a detailed review of the utility of C-band polarimetric data for agriculture. The RADARSAT-2 sensor incorporates state-of-the-art technology and will provide one of the most advanced commercially available radar imagery in the world. RADARSAT-2 was designed to meet the needs of the global Earth observation market, providing users with high-quality data products. RADARSAT-2 will be able to image at spatial resolutions ranging from 3 to 100 meters with nominal swath widths ranging from 10 to 500 kilometers. In addition, RADARSAT-2 is the first commercial radar satellite to offer multi-polarization, a capability that aids in identifying a wide variety of surface features and targets. The satellite is scheduled for launch in 2007.
SPOT Imagery provided by Mexican Government, through the Ministry of Agriculture, and Radarsat-2 imagery will be provided through the Science and Operational Applications Research for RADARSAT-2 Program (SOAR), coordinated by the Canadian Space Agency.
1-4244-1212-9/07/$25.00 ©2007 IEEE.
3656
Whereas crop-type mapping calls for information at the level of individual fields, crop-condition mapping requires information at the level of specific zones within individual fields. RADARSAT-2 images acquired in the ultra-fine mode will contain more detailed spatial information than any other commercially available space borne SAR data products and are therefore anticipated to advance the potential for detailed crop condition mapping [7]. The objectives of this work are: a) Study the utility of multi-polarized RADARSAT-2 data for crop type classification, biomass assessment and for monitoring crop condition in central Mexico. b) Establish the benefit of combining RADARSAT-2 data and SPOT data towards increasing accuracy of crop condition. c) Assess the linear cross- polarization options (HV and VH) using contrast information and different incidence angles to establish areas of anticipated high and low productivity (crop yield). II.
MATERIALS AND METHODS
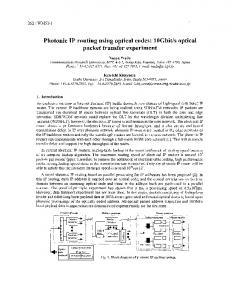
A. Study area The study is located in central part of Mexico, in the State of Mexico and wholly includes the Zinacantepec Municipality. The total surface of the study area is 32,213.7 hectares (322.1 square kilometers). B. RADARSAT-2 and SPOT images utilization This project will use RADARSAT-2 images as soon as they become available to the selected SOAR projects. Various SPOT 5 images are already being used for optical crop type classification. These results will be related to quad-pol radar data considering the characteristics of the RADARSAT-2 parameters. RADARSAT-2 polarization combinations in fine/ultra-fine modes will be tested as to their potential for deriving structural characteristics of corn, crop type, crop condition and crop yield indicators. Field work to measure parameters in pilot corn plots is partially completed for 2007. Leaf area indices (LAI), photosynthetic active radiation (PAR) and other parameters have been obtained. SPOT 5 images with spatial resolution of 2.5 m in the panchromatic mode are being used to discriminate corn form other crops. Derived parameters and field measured parameters are fed to yield prediction models to study the relationships and to produce estimated yield values. This information is used to generate yield maps. The introduction of the selective dual polarization (SDP) mode and, to a greater extent, the quad polarization (QP) mode will increase the potential for obtaining accurate values of selected parameters for crop type and yield determination. In addition, crop-condition mapping is anticipated to benefit from RADARSAT-2’s enhancements of spatial resolution and look direction. The improved applications potential of images acquired in SDP and QP modes results from an increase in the information content with respect to the structural characteristics of the target crops.
C. Methodology and support The list and description of tasks to be executed in this project are: •
Data obtention and processing from SPOT 5 and Radarsat2 images covering the study area.
•
Field work to measure crop parameters in pilot plots, such as LAI and PAR.
•
Test different polarization combinations to derive structural characteristics of corn. Use QP for crop type and crop condition QP ultra-fine for crop yield.
•
Obtain backscatter information for different corn conditions and estimated corn yields, and related it with LAI to obtain models to explain the relationship between these variables.
•
Map crop type, crop condition and crop yield and determine the corresponding accuracies.
Figure 1. Study area
It is well known that the polarization of backscattered microwaves is a function of the polarization of the transmitted microwaves and the structural characteristics of the features observed. Moreover, the polarization of the transmitted microwaves dictates which components of the vegetation and soil contribute to the total amount of energy scattered back to the SAR sensor. Vertically polarized microwaves (V) coupled with the predominant vertical structure of most vegetation contribute to a reduction of the penetration of the signal through the canopy. So VV-polarized radar returns will provide good contrast among crop types that have different vertical canopy structures. Differences in this vertical structure that result from changes in growth stage or health may also be detected in VV-polarized images. Horizontally polarized microwaves (H) tend to penetrate the canopy to a greater extent than vertically polarized waves. So at steep incidence angles HH images tend to provide information about the underlying soil condition. Cross-polarized radar returns (HV or VH) result from multiple reflections within the vegetation volume. C-HV and C-VH images are sensitive to crop structure within the total canopy volume and thus provide information that is complementary to HH and VV imagery. These reported RADARSAT-2 capabilities of its full polarimetric data especially in the QP mode can be expected to extend the sensitivity to crop structural characteristics and hence the potential for crop-type and crop condition mapping will be beyond that of the SDP mode. Images acquired in the QP and ultra-fine resolution modes are expected to contain moderately improved information in support of crop-yield mapping. Accordingly, the application potential of RADARSAT-2 is rated one level above that of RADARSAT-1. As in the case of crop condition mapping, the improved potential of the QP and ultra-fine resolution data products for crop yield mapping can be explained from the increased sensitivity to crop structure and the capacity to obtain within-field zonal information, respectively. The anticipated potential of RADARSAT-2 for crop-yield mapping does not exceed the “limited” rating because the C-band radar signal is known to saturate for larger biomass crops.
1-4244-1212-9/07/$25.00 ©2007 IEEE.
3657
The equipment, software and facilities to support this methodology belong to the Laboratory of Geomatics of the National Research Institute for Forestry, Agricultural and Livestock (INIFAP) in Mexico. The software to be used includes Erdas, ENVI, PCI Geomatics, ArcGis, IDL and ESRIMapObjects. Other resources for field work include technical personnel, 4 pick-up type vehicles, GPS equipments, PDA and mobile-map equipments; Accupar equipment for LAI measurements is available as well as several workstations and other computing and plotting equipment. III.
PRELIMINARY RESULTS
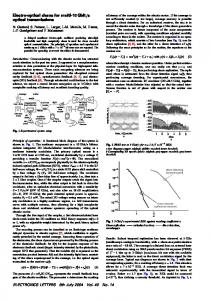
Sixty-one pilot corn plots in the study area have been located and monitored during the 2006 agricultural cycle with GPS equipment. LAI values were obtained in all the plots at 15 day intervals during the growing and flowering phenological phases. Since 2004 SPOT images have been used for agricultural monitoring projects in the Laboratory of Geomatics. Every year, a map showing the spatial distribution of corn for the study area has been generated, supplemented by field data. The cultivated area obtained for the corn crop in 2006 was 9,8333.00 hectares, which amounts for 30.5 percent of the total surface for the corresponding municipality. See Table 1. Analysis of the cultivated areas in 2004, 2005 and 2006 shows a diminishing tendency of the surface due partly to the low market price of the corn crop and also to the continuous expansion of urban areas. The quality of the map data was verified through a confusion matrix [8]. From SPOT data alone the global map accuracy was 78%. It is expected that the map accuracy will improve with the information which will be derived from RADARSAT-2 data complemented with the SPOT results.
TABLE I.
better accuracy than with current methodologies. This will benefit national corn farmers associations and the corn product industry in Mexico; a positive impact is also to be expected for agriculture development and planning activities within the state of Mexico. Government decision making at the federal, state and municipal levels will also benefit.
CORN SURFACE CULTIVATED IN ZINACANTEPEC, MUNICIPALITY, STATE OF MEXICO. Surface (ha)
(%)
9,833
30.5
Others
22,380.7
69.5
Total
32,213.7
100
Cover
Corn
ACKNOWLEDGMENT The authors acknowledge the support of the Mexican Government though the Ministry of Agriculture, for providing the SPOT imagery. REFERENCES [1]
[2]
[3]
[4] [5] Figure 2. Spatial distribution of corn obtained from SPOT 5 image Zinacantepec municipality, Mexico
[6]
This is anticipated from previous work where Landsat 7 and RADARSAT-1 data were fused in an area neighboring the current study area [9]. Since 2007 the cultivated area of the corn crop has already been incremented for this municipality. This is explained due to the increase of the market price for this crop and also due to the growing demand of corn for ethanol fuels in the world markets. This compels the federal government through its ministry of agriculture to continue the increase of the corn cultivation areas to meet the demands of the internal market. The main expected outcome of this research is to gain knowledge about crop type, crop condition and crop yield with
1-4244-1212-9/07/$25.00 ©2007 IEEE.
3658
[7]
[8] [9]
J. C. Waterlow, D. G. Armstrong, L. Fowden and R. Riley, Eds., Feeding a World Population of More than Eight Billion People: A Challenge to Science. Oxford University, 1988. H. McNairn, J. Van der Sanden, J. Brown, J. Ellis, "The potential of RADARSAT-2 for crop mapping and assessing crop condition", 2nd International Conference on Geospatial Information in Agriculture and Forestry, Lake Buena Vista, Florida, vol. 2 , 2000, pp. 81-88. J. Soria-Ruiz and Y. Fernandez-Ordonez, “Prediction of corn yields in Mexico using vegetation indices from NOAA-AVHRR satellite images and degree days,” Geocarto International, Hong Kong, vol. 18-4, 2004, pp. 33- 42. Canada Centre of Remote Sensing, “Applications potential of Radarsat2. A preview”. Van der Sanden J.J. and S.G. Ross Eds. 2001. J.J. Van der Sanden, “Anticipated applications potential of RADARSAT-2 data”, Can. J. Remote Sensing, vol. 30, No. 3, 2004, pp. 369-379. H. McNairn and B. Brisco, “The application of C-band polarimetric SAR for agriculture: a review”, Canadian Journal of Remote Sensing, vol. 30, no. 3, 2004, pp. 525–542. H. McNairn, K. Hochheim and N. Rabe, “Applying polarimetric radar imagery for mapping the productivity of wheat crops”, Canadian Journal of Remote Sensing, vol. 30-3, 2004, pp. 517–524. G. M. Foddy, “Status of land-cover classification accuracy assessment”, Remote Sensing of Environment, vol. 80, 2002, pp.185-201. J. Soria-Ruiz and Y. Fernandez-Ordonez, “Improving land use/cover classification in Mexico fusing optical and radar microwave images”, GIM International 8, vol.18, 2004, pp. 33-35.