Detection by Classification: Ileo-cecal Valve. False Positive ... false positive (FP) findings in computer aided diagnosis (CAD) of colon cancers using CT ...
Correcting Misalignment of Automatic 3D Detection by Classification: Ileo-cecal Valve False Positive Reduction in CT Colonography Le Lu, Matthias Wolf, Jinbo Bi, and Marcos Salganicoff CAD & Knowledge Solutions, Siemens Healthcare, Malvern, PA 19355, USA
Abstract. Ileo-Cecal Valve (ICV) is an important small soft organ which appears in human abdomen CT scans and connects colon and small intestine. Automated detection of ICV is of great clinical value for removing false positive (FP) findings in computer aided diagnosis (CAD) of colon cancers using CT colongraphy (CTC) [1–3]. However full 3D object detection, especially for small objects with large shape and pose variations as ICV, is very challenging. The final spatial detection accuracy often trades for robustness to find instances under variable conditions [4]. In this paper, we describe two significant post-parsing processes after the normal procedure of object (e.g., ICV) detection [4], to probabilistically interpret multiple hypotheses detections. It achieves nearly 300% performance improvement on (polyp detection) FP removal rate of [4], with about 1% extra computional overhead. First, a new multiple detection spatial-fusion method utilizes the initial single detection as an anchor identity and iteratively integrates other “trustful” detections by maximizing their spatial gains (if included) in a linkage. The ICV detection output is thus a set of N spatially connected boxes instead of a single box as top candidate, which shows to correct 3D detection misalignment inaccuracy. Next, we infer the spatial relationship between CAD generated polyp candidates and the detected ICV bounding boxes in 3D volume, and convert as a set of continuous valued, ICV-association features per candidate which allows further statistical analysis and classification for more rigorous false positive deduction in colon CAD. Based on our annotated 116 training cases, the spatial coverage ratio between the new N-box ICV detection and annotation is improved by 13.0% (N=2) and 19.6% (N=3) respectively. An evaluation on large scale datasets of total ∼ 1400 CTC volumes, with different tagging preparations, reports average 5.1 FP candidates are removed at CandidateGeneration stage per scan; and the final CAD system mean FP rate drops from 2.2 to 1.82 per volume, without affecting the sensitivity.
1
Introduction
Colorectal cancer is the second leading, death-causing cancer for western population. Many computer aided diagnosis (CAD) systems [1–3, 5] have been proposed to tackle the colonic polyp detection problem, with better accuracy and sensitivity than radiologist alone. The most critical affecting factor for radiologists
2
to accept the daily usage and adding value of a CAD system is its False Positive (FP) rate per scan or patient, while keep high detection sensitivity. This is also the major difference from a good (helpful) to bad (misleading) CAD system [5]. Out of all FP types, Ileo-Cecal Valve has many bumpy polyp-like substructures which can confuse CAD algorithms and result as one of the most “difficult-toremove” FP subgroup. As reported in the most recent study [6], 18.8% FPs are contributed by ICV structures, for a CAD system operating at 4.7 FPs per scan with reasonable sensitivity rate. Detecting and segmenting small, soft and deformable human anatomic structures (e.g., Ileo-Cecal Valve) in a large 3D image volume (often > 500 slices) is a very challenging task. Ileo-Cecal Valve is highly deformable in shape and location by nature (without rigid attachment as connecting colon and small intestine), which leads to large intra-class shape, appearance and pose variations. In [4], we propose a generic object detection method to localize and segment an anatomic structure, such as Ileo-cecal Valve in abdominal CT volumes, through an incremental parameter learning and registration procedure by sequentially aligning a bounding box with full 3D spatial configuration (i.e., 3D translation, 3D scaling and 3D orientation) towards the real structure. ICV has to be detected at the correct spatial scale range to understand its full context, and disambiguate from local, polyp-like subcomponents. The system diagram of ICV detection is shown in Fig. 1. For robustness, all steps of this detection pipeline leverage and keep multiple hypotheses (as a set of 3D boxes) for the next level until the last stage, which is in the same spirit of robust object tracking using multiple hypotheses [7], sequential Monte Carlo or particle filtering [8]. Exhaustive search of the 9-dimensional parameter space for the global optimal ICV bounding box is not only computationally infeasible, but also can not be trained due to the exponential-complexity negative class sampling issue in high dimensional parameter space. Though a high detection rate is achieved in [4], the spatial coverage ratios between computer detections and the annotated or desirable ICV bounding boxes are in need for improvement (probably inferior to face detection overlapping accuracy in 2D images due to higher dimensional parameter space of 9 versus 4). Especially for FP removal purpose in a CAD system, more spatially accurate detection of ICV leads to better reasoning of the spatial association between polyp, and ICV detections, which permits to remove more ICV false positives1 [5, 6]. In this paper, we present a sequence of significant post-parsing processes of [4], by spatially fusing the multiple ICV detection hypotheses in an “anchorlinking” fashion, constructing statistical features (e.g., distance, spatial-decaying detection probabilities) continuously describing the underlying “candidate-ICV” 1
For example, in our CAD system, overall ≈ 0.76% FP candidates survive after the final classification, while as a specific FP category, the survival rate of ICV candidates is significantly higher as 7.83%. From the other viewpoint, ICV candidates form ≤ 1% of the overall polyp candidates at CG level, but more than 10 ∼ 15% of the final system output FPs are composed of ICV (causing) FPs, if no explicite ICV candidates/FPs removal module is applied.
3
associations, and building a discriminative classifier using new ICV features to remove false positives, while keeping the overall polyp detection sensitivity unchanged. The “anchor-linking” multiple detection fusion is related to component based object detection methods [9, 10], but different in maximizing the trustful object region recovery by linking a few spatially correlated, “strong” detection candidates, while [9, 10] aggregate multiple part-based detections to form the whole-object identification. The feature extraction and classification treatment from detection, enables more rigorous statistical analysis and removes about 90% more ICV type (polyp) FPs (0.38 versus 0.2 per volume, due to ICV existence) than improved N-box detection (n=3). Compared with [4], FP removal rate is nearly 300% (i.e., 0.38 versus 0.13 per scan). The computational overhead of post-parsing is neglectable compared with the ICV detection process [4].
2
Materials and Methods
In this section, we will first review the two-staged workflow of ICV detection by prior learning and incremental parameter learning [4]. Then a multiple detection fusion method, to improve the spatial coverage between the detected ICV area (a union of bounding boxes) and the true ICV occupying area, is described. Finally we map the spatial association between polyp detection candidates and the updated ICV detection output, to a set of four features including {IndicatorICV , P robICV , DistICV , P robDecayICV } or {Indicator, P rob, Dist, P robDecay}, by incorporating both localization (geometry) and detection (probability) information, and feed them into statistical analysis and classification for ICV-type FP reduction. 2.1
Progressive Ileo-cecal Valve Detection in 3D
ICV detection is very challenging due to ICV’s large variations in terms of its internal shape/appearance and external spatial configurations: (X, Y, Z; Sx , Sy , Sz ; ψ, φ, ω), or (ΩT ; ΩS ; ΩR ). To address these difficulties, we develop a two-staged approach that contains the prior learning to prune ICV’s spatial configurations in position and orientation, followed by the position, size and orientation estimation of incremental parameter learning. The prior learning is inspired by the fact that, if likely hypotheses ICV’s orifice can be found, its position in ΩT can be constrained, then no explicitly exhaustive searching of position is needed. The ICV orifice has an informative, but not uniquely distinctive, surface profile that can possibly indicates ICV locations. It is also known that ICV orifice only lies on the colon surface that is computed using a 3D version of Canny edge detection. Thus we can prune all voxel locations inside the tissue or in the air for even faster scanning. Then given detected ICV orifice position from prior learning, we can further use this to constrain ICV itself’s location for efficient scanning, as described in [4]. Fig. 1 shows the diagram of our full detection system of two stages and five individual steps. Each step of encoding process is formulated as a general binary classification problem, and is specifically implemented using probabilistic
4
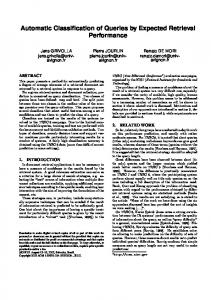
Fig. 1. System diagram of Ileo-Cecal Valve detection, with prior learning (upper block) and incremental parameter learning (lower block).
boosting tree algorithm (PBT ) [11]. To learn the object (e.g., ICV) appearance model, we employ 3D steerable features [12] which are composed by a number of sampling grids/points where 71 local intensity, gradient and curvature based features are computed at each grid. The whole sampling pattern models semilocal context. In contrast to popular 3D HAAR features [13], only the sampling grid-pattern of steerable features need to be translated, rotated and re-scaled instead of data volumes. It allows fast 3D data evaluation and has shown to be effective for object detection tasks [12]. The separation of sampling grid pattern and local 71 gradient/curvature features allows the flexibility of different geometric structure designs of grid-pattern as spatial assembles of unchanged local features. Particularly, an axis-based pattern is proposed for detecting ICV’s orifice at step 1, and a box-based pattern for parsing the ICV orientation, scale and size at following steps, with total 5751 or 52185 local features for boosting respectively. If there is only one existing object per volume (such as ICV) and the training function can be perfectly learned by a classifier at each step, setting only one detection candidate (e.g., M = 1) per step is sufficient to achieve the correct detection. In practice, we set M = 50 ∼ 100 for all intermediate detection steps to improve robustness. It means that we maintain multiple detection hypotheses until the final result. For the description of how training parameters are obtained in this multi-stage detection hierarchy, refer to [4] for details. Improvements: ICV contains many polyp-like local structures which often survive through colon CAD systems. By localizing a spatially accurate bounding box of ICV, this type of ambiguous false positives as generated by an initial candidate-generation (CG) process (within the above detected bounding box), can be removed. For this task, 1), we further enhanced the ICV orifice detection stage (as the first step in Fig. 1) by adding all labeled polyp surface voxels into
5
its negative training dataset, which results a propose-specific and more discriminative training against losing polyps or reducing sensitivity. Other stages are consequentially retained in the same way. 2), Non-Maximum suppression is also performed after the prior learning by only keeping the top ICV box candidate at each different location. This further increases the spatial sampling and computational efficiency, as more spatial regions will be exploited by later training and classification stages with the same computational budget, or the number of kept samples. Some positive ICV detections are illustrated in Fig. 2. The processing time varies from 4 ∼ 10 seconds per volume on a P4 3.2G machine with 2GB memory.
(a)
(b)
(c)
(d)
(e)
(f)
(g)
(h)
Fig. 2. (a,b) An example of ICV detection result from two viewpoints. The red box is the annotation; the green box is the detection. (c,d,e,f,g,h) Examples of ICV detection results from unseen clean colon CT volumes (c,d,e) and unseen solid (f) or liquid tagged (g,h) colon CT volumes.The red box is the final detection result where no annotation available. Note that only a CT subvolume surrounding the detected ICV box is visualized for clarity. This picture is better visualized in color.
2.2
Contextual N-Box ICV Detection by Spatial Fusion
To obtain a more precise 3D ICV region from detection, a contextual N-box model is employed. 1), We use the single ICV detection box B1 as an anchor to explore other reliable expansions. The trust or reliability is guaranteed by maintaining other boxes with both posterior probabilities above a high threshold ˆi } (except and good overlaps with the anchor box. For all other hypotheses {B B1 ) returned in the last step of detection, we first apply a prefilter and only ˆi ) ≥ γ1 and ρ(B ˆi ) ≥ ρ1 where retain “trustful” candidates satisfying γ(B1 , B ˆi ) returns γ(•, •) computes the spatial overlap ratio between two boxes and ρ(B ˆi from above [4]. The two constraints the posterior detection probability of B
6
guarantee that B2 is spatially correlated with B1 (γ1 = 0.5) and is a high quality ICV detection by itself ρ1 = 0.8. 2), Then we sort them according to their spatial ˆ i − B1 T B ˆi ) and the box that gives the largest gain is selected as gains V ol(B the second box B2 . Our boxes are fully mathematically parameterized which allows fast evaluation of voxel overlapping. 3), By taking B1 and B2 as a union S Boxd = B1 B2 , it is straightforward to expand the model for N-box ICV model ˆi − Boxd T B ˆi ). The union Boxd grows by with N > 2, by maximizing V ol(B adding one new winning box per iteration. Let Boxa be the annotated bounding box of the ileo-cecal valve and Boxd be the detected N-Box. The spatial overlap ratio between Boxa and Boxd is defined as T V ol(Boxa Boxd ) S (1) γ(Boxa , Boxd ) = V ol(Boxa ) V ol(Boxd ) where V ol() is the box-volume function (eg. the voxel number inside a box). The spatial coverage ratio of Boxd and Boxa is defined as T V ol(Boxa Boxd ) α(Boxa , Boxd ) = (2) V ol(Boxa ) which describes the percentage of the annotated ICV area covered by the detection Boxd . In practice, the number N of boxes in Boxd can be determined by cross-validation, by maximizing α(Boxa , Boxd ) under the constraint of maintaining γ(Boxa , Boxd ) at high level. α(Boxa , Boxd ) is the direct performance measure, as the percentage of the true ICV volumetric region Boxa recovered by Boxd , which impacts on the ratio of ICV causing FPs in Boxa that can be removed by Boxd instead. High overlap ratio γ(Boxa , Boxd ) as Jaccard similarity, keeps detection Boxd highly confident against ground truth Boxa . A balance between α(Boxa , Boxd ) and γ(Boxa , Boxd ) needs to be achieved. A few illustrative examples of multi-box ICV Detection are shown in Fig. 3. 2.3
Features and ICV False Positive Classification
Given the ICV detection output Boxd = {Bi }i=1,2,...,N and the spatial locations {Lj } of a set of polyp candidates (in the order of hundreds per volume), we first compute the Euclidean distances (Geodesic distance is more desirable but with higher computational cost; Euclidean is a close approximation in low distance range) for each of polyp candidate against Boxd as Dist(Lj , Boxd ) = min Dist(Lj , Bi ) i
(3)
Then, the generic “point-to-box” distance in 3D is converted as a standard “point-to-triangle” distance because the box is a spatially convex set including all voxels inside. The triangle is found by selecting the set of three box vertices Bi,k , k = 1, 2, 3 with the smallest “point-to-point” Euclidean distances k Bi,k −Lj k according to Lj . Thus Bi,k , k = 1, 2, 3 may vary against different Lj . Finally the “point-to-triangle” distance is calculated using the standard geometric algorithm [14] and we denote Dist(Lj , Boxd ) as DistjICV for any jth polyp
7
(a)
(b)
(c)
(d)
(e)
(f)
Fig. 3. Multi-box ICV Detection results (N=3) with clean preparation (a,b,c) and tagged preparation (d,e,f). Note that rugged surface is more visible in (d,e,f) under tagged preparation which potentially causes more challenges for ICV detection or degrading on localization accuracy. Notice that the spatial coverage of ICV detection boxes against the true ICV area improves as N increases from 1 to 2, 3. The first, second, and third detection box is color-coded as red, green, and blue respectively. This picture is better visualized in color.
8
candidate. Note that if Lj is determined inside any box ⊂ Boxd , Distj = 0 will be automatically set, without any distance calculations. Furthermore, a binary j indicator {IndicatorICV } is also derived from DistjICV Indicatorj =
�
T rue, if Distj = 0; F alse, otherwise.
(4)
The confidence of ICV detection procedure can also be explored as P robICV volumewise, regardless of different CG candidates. Lastly, by combining the information of the overall detection probability P robICV per volume (only one ICV per abdominal scan) and {DistjICV } per candidate, a new hybrid feature j P robDecayICV is computed as P robDecay j = P rob × exp(−Distj /σ)
(5)
It simulates the spatially decaying effect of ICV detection probability P robICV propagating from Boxd to the location Lj where σ controls the decaying speed factor and is determined by cross-validation, or multiple σ can be employed for decaying with respect to different spatial scales. P robDecay j integrates the cues of distance Distj , detection posterior probability P rob and the spatial scale σ, where σ can be set by optimizing P robDecay j ’s classification performance (e.g., Fisher score [15]). As seen later, this feature demonstrates the best effectiveness on modeling the relationship or association between polyp candidates and the detected ICV, and removing ICV type FPs via classification, out of four features. Using Geodesic distance to replace Distj is probably more sensible and accurate for modeling the confidence propagation over surface, because all anatomical structures (e.g., ICV, polyp) interested in CTC lies on colonic surface, and surface geodesic coordinates normally serves as their spatial locations. This is left for future work. In summary, we obtain a set of four features {Indicatorj , P rob, Distj , P robDecay j } for any jth polyp candidate, and these features can be used to train a classifier to report whether a candidate is truly associated with ICV rather than a polyp. Of course, these four features are not statistically independent, but in section 3, their joint discriminative capability is shown to be higher than each individual, and thus is finally used for the best classification performance on filtering out ICV type FPs, using Quadratic/Linear Discriminant Analysis classifiers [15]. Previous Work: The closest previous work are by Summer et al. [16, 3] which however is drastically different from ours in two aspects. (1) For localization of ICV, [3] relies on a radiologist to interactively identify the ICV by clicking on a voxel inside (approximately in the center of) the ICV, as a requisite, manual initialization step, followed by classification process. (2) For classification, some human designed heuristic rules based on ICV volume and attenuation thresholds are utilized. Refer to [16, 3] for details. Their overall sensitivity of ICV detection is 49% and 50% based on the testing (70 ICVs) and training datasets (34 ICVs) [3], respectively.
9
3
Experimental Results
Detection Performance: Our ICV detection process is trained with an annotation dataset of 116 volumes under clean-prep, where each ICV per volume is precisely bounded using a 3D box with nine degrees of freedom (3D location, orientation and scale) by two experts, as shown in Fig. 1. 1), Our initial experimental assessment in training show that 2-box model improves the mean coverage ratio α(Boxa , Boxd ) from 75.6% to 88.6%. When N = 3, the α(Boxa , Boxd ) reaches 95.2%. γ(Boxa , Boxd ) are 72.7%, 85.2%, 86.1% for N = 1, 2, 3 and starts to decrease slightly for N > 3. Finally, N is chosen to be 3. 2), For testing cases where there are no annotation of ICV bounding boxes available, hence we evaluate the ICV detection rates by inspecting each “anchor” box returned by our ICV detector, and labeling it as true or false, using two unseen testing datasets of 526 volumes (clean-prep) and 689 volumes (fecal tagging-prep including both iodine and barium preparations) respectively. Siemens, GE and Philips scanners are used for image acquisition, under different imaging protocals, from 10+ medical sites in Asia, Europe and USA. The detection rates are 91.3% and 93.2% for clean and tagged datasets. False Positive Detection: FP deduction is also tested on our clean and tagged training/testing datasets. There is no significant statistical performance difference among different datasets, and the detailed analysis and results on tagged testing dataset are reported below. The ICV detection can be implemented as both pre-filter and post-filter for our existing CTC CAD system. In post-processing, only those candidates that are labeled as “Polyp” in the final classification phase are used for screening; while as pre-filter, all candidates output by an initial Candidate-Generation (CG) scheme are employed. With N-box ICV detection improvement, the final number of false positives drops from 2.2 fp/volume to 2.0 fp/volume (removing FPs with Distj = 0 or Indicatorj = true, 90% improvement), without reducing the overall sensitivity of the CAD system. For N = 1, the detection based removal [4] in average rejects 0.13 (or 5.91%) FPs per volume. When used as ICV pre-filter, the average FP removal is 3.1 per volume. Compared with N = 1 in [4], multiple-box (N = 3) ICV FP classification process removes 62.5% more CG candidates for this dataset. FP histogram of the tagged testing dataset of 412 volumes, before and after ICV post-filter, demonstrates the advantageous performance impact of using multi-detection fusion, as shown in Fig. 4. The lower histogram has more mass moving towards the left (as smaller FP numbers). False Positive Classification: We first evaluate Fisher Discriminant Scores (FD) of any continuous valued feature f ∈ {Distj , P robDecay j } over CG candidates, defined as (f¯+ − f¯− )2 (6) J(f ) = 2 + σ (f ) + σ 2 (f − ) where f¯+ and f¯− denote the mean; σ 2 (f + ) and σ 2 (f − ) represent the covariance of f distribution on positive {f + } (polyp) and negative {f − } (non-polyp) classes.
10
Fig. 4. Volume-FP count histograms of tagging testing dataset, before (UPPER) and after (LOWER) N-box ICV post-filter processing.
P robDecay j (σ = 10mm) returns higher FD score2 of 0.0909 than Distj . The feature’s Kernel Density Estimate plots are drawn in Fig. 5. This means that the hybrid feature P robDecayICV can describe underlying soft “candidate-ICV affiliations” more precisely and is probably more effective on removing more ICV related FPs, via inferring both spatial and detection probability information. Next, j we train a Linear Discriminant Classifier on {P rob, Distj , {P robDecayσ=5,10,15,20 }} of all candidates using tagged training dataset and obtain the projection {φj } as a new “summarization” feature, which indeed has a better FD score of 0.171 and σ = 5, 10, 15, 20 simulates the multiscale effect of P robDecay j . {φj } is further thresholded for recognizing ICV type FPs from polyp candidates. Based on this, we report an average of 5.1 false positives removed per volume at CG stage; and the final CAD system FP rate also decreases from 2.2 to 1.82 per volume (or, 17.2% of all FPs), for tagged testing dataset. The sensitivities remain the same at both stages. Compared with the results of binary decision Distj = 0 with N = 3, the performance improvements of leveraging the continuous feature φj , are 64.5% and 90.6% at CG or final system level, respectively. In [6], 18.8% of 4.7 FPs is caused by ICV which is 0.87 per volume. The numerical results of FP histograms in tagged testing dataset, without and with the classification ICV post-filter using {φj }, are given in Table 1. This improves our previous result of False Positive Detection as in Fig. 4. It is clearly noticeable more volumes have even lower (per-volume) FP rates. From our further evaluation, this improvement also generalizes well to clean training and testing datasets, with similar 2
Since the majorities of both positive and negative distributions are out of the realm of ICV spatial occupations, the absolute FD scores are not very high generally.
11
Fig. 5. Kernel Density Estimate plots of the spatial-probability feature P robDecay for positive (polyp) and negative (non-polyp) classes, with the fisher score 0.0909.
observation obtained. As a post-processing, the additional computation expense over [4] is approximately 1%. False Positive Histogram Without ICV Filter With ICV Filter 0 62 [15.05%] 90 [21.84 %] 1 113 [27.43%] 129 [31.31 %] 2 102 [24.76%] 92 [22.33 %] 3 54 [13.11%] 40 [9.71 %] 4 33 [8.01%] 22 [5.34 %] 5 22 [5.34%] 17 [4.13 %] 6 9 [2.18%] 11 [2.67%] 7 10 [2.43%] 8 [1.94%] 8 3 [0.73%] 1 [0.24%] 9 2 [0.49%] 2 [0.49%] ≥ 10 2 [0.49%] 1 [0.24%] Table 1. Volume-FP count histograms of tagging testing dataset, without and with enhenced ICV post-filter on {φj }.
4
Discussion
In this paper, we propose a sequential “anchor-linking” approach on multiple detection hypotheses, to improve the alignment accuracy of automatic 3D detection for Ileo-cecal Valve. The final ICV detection output is a set of spatially connected N-boxes where our method is generic and applicable to other 3D/2D
12
multi-hypothesis detection problems [9, 10, 7, 8], without restricting to [4]. Then we derive continuous valued features (e.g., {Distj , P robDecay j }) more precisely describing the underlying “candidate-ICV” associations, which permits further statistical analysis and classification, converting from binary detections. Significant performance improvement is demonstrated on ICV-relevant false positive reduction rates in CT Colonography, compared with previous work [4, 16, 3], without sacrificing polyp detection sensitivity.
References 1. Yoshida, H., Dachman, A.H.: Cad techniques, challenges, and controversies in computed tomographic colonography. Abdominal Imaging 30 (2005) 26–41 2. Bogoni, L., Cathier, P., et al.: Cad for colonography: A tool to address a growing need. The British Journal of Radiology 78 (2005) 57–62 3. O’Connor, S., Summers, R., Yao, J., et al.: Ct colonography with computer-aided polyp detection: volume and attenuation thresholds to reduce false-positive findings owing to the ileocecal valve. Radiology 241 (2006) 426–432 4. Lu, L., Barbu, A., Wolf, M., Liang, J., Bogoni, L., Salganicoff, M., Comaniciu, D.: Simultaneous detection and registration for ileo-cecal valve detection in 3d ct colonography. In: European Conference on Computer Vision. (2008) 465–478 5. Park, H., et al.: Computer-aided polyp detection on ct colonography: Comparison of commercially and academically available systems. In: RSNA. (2007) 6. Slabaugh, G., Yang, X., Ye, X., Boyes, R., Beddoe, G.: A robust and fast system for ctc computer-aided detection of colorectal lesions. Algorithms: special issue on Machine Learning for Medical Imaging 3(1):21-43 (2010) 7. Cox, I., Hingorani, S.: An efficient implementation of reid’s multiple hypothesis tracking algorithm and its evaluation for the purpose of visual tracking. IEEE Trans. on PAMI 18(2) (1996) 138–150 8. Isard, M., Blake, A.: Condensation - conditional density propagation for visual tracking. International Journal of Computer Vision 29(1) (1998) 5–28 9. Zheng, Y., Lu, X., et al.: Robust object detection using marginal space learning and ranking-based multi-detector aggregation: Application to left ventricle detection in 2d mri images. In: IEEE Conf. on CVPR. (2009) 10. Wu, B., Nevatia, R., Li, Y.: Segmentation of multiple, partially occluded objects by grouping, merging, assigning part detection responses. In: IEEE CVPR. (2008) 11. Tu, Z.: Probabilistic boosting-tree: Learning discriminative methods for classification, recognition, and clustering. In: IEEE ICCV. (2005) 12. Y. Zheng, A. Barbu, B.G.M.S., Comaniciu, D.: Fast automatic heart chamber segmentation from 3d ct data using marginal space learning and steerable features. In: IEEE ICCV. (2007) 13. Z. Tu, X. S. Zhou, A.B.L.B.D.C.: Probabilistic 3d polyp detection in ct images: The role of sample alignment. In: IEEE CVPR. (2006) 14. Eberly, D.: 3d game engine design : A practical approach to real-time computer graphics, 2nd edition. Morgan Kaufmann (2000) 15. Duda, R., Hart, P., Stork, D.: Pattern Classification (2nd ed.). Wiley Interscience (2000) 16. Summers, R., Yao, J., Johnson, C.: Ct colonography with computer-aided detection: Automated recognition of ileocecal valve to reduce number of false-positive detections. Radiology 233 (2004) 266–272