Correlation-Aware Virtual Machine Allocation for Energy-Efficient Datacenters Jungsoo Kim
Martino Ruggiero
David Atienza
Marcel Lederberger
Embedded Systems Lab (ESL), EPFL Email: {jungsoo.kim,martino.ruggiero,david.atienza}@epfl.ch
Abstract—Server consolidation plays a key role to mitigate the continuous power increase of datacenters. The recent advent of scale-out applications (e.g., web search, MapReduce, etc.) necessitate the revisit of existing server consolidation solutions due to distinctively different characteristics compared to traditional high-performance computing (HPC), i.e., user interactive, latency critical, and operations on large data sets split across a number of servers. This paper presents a power saving solution for datacenters that especially targets the distinctive characteristics of the scale-out applications. More specifically, we take into account correlation information of core utilization among virtual machines (VMs) in server consolidation to lower actual peak server utilization. Then, we utilize this reduction to achieve further power savings by aggressively-yet-safely lowering the server operating voltage and frequency level. We have validated the effectiveness of the proposed solution using 1) multiple clusters of real-life scale-out application workloads based web search and 2) utilization traces obtained from real datacenter setups. According to our experiments, the proposed solution provides up to 13.7% power savings with up to 15.6% improvement of Quality-of-Service (QoS) compared to existing correlation-aware VM allocation schemes for datacenters.
I. I NTRODUCTION The soaring demand for computing has produced as collateral undesirable effect a surge in power consumption of servers and datacenters [1]. Server consolidation [3], which minimizes the number of active servers by packing workloads, or virtual machines (VMs) in a virtualized environment, into the minimal number of active servers, is one of the widely used techniques to reduce the power consumption of datacenters. However, in order to satisfy the performance demand of applications running on servers, server consolidation is usually conducted assuming the worst-case (or peak) utilization [2], [3]. Thus, in order to achieve power consumption without any significant Quality-of-Service (QoS) degradation, many works have presented aggressive consolidation schemes, which pack VMs based on off-peak (e.g., 90th/95th/99th percentile) of server utilization [4], [5]. Recently, correlation of resources utilization patterns among VMs are also exploited, such that, un-correlated VMs are co-located into a server to enable overprovision of VMs under negligible QoS degradation [6]–[9]. Nonetheless, these existing solutions are mostly designed for high-performance computing (HPC) applications and do not This work described in this paper has been partially supported by the PMSM: CT Monitoring research grant for ESL-EPFL funded by Credit Suisse AG and an ERO Research Grant from Oracle for ESL-EPFL.
Datacenter Facility Management, Credit Suisse AG Email:
[email protected]
work well for emerging cloud (or scale-out [10]) applications (e.g., web search, MapReduce, etc.) due to the lack of considerations of the characteristics of the scale-out applications. In particular, the characteristics of scale-out applications are quite different from traditional HPC workloads in both macroscopic and microscopic scales. At the macroscopic scale, the application, first, is user-interactive; thereby, the amount of required computing capacity is highly variable and fastchanging [5] due to the dependence with external factors, e.g., number of clients/queries, etc. Second, the responsiveness (or latency) should come at the first criteria to be satisfied as the level of user satisfaction leads to the success of the business [11]. Finally, the amounts of required CPU and memory resources are usually far beyond the level that a single server can sustain. Hence, massively parallel nodes are cooperatively working by forming a cluster architecture [12]. For instance, in a web search application, a big set of search indexes is divided into multiple smaller datasets, and then allocated into multiple VMs (or servers), each of which is called an index searching node (ISN). Once a query is arrived, each ISN independently searches matched data with the allocated dataset and a master (i.e., front-end) node gathers the search results from the multiple ISNs, then sends the results to clients. At the microscopic-scale, the characteristics of scaleout applications are well studied in [10]. Among various characteristics, the memory footprint is far beyond the amount an on-chip cache can sustain; thereby, increasing the on-chip cache size only produces negligible performance improvement. Because of these aforementioned discrepancies with HPC workloads, existing datacenter power management solutions, which neglect or only partially consider the characteristics of scale-out applications, do not exploit all the opportunities to achieve global power savings. In this paper, we propose a dynamic power management solution for servers hosting these new scale-out applications, especially accounting for the correlation information among VMs, while satisfying peak resource requirements. Compared to existing correlation-aware solutions, the contributions of this work are as follows: • We analyze workload characteristics of scale-out applications and present new opportunities for power management in virtualized server environments. • We present a novel power management solution jointly
c 978-3-9815370-0-0/DATE13/ 2013 EDAA
utilizing server consolidation and voltage and frequency (hereafter, v/f) scaling considering the characteristics of scale-out applications, especially correlation among VMs. • We validate the applicability of the proposed solution with the real deployment of multiple distributed web search applications taken from CloudSuite [10]. • We validate the effectiveness of the proposed solution to larger scale problems using the utilization traces obtained from acutal datacenters, which provides up to 13.7% power savings and 15.6% QoS improvement compared to existing correlation-aware schemes [6]. This paper is organized as follows. Section II reviews the related work on datacenter power management. Section III analyzes the characteristics of scale-out applications and revisits the power management approaches considering the characteristics. Section IV proposes a novel VM allocation and v/f scaling solutions. Section V presents our experimental results, followed by conclusions in Section VI. II. R ELATED WORK Various server consolidation solutions are proposed based on per-VM workload characteristics, i.e., the peak utilization of VMs [2], [3] and off-peak (e.g., 90th/95th/99th percentile) values observing that the peak utilization happens rarely and it is much higher (more than 2x) than 95th and 99th percentile values [4], [5]. To achieve further power savings while maintaining QoS level, joint relationships among VMs, like correlations, have been exploited in recent works [6]–[9]. In [6], Verma et al. presented a clustering-based correlationaware VM placement solution. The solution first clusters VMs, such that, the envelops of VMs’ CPU utilization (defined as a binary sequence where the value becomes ‘1’ when CPU utilization is higher than the off-peak value, otherwise, ‘0’) included in different clusters do not overlap. Then, it allocates VMs to servers in order to co-locate VMs in different clusters by provisioning VMs based on their off-peak utilization demands (e.g., 90th percentile), while reserving a shared peak buffer to handle resource demand higher than the off-peak value for all co-located VMs. However, this approach is applicable only when the envelops of VMs are stationary and distinctively different one from another, thereby, producing multiple clusters. Hence, it does not work well with scaleout applications with non-stationary and fast-changing VM behaviors. Then, in [7], Meng et al. proposed a joint-VM sizing technique that pairs two un-correlated VMs into a superVM and provision super-VMs by predicting the the aggregated workloads. However, once super-VMs are formed, this solution does not consider the correlations of VMs within a same superVM anymore. Thus, it may lose the chance of further power savings by leveraging time-varying correlations in scale-out applications. In [9], Halder et al. extends the scheme such that aggregated workload of multiple VMs can be utilized for VM placement. However, this solution can be applicable only when future servers’ utilization is perfectly known. In summary, all existing solutions do not properly capture the characteristics of scale-out applications. Thus, we need
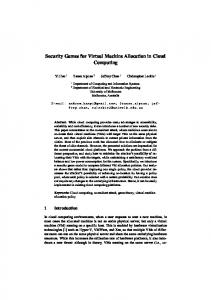
to develop a power management solution for datacenters by accounting for this specific characteristics to achieve suitable power savings while satisfying performance requirements. III. N EW OPPORTUNITIES FOR POWER MANAGEMENT Power management solutions for datacenters hosting scaleout applications should be different from the case of hosting HPC applications due to the distinctive characteristics of scaleout applications. In this section, we present three principles of dynamic power management solutions for datacenters hosting the scale-out applications based on our observations. All data presented in this section is measured using an AMD Opteron 6174 architecture within a DELL PowerEdge R815 server. A. Conservative resource provision with v/f scaling Scale-out applications are user-interactive. Therefore, responsiveness, in terms of latency, is the first priority to be met [11]. Moreover, every application (or VM) is assumed to be equally important in clouds. Thus, we should conservatively provision VMs based on the peak (or Nth percentile according to QoS requirement) resource demand of each VM. The required QoS level can be achieved by assigning the right number of cores because the performance is highly scalable to the number of allocated cores due to the high parallelism of such applications. Moreover, the resource demand is timevarying and is mostly lower than the value used for the core allocation. However, as described in [5], dynamic power gating (turning on/off cores) cannot be applicable to such applications due to the significant performance degradation caused by the long transition latency between power modes and fast changes of resource demands. Thus, dynamic v/f scaling is the only solution to achieve power savings while satisfying the performance requirement. Motivated by these observation, the proposed solution allocates the number of cores for each VM according to its peak (or off-peak depending on QoS level) resource demand to guarantee equal QoS levels to all VMs while scaling v/f level to achieve power savings. B. Sharing cores among co-located VMs The amount of required CPU utilization varies as the amount of user requests to servers changes over time. Fig. 1 shows the CPU utilization traces for two VMs, each of which is an index serving node (ISN), in a single web search cluster to process queries requested from the varying number of clients. As shown in the figure, the CPU utilizations of both VMs are highly synchronized with the variation of the number of clients. Furthermore, loads between VMs in a cluster are not perfectly balanced because the CPU utilization depends on the amount of matched results corresponding to a user request. Thus, we can improve the resource utilization by sharing cores among multiple VMs, such that they can flexibly use cores depending on their time-varying resource demands. Furthermore, as analyzed in [10], the overhead of sharing cores is negligible due to the large memory footprint of scale-out applications, i.e., far beyond the capacity of on-chip caches. Table I shows the measured performance metrics used of a web search application when it is co-located with various applications (from PARSEC benchmark suite). We compared
VM2
Number of clients
VM1
Fig. 1. Variations of CPU utilization of two index searching nodes (ISNs) with respect the number of clients TABLE I P ERFORMANCE METRICS OF A WEB SEARCH APPLICATION CO - LOCATED WITH A VM RUNNING PARSEC BENCHMARK : NUMBERS IN PARENTHESIS SHOW THE CASE WHEN A WEB SEARCH APPLICATION IS RUNNING ALONE
w/ Backshcoles w/ Swaptions w/ Facesim w/ Canneal
IPC 0.76 (0.75) 0.75 (0.77) 0.70 (0.70) 0.76 (0.78)
L2 MPKI 2.38 (2.40) 2.32 (2.43) 2.41 (2.36) 2.46 (2.43)
L2 miss rate (%) 11.28 (11.57) 11.02 (9.63) 11.41 (11.31) 11.76 (11.67)
instruction per clock cycles (IPC), L2 miss-per-kilo-instruction (MPKI), and L2 miss ratio (%). The values are obtained using Xenoprof patched for the AMD15h Bulldozer architecture [14]. The numbers in parenthesis show the case before colocation. As can be seen, there are only negligible variations over all the metrics, which correspond to a negligible performance degradation due to cores sharing. Motivated by these observations, the proposed solution allocates VMs to servers such that all co-located VMs share cores assuming that the performance degradation is negligible. C. Correlation-aware VM placement Due to the distributed operations of multiple VMs in a cluster, we can observe a high correlation within a cluster of scale-out applications, called intra-cluster correlation, rather than the correlation among different clusters (or services) targeted in other correlation-aware scheme [6]–[9]. In Fig. 1, we can observe the intra-cluster correlation between two VMs in a cluster, both of which are strongly synchronized with the variation of the number of clients. Thus, the proposed solution takes into account the pervasive correlation in scaleout applications, i.e., within a cluster as well as among clusters, such that correlated VMs are not co-located. IV. C ORRELATION - AWARE POWER MANAGEMENT In this section, we present the proposed datacenter power management solution based on the claims in the previous section. First, we define a cost function to efficiently quantify the level of correlation used in the proposed VM placement (Section IV-A). Second, we propose the correlation-aware VM allocation scheme (Section IV-B) while sharing cores among co-located VMs. Finally, we provide a way to scale the v/f level to achieve power savings without any QoS degradation (Section IV-C). Note that we assume that servers are homogeneous, and where each of them consists of Ncore cores with multiple frequency levels. A. Efficient correlation measure for VM allocation The correlation of used CPU utilization between two VMs is mostly quantified with Pearson product-moment correlation
coefficient, or Pearson’s correlation [8], which is calculated as the ratio of covariance of the two random variables to the product of their standard deviations. However, the overhead to calculate the metric for a certain time interval is high for a short time period because the computation is concentrated at the end of the time period, as it utilizes the average values of CPU utilization samples, which are collected during each time period. In addition, Pearson’s correlation is also partly inefficient because the value reflects correlation throughout the corresponding time interval, even though we only require the correlation at (off-)peak utilizations in VM placement. To overcome the drawback and inefficiency in this metric, we propose a new cost function to quantify correlation between two VMs (in terms of CPU utilization), as follows: Costvm i,j =
u ˆcpu (V Mi ) + u ˆcpu (V Mj ) u ˆcpu (V Mi + V Mj )
(1)
where Costvm i,j represents the newly defined correlation measure between V Mi and V Mj . u ˆcpu (V Mi ) is a reference utilization of V Mi , which is either the peak or the Nth percentile value depending on QoS requirement. The numerator represents the worst-case peak CPU utilization when the peaks of two VMs coincide, while the denominator is an aggregated actual peak utilization when V Mi and V Mj are colocated into a same server. Thus, the higher Costvm i,j , the lower correlation between V Mi and V Mj . Moreover, we can update the values at each sampling period of utilization. Thus, we can save memory space to store all samples as well as evenly distributing computational effort to measure the correlation across a certain time horizon. Using our new Costvm i,j function, we can model correlations vm among all VMs by constructing a 2-D matrix, namely, Mcost vm where the (i,j)-th element corresponds to Costi,j . B. Correlation-aware VM allocation We allocate VMs such that the correlation among the allocated VMs in Serveri , i.e., Valloc = {V Mi,1 , · · · , V Mi,nvm } i i where nvm is the number of VMs allocated to Server , is i i minimized, while the sum of u ˆcpu (V Mi,j ) in the server does not exceed the total CPU capability of the server, i.e., Capi , as well as the number of the active servers is minimized. The correlation of Serveri is defined as shown in Eqn. (2): ! nvm N i vm X X Costvm server j,k vm Costi = wi,j · (2) nvm −1 i j=1 k=1&k6=j
vm wi,j
where represents a weight of V Mi,j , defined as the ratio of u ˆ(V Mi,j ) to the sum of u ˆ(V Mi,j )’s of all co-located VMs in Serveri . The problem of finding optimal sets of VMs is a well-known bin-packing problem [15]. To reduce the solution complexity, we propose a solution based on a First-Fit-Decreasing heuristic as shown in Fig. 2. Our proposed algorithm is periodically invoked at every tperiod . The algorithm is largely divided into two phases: 1) UPDATE (lines 1∼8) and 2) ALLOCATE (lines 9∼18). In the UPDATE phase, we initialize parameters and update CPU utilization statistics. Then, we allocate VMs to servers in the ALLOCATE phase.
UPDATE
Y=X
ALLOCATE Fig. 2. The proposed correlation-aware VM placement consisting of UPDATE and ALLOCATE phases
In the UPDATE phase, we first initialize a set of unallocated VMs (Vunalloc ), sets of allocated VMs (Valloc ), remaining i capacity (Remi ) for all servers, and a correlation threshold (T Hcost ) in lines 1∼4. Second, we predict the workload based on history, as we previously prepared in [15] (line 5). Third, we sort VMs in Vunalloc in descending order of predicted u ˆcpu (V Mi ) to reduce the fragmentation of the bin-packing vm by updating the problem (line 6). Fourth, we update Mcorr vm Costi,j for all VM pairs (line 7). Finally, we determine the ˜server , as presented number of estimated active servers, i.e., N in Eqn. (3) (in line 8): PNvm ˜ u ˆcpu (V Mi ) ˜ Nserver = i=1 (3) Ncore ˜ ˜server is where u ˆcpu represents an estimate of u ˆcpu . Then, N equal to the minimum number of servers to accommodate all VMs in Vunalloc . We provision VMs to reduce the number of active servers while satisfying performance requirements. The ALLOCATE phase is iterated until all VMs are allocated ˜server servers (line 9). First, we select a server having to N the largest remaining CPU capability, i.e., Remi (line 10). Second, we find a VM to be allocated into Serveri (line 11), server which has the highest Costi with VMs in Valloc , while i server should be larger than satisfying two conditions: 1) Costi T Hcost ; and 2) u ˆcpu (V Mi ) should be less than or equal to Remi . In case we find a VM, we update Valloc , Remi , and i Vunalloc accordingly (lines 12∼15). The procedure to find VMs to be allocated in Serveri is iterated until there is VM left (lines 12∼16). If we have unallocated VMs at the end of the iteration, we repeat the procedure (from lines 10∼16) with a degenerated T Hcost by a factor of α (line 17) along with a list of servers sorted in descending order of Remi (line 18). C. Decision of v/f level Once all VMs are allocated into servers, we determine an optimal v/f level for each server. However, we cannot exactly estimate how much we can lower v/f level when multiple VMs are allocated in a server because Costvm i,j only captures
Fig. 3. Relationship between weighted average correlation in Eqn. (2) and possible v/f scaling factor: the lower bound of the possible v/f scaling factor server has linear relationship with Costi
the correlation between two VMs. Therefore, we empirically server calculate the lower bound of v/f slowdown through Costi in Eqn. (2), as shown in Fig. 3. X- and Y-axes, respectively, represent a weighted average cost function calculated with Eqn. (2) and the ratio of the sum of u ˆcpu (V Mi )’s of colocated VMs to the aggregated peak value of the server, which represents possible v/f slowdown. Based on the relationship, we can determine the frequency level of Serveri , i.e., fi , as presented in Eqn. (4): ! ! Pnvm i ˆcpu (V Mi,j ) 1 j=1 u fi = · · f max (4) server server Ncore Costi where f max is the maximum frequency level. fi is set by lowering the worst-case peak required frequency level (i.e., the second parenthesis assuming the situation when peaks of server . VMs coincide) with a factor of 1/Costi V. E XPERIMENTAL RESULTS We validated the proposed datacener power management approach in two setups. First, we applied the proposed solution to two web search clusters running on DELL PowerEdge R815 servers to validate the applicability of the proposed correlationaware scheme for scale-out applications. Second, we further investigated the effectiveness to larger scale problems with the utilization traces obtained from a real datacenter setup. A. Setup-1: Distributed web search applications We built two web search clusters, i.e., Cluster1 , and Cluster2 , using the CloudSuite benchmarks [10]. Each cluster consists of three VMs: one is front-end (Tomcat-7.0.23) and two are ISNs (Nutch-1.2). Note that the CPU utilization of the front-end is quite low compared to ISNs. Thus, we simply varied the allocation of VMs hosting ISNs. We annotate four ISNs as V M1,1 , V M1,2 , V M2,1 , and V M2,2 where {V M1,1 , V M1,2 } and {V M2,1 , V M2,2 } are included in Cluster1 and Cluster2 , respectively. We used Xen-4.1 hypervisor for server virtualization and each VM has Ubuntu11.10 as its operating system (OS). We emulated clients’ behavior using Faban-0.7 and varied the number of clients from 0∼300 with the form of sine and cosine waves for Cluster1 and Cluster2 , respectively. We used two servers each of which consists of 8 cores having two frequency levels, i.e., 1.9GHz and 2.1GHz. We compared three different VM allocations, as illustrated in the upper part of Fig. 4. 1) Segregated where
VM1,1 (4 cores)
VM1,2 (4 cores)
VM2,1 (4 cores)
Server1 (8cores)
VM2,2 (4 cores)
Server2 (8cores)
VM1,1 VM1,2
VM2,1 VM2,2
VM1,2 (8 cores) VM1,1 (8 cores)
VM2,2 (8 cores) VM2,1 (8 cores)
VM2,1 (8 cores) VM1,1 (8 cores)
VM2,2 (8 cores) VM1,2 (8 cores)
Server1 (8cores)
Server2 (8cores)
Server1 (8cores)
Server2 (8cores)
Server2
Server2
Server1
(b)
(c)
VM placements and CPU utilization traces of (a) Isolated, (b) Shared-UnCorr, and (c) Shared-Corr
each VM is independently running on 4 cores each, 2) SharedUnCorr where 8 cores are shared with two VMs in a same cluster (i.e., correlation unawareness), and 3) Shared-Corr where 8 cores are shared with two VMs in different clusters (i.e., including correlation awareness). Then, Fig. 5 shows comparisons in terms of the 90th percentile response time. As this figure indicates, the 90th percentile response time in Shared-UnCorr is lower than Segrated by 43.6% (from 0.275 to 0.155 sec) while SharedCorr provides another 7.7% lower response time (from 0.155 to 0.143 sec) than Shared-UnCorr under 2.1GHz. The results can be explained by observing the CPU utilization traces in Fig. 4. The X- and Y-axes represent the elapsed time (in sec) and the normalized CPU utilization with respect to the number of servers, respectively. The samples are collected at every 1 sec using a Perl script monitoring tool Xenstat.pl. The reason of the high response time in Segregated case is the inefficient utilization of the allocated cores. As shown in Fig. 4(a), V M1,1 and V M2,2 are under-utilized while V M1,2 and V M2,1 are over-utilized, i.e., approaching their maximum CPU utilization levels, and needs more than 4 cores. Note that the response time of the distributed web search cluster is constrained by the latest VM because a front-end sends results to clients only after collecting the search results from all ISNs. Thus, due to the deficiency of the CPU capability of the over-utilized VMs, queries must wait in a queue for a longer time before being processed. Thus, the response time of Segregated case becomes longer. On the contrary, Shared-UnCorr enables to efficiently use all the 8 cores in each server by flexibly scheduling VMs to the cores according to their time-varying demands. This result supports our claim in Section III-B where we anticipated that the gain attaining from sharing cores among VMs is much higher than the performance degradation caused by the interference among co-located VMs. However, the maximum CPU utilization reaches up to 0.88 because two VMs within the same cluster are highly correlated. Hence, the peaks of the CPU utilizations coincide. Such high CPU utilization can result in longer response times [13]. We can reduce the peak utilization by allocating VM considering correlations among VMs in Shared-Corr (Fig. 4(c)). In Shared-Corre, the maximum CPU utilization becomes even and lowered down to 0.6. The improved response time in Shared-Corr can be
0.3
90th percentile Reponse time (sec)
(a) Fig. 4.
Server1
0.2
0.275
Cluster1
Cluster2
0.208 0.153 0.155
0.143 0.128
0.160 0.150
0.1
0 Segrated
Shared‐UnCorr
Shared‐Corr (2.1G) Shared‐Corr (1.9G)
Fig. 5. 90th percentile response time of Cluster1 and Cluster2 for three different VM allocations
used to save power consumption by lowering the frequency level. As shown in Fig. 5, Shared-Corr running with 1.9GHz provides almost similar response time (0.155 vs. 0.160 sec) to Shared running with 2.1GHz, which results in approximately 12% powe savings. B. Setup-2: Utilization traces obtained from datacenter setups To further investigate the effectiveness of the proposed solution, we performed another set of simulations using utilization traces obtained from an actual datacenter. As most of VMs are severely under-utilized, we selected the top 40 VMs in terms of CPU utilization. We sampled the CPU utilization every 5 min. for a day while synthesizing fine-grained samples per 5 sec. with a lognormal random number generator [16], whose mean is the same as the collected value for the corresponding 5minute sample rate. Using this utilization traces, we evaluated the effectiveness of the proposed solution with a virtual testbed consisting of 20 servers. We targeted an Intel Xeon E5410 server configuration which consists of 8 cores and two frequency levels (2.0GHz and 2.3GHz), and used the power model proposed in [13]. We performed VM placement every 1 hour, i.e., tperiod =1 hour, with predictions of upcoming workloads using a last-value predictor. Then, we compared the following three approaches of power management for datacenters: • Best-Fit-Decreasing (BFD): a conventional best-fitdecreasing heuristic approach. • Peak Clustering-based Placement (PCP) [6]: a correlation-aware VM allocation which clusters VMs using its Envelope-based correlation classification. • Proposed: the proposed correlation-aware VM allocation. Table II(a) compares the power consumption and performance violations of the three approaches when we statically
TABLE II C OMPARISONS FOR ( A ) STATIC AND ( B ) DYNAMIC V / F SCALING (a) Normalized power Maximum violations (%) BFD 1 18.2 PCP [6] 0.999 18.2 Proposed 0.863 2.6
BFD PCP Proposed
(b) Normalized power 1 0.997 0.958
Maximum violations (%) 20.3 20.3 3.1
(a) (b) Fig. 6. Comparison of frequency distributions in (a) Server1 and (b) Server3
set the v/f level at the time of VM placement, i.e., tperiod . The power consumption results are normalized with respect to the power consumed by BFD, and the maximum violation shows the maximum per-period ratio of the number of over-utilized time instances (i.e., when the aggregated utilization among colocated VMs is beyond the CPU capacity of a corresponding server) to tperiod , during the entire periods, i.e., 24 hours. The proposed solution provides up to 13.7% power savings compared to BFD and PCP, while drastically reducing the number of the violations. It is noteworthy that PCP provides almost similar results with BFD because, due to high and fastchanging correlations among VMs in our utilization traces, PCP classifies VMs into only ‘1’ cluster during the most of the time periods (22 out of 24 time periods). When the number of clusters is ‘1’, PCP behaves exactly same with BFD. The power savings obtained by our proposed solution are due to the aggressive-yet-safe v/f settings utilizing the lowered actual peak resource demand, i.e., Eqn. (4). Fig. 6 compares the distributions of used frequency levels of BFD and the proposed solution in two servers (we omit the distribution of PCP, as it is similar to BFD). As shown in the histograms, the proposed solution uses the lower frequency levels more frequently. Moreover, the proposed solution provides a drastic reduction of the violations (i.e., 15.6%) compared to the other approaches. Note that we allocated VMs based on their peak utilizations, which were predicted from the their history. Despite the provision based on the peak utilization, we observed quality degradation over the three approaches due to the mis-predictions of the peak utilization, especially during abrupt workload changes. However, the proposed solution can statistically reduce the probability of the violation by co-locating uncorrelated VMs. Thus, the probability of joint under-predictions among the co-located VMs is drastically decreased. To further investigate the effectiveness of the proposed solution, we also simulated the case of servers using dynamic v/f scaling. To prevent frequent oscillations of v/f level (which
affects server reliability [17]), we performed the v/f scaling at every 12 samples (i.e., 1 min). As shown in Table II(b), the power savings become smaller compared to the static v/f scaling because the other approaches also adaptively scale v/f level according to the time-varying utilization demand. However, the amount of the violations is unacceptably high in the other approaches. Thus, more servers need to be activated to achieve the same QoS level obtained by the proposed solution, which leads to higher power consumption. VI. C ONCLUSIONS In this paper, we have presented a novel dynamic power management solution for datacenters targeting the execution of scale-out applications by jointly harnessing server consolidation and v/f scaling, in order to reduce the global power consumption while satisfying QoS requirements. Therefore, we have first analyzed the characteristics of scale-out applications and evaluated three fundamental approaches for datacenter dynamic power management solutions: 1) conservative resource provision based on (off-)peak utilization, 2) sharing cores among co-located VMs, and 3) correlation-aware VM placement. Then, we proposed a novel VM placement solutions utilizing the new definition of correlation and an aggressive-yet-safe v/f scaling solution. Finally, we validated the applicability of our proposed correlation-aware scheme with the application of multiple web search clusters in [10] and the utilization traces obtained from real datacenter setups. Our experimental results show that the proposed solution provides up to 13.7% power savings and up to 15.6% improvement of QoS level compared to conventional VM placement solutions. R EFERENCES [1] R. H. Katz, “Tech titans building boom,” in IEEE Spectrum, 2009. [2] A. Verma, et al., “pMapper: power and migration cost aware application placement in virtualized systems,” in Proc. Middleware 2008. [3] E. Pakbaznia, et al., “Minimizing data center cooling and server power costs,” in Proc. ISLPED, 2009. [4] N. Bobroff, et al., “Dynamic placement of virtual machines for managing sla violations,” in Proc. IM 2007. [5] D. Meisner, et al., “Power management of online data-intensive services,” in Proc. ISCA, 2011. [6] A. Verma, et al., “Server workload analysis for powr minimization using consolidation,” in Proc. USENIX, 2009. [7] X. Meng, et al., “Efficient resource provisioning in compute clouds via VM multiplexign,” in Proc. ICAC, 2010. [8] M. Chen, et al., “Effective VM sizing in virtualized data centers,” in Proc. IM, 2011. [9] K. Halder, et al., “Risk aware provisioning and resource aggregation based consolidation of virtual machines,” in Proc. Cloud, 2012. [10] M. Ferdman, et al., “Clearing the clouds: a study of emerging scale-out workloads on modern hardware,” in Proc. ASPLOS, 2012. [11] E. Schurman et al., “The user and business impact of server delays, additional bytes, and HTTP chunking in web search,” in Velocity, 2009. [12] H. Goudarz, et al., “Energy-efficient virtual machine replication and placement in a cloud computing system,” in Proc. Cloud 2012. [13] M. Pedram, et al., “Power and performance modeling in a virtualized server system,” in Proc. ICPPW, 2010. [14] A. Menon, et al., “Diganosing performance overheads in the xen virtual machine environment,” in Proc. VEE, 2005. [15] J. Kim, et al., “Free cooling-aware dynamic power management for green datacenters,” in Proc. HPCS, 2012. [16] T. Benson, et al., “Understanding data center traffic characteristics,” in ACM SIGCOMM Computer Communication Review, 2010. [17] Y. Guo, et al., “Reliability-aware power management for parallel realtime applications with precedence constraints,” in Proc. IGCC, 2011.