JCDP 10.5005/jp-journals-10024-1141 Correlation between Surface Roughness and Microhardness of Experimental Composites with Varying Filler Concentration
ORIGINAL RESEARCH
Correlation between Surface Roughness and Microhardness of Experimental Composites with Varying Filler Concentration Eliseu Aldrighi Münchow, Marcos Brito Correa, Fabrício Aulo Ogliari, Evandro Piva, Cesar Henrique Zanchi
ABSTRACT
INTRODUCTION
Aim: The purpose of this study was to investigate the influence of the surface roughness on the surface microhardness of experimental composites with varying filler concentration.
Direct dental resin composites have been widely used in Dentistry in the last 20 years because of their adhesion to tooth structure, the improvements in mechanical properties and the variety of color options. The longevity achieved by this restorative material is satisfactory, and according to a 17-year evaluation study,1 the clinical performance of posterior composite restorations is already acceptable. There are some physical and mechanical properties which influence directly the longevity of the restoration because they are important to support the mastication stress.2 Add to that, surface properties are determinant too in predicting the performance of the material, as for example, the surface hardness and the surface roughness ones.3,4 Hardness measures the material’s capacity to resist permanent indentation5 or scratching4 and it depends on the organic and inorganic composition of composites.2 In regard to the organic matrix, the degree of conversion of monomers is the main factor related to hardness,6 besides the light curing method, the depth of cure and the composite shade can too influence the microhardness of resin composites.7-9 In fact, according to Ferracane,10 the hardness value increases with the conversion of resin monomers into a polymer network. Additionally, different filler types, sizes and concentration determine too different superficial and internal hardness values.11-16 The surface hardness test is broadly employed for in vitro composites evaluation and it is of simple execution.17 It occurs by the penetration of a sharp diamond indenter at the surface of the material upon application of a given load at a known rate.18 Moreover, the microhardness indentation test occurs in the micrometric scale, so the closest contact
Materials and methods: Experimental resin composites were formulated by mixing Bis-GMA and TEGDMA in a 50/50% weight ratio and CQ/EDAB were added to make the material photosensitive. Silanized glass particles were incorporated in the resin blend in two concentrations: C50 with 50% and C75 with 75% in weight ratio. The surface roughness and the surface microhardness measurements were determined after every three finishing procedures with #280-, #600- and #1200-grit wet sandpapers, respectively. The data were analyzed statistically by Two Way ANOVA and Tukey’s test, and comparisons were conducted using the Spearman’s correlation test (p < 0.05). Results: The surface roughness and surface microhardness were negatively associated (r = – 0.68) and the finishing procedures of both composites resulted in harder and smoother surfaces than the initial ones. Additionally, in a smooth circumstance, the higher content of fillers has not resulted in a composite with better microhardness and smoothness. Conclusion: Finishing procedures decreased the surface roughness and consequently improved the surface microhardness of the composites evaluated. Clinical significance: Finishing and polishing procedures are effectives in reducing the surface roughness amplitude of composite materials and in improving their surface microhardness. Thus a microhardness test and any hardness evaluation must be conducted only after a properly finished and polished surface is achieved. Keywords: Laboratory research, Composite resins, Surface properties, Hardness, Roughness, Nanoparticles. How to cite this article: Münchow EA, Correa MB, Ogliari FA, Piva E, Zanchi CH. Correlation between Surface Roughness and Microhardness of Experimental Composites with Varying Filler Concentration. J Contemp Dent Pract 2012;13(3):299-304. Source of support: Nil Conflict of interest: None declared
The Journal of Contemporary Dental Practice, May-June 2012;13(3):299-304
299
Eliseu Aldrighi Münchow et al
between the indenter and the material’s surface is necessary to the reliability of the indentation test.19 Nevertheless, some studies have demonstrated that irregularities on the material’s surface can apparent a determined hardness value which is not the real one.20,21 Regardless of their influence on microhardness, finishing and polishing procedures are important clinical steps to promote smooth surfaces to the restorative material, enhancing esthetics to the restoration,22 because dental restorations appear optically smooth when their surface roughness is smaller than 1 µm.23 In addition, a smooth surface is necessary to avoid plaque accumulation, gingival inflammation, secondary caries and superficial staining. Thus, smooth surfaces improve the surface characteristics of the restorative material and consequently its longevity.22 Even though there are few studies, where the correlation between surface hardness and surface roughness has been investigated,20,21 none study has properly controlled the possible variable factors involved in those surface properties. For example, Chung et al21 have evaluated the effect of surface finishing on the microhardness of several dental composites. They first created different surface topography by different finishing and polishing procedures and then they evaluated the microhardness of each material after each finishing/polishing step. For results, the authors have not found any correlation between surface finishing and Vickers Microhardness Number. However, this study investigated different commercial composites, which are heterogeneous materials that present components with different degrees of hardness that may consequently affect the surface smoothness of the material.24 Even so, finishing and polishing procedures have been considered effectives in the improvement of surface hardness.22,25 Hence, the aim of this study was to evaluate the correlation between surface roughness and microhardness of experimental composites with only varying filler concentration.
(50/50% in weight ratio) (Esstech, Essington, PA, USA). To make the resin blend photosensitive, a binary light-curing system constituted by 0.4 wt% of camphorquinone (CQ) (Esstech, Essington, PA, USA) and 0.8 wt% of ethyl 4-dimethylaminebenzoate (EDAB) (Fluka, Milwaukee, WI, USA) were dissolved in the mixture. Then, different amounts of silanized glass particles (Esstech, Essington, PA, USA) were incorporated in the resin blend through intensive mixture, resulting in two experimental composites, as shown in Table 1. Specimen Preparation Five disk-shaped specimens of each experimental composite were produced by dispensing the material in a circular stainless silicon matrix (7 mm diameter × 4 mm thick). Then, the specimens were covered with acetate strips (Hawe-Neos Dental, Bioggio, Switzerland) and a glass slide was placed on top of the silicon matrix, where gentle pressure was applied to extrude excess material. Thus, the specimens were photoactivated for 60s in both faces using a curing unit (LED RADII, SDI, Bayswater, Victoria, Australia). The intensity of the curing light was verified with a curing radiometer (Ophir Optronics, Danver, MA, USA) and it was 1400 mW/cm². After curing, the specimens were placed in room temperature. One week later, the specimens were included in epoxy resin and then they were split up in two parts, totalizing 10 specimens for each composite evaluated (n = 10). Surface Treatments For finishing procedures, the specimens were polished with #280-, #600- and #1200-grit wet sandpapers, which represent the first, second and third finishing steps, respectively. The surface roughness (Ra) and the Knoop Microhardness Number (KMN) of each specimen were measured after each finishing procedure. Surface Roughness Measurement
MATERIALS AND METHODS
The surface roughness measurements were evaluated rotated though the surface profilometer (Surfcorder SE 1200, Kosaka Labs., Tokyo, Japan) clockwise at random angle. Three transverse of the stylus were made across the center of each specimen with a cut-off value of 0.8 mm and
Formulation of the Experimental Composites One resin blend was formulated by mixing 2,2-bis [4- (2hydroxy-3-methacryloyloxypropyl) phenyl]- propane (BisGMA) and triethyleneglycol dimethacrylate (TEGDMA)
Table 1: Composition of the experimental composites Composite C50 C75
Composition (wt%) Bis-GMA* 25 12.5
TEGDMA* 25 12.5
SGP* (2 µm) 25 37.5
SGP* (0.7 µm) 25 37.5
*Bis-GMA: Bisphenol A glycidyl dimethacrylate; TEGDMA: Triethylene glycol dimethacrylate; SGP: Silanized glass particles.
300
JAYPEE
JCDP Correlation between Surface Roughness and Microhardness of Experimental Composites with Varying Filler Concentration
measuring length of 4 mm. The mean roughness parameter (Ra in µm) for each sample was recorded as the average of three readings. All the readings were performed by the same operator and the profilometer was calibrated prior of measuring against a reference block. Knoop Microhardness Measurement The Knoop microhardness number (KMN) of each specimen was measured after each finishing procedure and it was determined using a microhardness tester (FM 700, Future Tech, Chung Ho, Taipei Hsien, Taiwan). A load of 50 g was applied during 10 s, and three indentations were made across the center of each specimen. The KMN is the ratio of the load applied to the indenter to the unrecovered projected area. Statistical Analysis The Ra and the KMN values were conducted using twoway Analysis of Variance (ANOVA) and Tukey’s test. Comparisons among surface roughness and surface microhardness were conducted using the Spearman’s correlation test. All the statistical tests had a significance level of 5%. RESULTS Surface Roughness The Analysis of Variance showed the interaction between the variables ‘composite’ and ‘surface treatment’ (p = 0.002). The means and the standard deviations are presented in Table 2. The surface roughness was improved after every finishing procedure for both experimental composites, and the C50 presented a rougher surface than the C75 only after the first finishing procedure (p < 0.05).
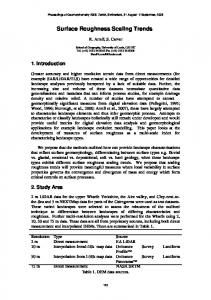
treatment applied (r = – 0.68) (p < 0.05), which can be visualized in the Figure 1. DISCUSSION The possible influence of the surface roughness on the surface microhardness of composites had inspired the present study since Bobji and Biswas20 have demonstrated that the presence of topographical irregularities would be responsible for hardness data variation. According to these authors, the contact between the diamond indenter and the surface in evaluation would not be close enough in rougher circumstances, decreasing the reliability of the microhardness test. In our study, surface roughness and surface microhardness were negatively correlated (correlation coefficient equal to – 0.68, p < 0.05), which means these surface properties are inversely proportional (Fig. 1), and consequently, that smooth surfaces are considered harder than rough ones. The mean surface roughness values (Ra) for varying finishing procedures are disposed in Table 2. C50 and C75 ranged, respectively, from 1.26 to 0.19 and 1.12 to 0.20 µm after decreasing finishing steps (#280-, #600- and #1200grit wet sandpapers), resulting in smoother surfaces than the initial ones (p < 0.05). On the other hand, within the microhardness data (KMN), C50 earned a harder surface after every finishing procedure, while C75 had its surface microhardness improved only after the last finishing step (Table 3). Even so, the both groups resulted in harder and smoother surfaces (p < 0.05), confirming the correlation between surface hardness and surface roughness. According to Helvatjoglou et al25 and Yap et al,22 finishing and polishing procedures are effectives in the improvement of
Knoop Microhardness The two-way Analysis of Variance showed too the interaction between the variables ‘composite’ and ‘surface treatment’ (p = 0.009). While the C50 had its surface microhardness improved after every finishing procedure, the C75 gained a harder surface only after the last finishing procedure (p < 0.05) was carried out. Additionally, when the composites were in a same finishing pattern, both groups presented similar surface microhardness, except after the first finishing procedure, where the C75 showed a harder surface than the C50 (p < 0.05). Correlation Test The Spearman’s correlation test showed a negative interaction among the type of composite and the surface
Fig. 1: Association between the knoop microhardness number and the surface roughness values of the composites evaluated. The scatterplot clearly indicates that there is a negative association between the variables
The Journal of Contemporary Dental Practice, May-June 2012;13(3):299-304
301
Eliseu Aldrighi Münchow et al
surface hardness, and according to the present study, the correlation between surface microhardness and surface roughness can be verified in Figure 1, where as the surface roughness decreased the surface microhardness increased (p < 0.05). Microhardness and surface roughness can be considered properties material-dependent because they depend on the type of polymer matrix and the size, type and content of fillers.6,26 Consequently, commercial dental composites may present differences among materials composition, and this situation may interfere with the evaluation of some properties,24 specially the surface ones. Therefore, the present study evaluated experimental composites which differed only about their filler concentration, eliminating the possible variation factors. The difference in filler content among the composites was 50% (C50 with 50% of fillers and C75 with 75%) (Table 1). However, considering them in a same finishing circumstance, the higher amount of fillers has not totally resulted in better surface microhardness, except after the first finishing procedure (#280-), where C75 showed a harder and smoother surface than C50 (p < 0.05) (Tables 2 and 3). Even though several studies have demonstrated the increase in filler concentration improves the composites microhardness, 11-16 the results from our study have demonstrated that higher amounts of filler particles have not improved the surface microhardness of the material when it was well finished (smooth) (Table 3). This can be explained by the ratio between organic and inorganic content of the composites, since the resin matrix and the filler particles do not abrade to the same degree due to differences in hardness,24 where theoretically C75 would be harder than C50. Nevertheless, C50 and C75 demonstrated similar surface microhardness, probably
because the resin matrix disposed superficially on the specimens was eliminated by the sequential finishing procedures, resulting in a surface full of fillers, just as the C75 specimens, with lower content of organic matrix. Consequently, both composites presented similar topographical patterns and surface properties.27,28 This finding demonstrates that when a smooth surface is achieved to composite materials, their surface microhardness is improved and also become statistically similar even for composites with 50% of difference in the content of fillers. Another possible reason for the similarity of surface microhardness data among the composites is that a higher amount of fillers in the material’s composition could scatter the curing light through the material mass, decreasing the degree of conversion of this composite.15 Consequently, a lower hardness value would be expected, making the composite with higher content of fillers (C75) as hard as the composite with less filler concentration (C50). Additionally, a third reason to explain the similarity of surface microhardness among the composites is about the indentation depth. In an indentation test, the depth of penetration of the indenter on the top of the material should be deep enough to allow the measure of the true bulk material properties.21 If the material under evaluation presents a rough surface, its microhardness will probably be wrongly interpreted. Besides, the surface irregularities in a resin composite can range from a few nanometers to several micrometers in peak heights, and it is the amplitude of the roughness which may interfere with the microhardness indentation test. To avoid this situation, finishing and polishing procedures should be performed to decrease the amplitude of the surface roughness, thus representing the true bulk material microhardness.21
Table 2: Mean surface roughness (Ra–µm) after each surface treatment procedure of composites and the standard deviation (±SD) Composite C50 C75
Surface roughness (Ra) #280
#600 aA
1.26 (0.09) 1.12 (0.08)bA
#1200 aB
0.52 (0.08) 0.50 (0.07)aB
0.19 (0.04)aC 0.20 (0.06)aC
Different superscript small letters represent statistically significant differences among composites in a same column (p < 0.05) whereas capital letters indicate differences between surface treatments in a same row (p < 0.05)
Table 3: Knoop microhardness number (KMN) and its standard deviation (±SD) after each surface treatment procedure of composites Composite C50 C75
Knoop microhardness number (KMN) #280
#600 bA
31.1 (3.8) 40.0 (2.7)aA
#1200 aB
42.2 (7.3) 45.4 (6.1)aAB
49.9 (7.6)aC 49.4 (5.6)aB
Different superscript small letters represent statistically significant differences among composites in a same column (p < 0.05) whereas capital letters indicate differences between surface treatments in a same row (p < 0.05)
302
JAYPEE
JCDP Correlation between Surface Roughness and Microhardness of Experimental Composites with Varying Filler Concentration
CONCLUSION 1. The current study has demonstrated that surface roughness and surface microhardness were negatively associated, so these surface properties can be considered inversely proportional. 2. The composite with lower filler content (C50) earned a harder and smoother surface after every finishing procedure, while the composite with higher filler content (C75) had its surface microhardness improved only after the last finishing step, but it earned a smoother surface after every finishing procedure. 3. In rough circumstances, C75 presented a harder and smoother surface than C50; in smooth circumstances, C75 has not resulted in better surface microhardness and surface smoothness when compared with C50. CLINICAL SIGNIFICANCE Finishing and polishing procedures are effectives in reducing the surface roughness amplitude of composite materials and in improving their surface microhardness. Thus a microhardness test and any hardness evaluation must be conducted only after a properly finished and polished surface is achieved. ACKNOWLEDGMENT The authors are grateful to Brazilian National Council for Scientific and Technological Development (CNPq) for financial support, CAPES/MEC (Brazilian Government) for scholarship and Esstech Inc for reagents donation. REFERENCES 1. da Rosa Rodolpho PA, Cenci MS, Donassollo TA, Loguercio AD, Demarco FF. A clinical evaluation of posterior composite restorations: 17-year findings. J Dent 2006;34:427-35. 2. Anfe TE, Caneppele TM, Agra CM, Vieira GF. Microhardness assessment of different commercial brands of resin composites with different degrees of translucence. Braz Oral Res 2008;22: 358-63. 3. Ferracane JL, Mitchem JC, Condon JR, Todd R. Wear and marginal breakdown of composites with various degrees of cure. J Dent Res 1997;76:1508-16. 4. Mandikos MN, McGivney GP, Davis E, Bush PJ, Carter JM. A comparison of the wear resistance and hardness of indirect composite resins. J Prosthet Dent 2001;85:386-95. 5. Gong J, Li Y. An energy-balance analysis for the size effect in low-load hardness testing. J Mater Sci 2000;35:209-13. 6. Moszner N, Salz U. New developments of polymeric dental composites. Progress in Polymer Science 2001;26: 535-76.
7. de Araujo CS, Schein MT, Zanchi CH, Rodrigues SA, Jr Demarco FF. Composite resin microhardness: The influence of light curing method, composite shade, and depth of cure. J Contemp Dent Pract 2008;9:43-50. 8. Voltarelli FR, dos Santos-Daroz CB, Alves MC, Peris AR, Marchi GM. Effect of different light-curing devices and aging procedures on composite knoop microhardness. Braz Oral Res 2009;23:473-79. 9. Yazici AR, Kugel G, Gul G. The Knoop hardness of a composite resin polymerized with different curing lights and different modes. J Contemp Dent Pract 2007;8:52-59. 10. Ferracane JL. Correlation between hardness and degree of conversion during setting reaction of unfilled dental restorative resins. Dent Mater 1985;1:11-14. 11. Borba M, Della Bona A, Cecchetti D. Flexural strength and hardness of direct and indirect composites. Braz Oral Res 2009; 23:5-10. 12. Chung KH. The relationship between composition and properties of posterior resin composites. J Dent Res 1990;69:852-56. 13. Knobloch LA, Kerby RE, Clelland N, Lee J. Hardness and degree of conversion of posterior packable composites. Oper Dent 2004;29:642-49. 14. Neves A, Discacciati J, Oréfice R, Jansen W. Correlation between degree of conversion, microhardness and inorganic content in composites. Pesquisa Odontológica Brasileira 2002; 16:349-54. 15. Rodrigues SA, Jr Scherrer SS, Ferracane JL, Della Bona A. Microstructural characterization and fracture behavior of a microhybrid and a nanofill composite. Dent Mater 2008;24: 1281-88. 16. Turssi CP, Ferracane JL, Vogel K. Filler features and their effects on wear and degree of conversion of particulate dental resin composites. Biomaterials 2005;26:4932-37. 17. Mencik J, Swain MV. Errors associated with depth-sensing microindentation tests. J Mater Res 1995;10:1491-501. 18. Calleja FJB, Flores A, Ania F, Bassett DC. Microhardness studies of chain-extended PE: II. Creep behaviour and temperature dependence. J Mater Sci 2000;35:1315-19. 19. Yap AU, Wang X, Wu X, Chung SM. Comparative hardness and modulus of tooth-colored restoratives: A depth-sensing microindentation study. Biomaterials 2004;25:2179-85. 20. Bobji M, Biswas S. Deconvolution of hardness from data obtained from nanoindentation of rough surfaces. J Mater Res 1999;14:2259-68. 21. Chung SM, Yap AU. Effects of surface finish on indentation modulus and hardness of dental composite restoratives. Dent Mater 2005;21:1008-16. 22. Yap AU, Sau CW, Lye KW. Effects of finishing/polishing time on surface characteristics of tooth-coloured restoratives. J Oral Rehabil 1998;25:456-61. 23. Chung KH. Effects of finishing and polishing procedures on the surface texture of resin composites. Dent Mater 1994;10: 325-30. 24. Nagem Filho H, D’Azevedo MT, Nagem HD, Marsola FP. Surface roughness of composite resins after finishing and polishing. Braz Dent J 2003;14:37-41. 25. Helvatjoglou-Antoniadi M, Papadogianis Y, KoliniotouKubia E, Kubias S. Surface hardness of light-cured and selfcured composite resins. J Prosthet Dent 1991;65:215-20.
The Journal of Contemporary Dental Practice, May-June 2012;13(3):299-304
303
Eliseu Aldrighi Münchow et al 26. Condon JR, Ferracane JL. In vitro wear of composite with varied cure, filler level, and filler treatment. J Dent Res 1997;76: 1405-11. 27. Ikejima I, Nomoto R, McCabe JF. Shear punch strength and flexural strength of model composites with varying filler volume fraction, particle size and silanation. Dent Mater 2003;19: 206-11. 28. Reis AF, Giannini M, Lovadino JR, Ambrosano GM. Effects of various finishing systems on the surface roughness and staining susceptibility of packable composite resins. Dent Mater 2003;19: 12-18.
ABOUT THE AUTHORS Eliseu Aldrighi Münchow (Corresponding Author) PhD Student, Department of Operative Dentistry, School of Dentistry Federal University of Pelotas, Pelotas, RS, Brazil e-mail:
[email protected]
304
Marcos Brito Correa Professor, Department of Operative Dentistry, School of Dentistry, Federal University of Pelotas, Pelotas, RS, Brazil
Fabrício Aulo Ogliari Professor, Department of Polymeric Materials, School of Materials Engineering, Federal University of Pelotas, Pelotas, RS, Brazil
Evandro Piva Professor, Department of Operative Dentistry, School of Dentistry Federal University of Pelotas, Pelotas, RS, Brazil
Cesar Henrique Zanchi Professor, Department of Operative Dentistry, School of Dentistry Federal University of Pelotas, Pelotas, RS, Brazil
JAYPEE