The Journal of Neuroscience, May 11, 2005 • 25(19):4681– 4693 • 4681
Behavioral/Systems/Cognitive
Cortical Ensemble Adaptation to Represent Velocity of an Artificial Actuator Controlled by a Brain–Machine Interface Mikhail A. Lebedev,1,3 Jose M. Carmena,1,3 Joseph E. O’Doherty,2 Miriam Zacksenhouse,5 Craig S. Henriquez,2,3 Jose C. Principe,6 and Miguel A. L. Nicolelis1,2,3,4 Departments of 1Neurobiology and 2Biomedical Engineering, 3Center for Neuroengineering, 4Department of Psychological and Brain Sciences, Duke University, Durham, North Carolina 27710, 5Department of Mechanical Engineering, Israel Institute of Technology, Haifa 32000, Israel, and 6Department of Electrical Engineering, University of Florida, Gainesville, Florida 32611
Monkeys can learn to directly control the movements of an artificial actuator by using a brain–machine interface (BMI) driven by the activity of a sample of cortical neurons. Eventually, they can do so without moving their limbs. Neuronal adaptations underlying the transition from control of the limb to control of the actuator are poorly understood. Here, we show that rapid modifications in neuronal representation of velocity of the hand and actuator occur in multiple cortical areas during the operation of a BMI. Initially, monkeys controlled the actuator by moving a hand-held pole. During this period, the BMI was trained to predict the actuator velocity. As the monkeys started using their cortical activity to control the actuator, the activity of individual neurons and neuronal populations became less representative of the animal’s hand movements while representing the movements of the actuator. As a result of this adaptation, the animals could eventually stop moving their hands yet continue to control the actuator. These results show that, during BMI control, cortical ensembles represent behaviorally significant motor parameters, even if these are not associated with movements of the animal’s own limb. Key words: brain–machine interface; motor cortex; macaque monkey; cortical plasticity; motor learning; body schema
Introduction Ever since Evarts (1966) pioneered single-unit recordings from the cortex of awake, behaving monkeys, numerous studies have scrutinized a fundamental observation: cortical neurons modulate their firing during voluntary movements and thereby encode a variety of motor parameters (Georgopoulos et al., 1986, 1992; Ashe and Georgopoulos, 1994; Fu et al., 1995; Sergio and Kalaska, 1998). This encoding incorporates motor, sensory, and cognitive signals and appears to be highly complex (Cheney and Fetz, 1980; Alexander and Crutcher, 1990; Lebedev et al., 1994; Shen and Alexander, 1997; Donchin et al., 1998; Kakei et al., 1999) (for review, see Georgopoulos, 2000; Johnson et al., 2001; Andersen and Buneo, 2002; Paz et al., 2004). Individual cortical neurons do not have a one-to-one relationship to any single motor parameter (Ashe and Georgopoulos, 1994; Sergio and Kalaska, 1998; Carmena et al., 2003), and their firing patterns exhibit considerable
Received Oct. 1, 2004; revised March 22, 2005; accepted March 23, 2005. This work was supported by grants from the Defense Advanced Research Projects Agency, the James S. McDonnel Foundation, the National Institutes of Health, the National Science Foundation (M.A.L.N.) and the Christopher Reeve Paralysis Foundation (J.M.C.). We thank Dragan F. Dimitrov for conducting the neurosurgery, Gary Lehew for manufacturing multielectrode arrays and engineering the experimental set-up, Roy E. Crist and Ming Qian for programming experimental software, Parag G. Patil, Erin Phelps, Laura M. Oliveira, Kristen Shanklin Dewey, and Aaron J. Sandler for surgical assistance and animal care, Sung-Phil Kim for evaluating additional adaptive filters, and Susan A. Halkiotis and Nathan Fitzsimmons for manuscript preparation. Correspondence should be addressed to Dr. Miguel Nicolelis, Department of Neurobiology, Duke University Medical Center, Bryan Research Building, Box 3209, Durham, NC 27710. E-mail:
[email protected]. DOI:10.1523/JNEUROSCI.4088-04.2005 Copyright © 2005 Society for Neuroscience 0270-6474/05/254681-13$15.00/0
variability (Lee et al., 1998; Shadlen and Newsome, 1998; Cohen and Nicolelis, 2004; Wessberg and Nicolelis, 2004). Precise motor control is achieved through the action of large neuronal ensembles (Wessberg et al., 2000; Carmena et al., 2003). With the advent of electrophysiological techniques permitting simultaneous recordings from hundreds of neurons in multiple brain areas (Nicolelis et al., 1995, 1997, 2003; Kralik et al., 2001; Nicolelis and Ribeiro, 2002), detailed information can be collected about ensemble encoding. Using ensemble recordings, motor parameters can be predicted from neuronal activity in real time and used to control a brain–machine interface (BMI) (Chapin et al., 1999; Wessberg et al., 2000; Nicolelis, 2001; Serruya et al., 2002; Taylor et al., 2002; Carmena et al., 2003; Wessberg and Nicolelis, 2004; Patil et al., 2004). In addition, BMIs can be driven by planning and motivation signals extracted from cortical activity (Musallam et al., 2004). Recently, we implemented a BMI in which cortical ensemble activity recorded from macaque monkey brain directly controlled reaching and grasping movements performed by a robotic arm (Carmena et al., 2003). The monkeys’ proficiency in operating the BMI improved with training, accompanied by changes in neuronal directional tuning. Based on these observations, we suggested that, with prolonged usage, an artificial actuator can be effectively incorporated in the internal representation of the subject’s body, commonly referred to as “body schema” (Head and Holmes, 1911; Gurfinkel et al., 1991; Maravita et al., 2003; Nicolelis, 2003). Notwithstanding initial reports that training to operate a BMI
Lebedev et al. • Cortical Adaptation during BMI Control
4682 • J. Neurosci., May 11, 2005 • 25(19):4681– 4693
evokes plastic changes in the activity patterns of cortical neurons (Taylor et al., 2002; Carmena et al., 2003; Musallam et al., 2004), a number of questions about cortical representation of artificial actuators remain to be addressed. Perhaps the most intriguing finding is that neuronal ensembles previously modulated in association with limb movements continue to be modulated after the subjects stop moving their limbs, and these modulations represent purposeful movements of the actuator (Chapin et al., 1999; Taylor et al., 2002; Carmena et al., 2003). In the present study, we hypothesized that neuronal adaptation to represent the velocity of an artificial actuator instead of the limb can occur even while the subjects continue to move their limbs. Such adaptations would function to optimize neuronal representation of new behavioral goals (Todorov and Jordan, 2002). Accordingly, we examined ensemble encoding of the hand and actuator movements before and after transition to BMI control. We discovered changes in spatial and temporal representation of movements during the BMI control that appeared to establish the representation of the actuator at the expense of the representation of the limb.
ity was set to the predicted values of the model. We name this mode of operation brain control, of which we distinguish two types. During brain control with hand movements (BCWH), a mode that immediately followed pole control in most experiments, the monkeys continued to move the pole. This mode of operation continued for 20 –30 min, after which the pole was removed from the apparatus. At that time, the monkeys stopped moving their arms, as confirmed by EMG recordings (Carmena
Materials and Methods Behavioral task and brain–machine interface operations. Two adult female monkeys (Macaca mulatta) were used in this study. All procedures conformed to the National Research Council Guide for the Care and Use of Laboratory Animals (1996) and were approved by the Duke University Animal Care and Use Committee. The monkeys were trained to pursue a visual target on a computer monitor with a cursor, initially set to motion using a hand-held pole (see Fig. 1 A) (Carmena et al., 2003). The pole actually controlled the movements of the robot arm, which was not visible to the monkeys, and the cursor provided visual feedback of the position of the robot (see Fig. 1 A). The target appeared at random locations on the screen, and the monkeys had to place the cursor over it to obtain a fruit-juice reward [task 1 of Carmena et al. (2003)]. Multielectrode arrays consisting of 16 – 64 microwires spaced at 300 m were implanted bilaterally in primary motor cortex (M1), dorsal premotor cortex (PMd), supplementary motor area (SMA), primary somatosensory cortex (S1), and posterior parietal cortex (PP). Neuronal activity was sampled and sorted using a multichannel acquisition processor (Plexon, Dallas, TX). As the monkeys performed the task by moving the pole, a linear model was trained to predict hand velocity in real time (mathematical description is given below by Eq. 3) (Wessberg et al., 2000; Carmena et al., 2003). We call this mode of operation pole control. After at least 30 min of operation in pole control, the model parameters were fixed. The robot (and the cursor) was disconnected from the pole and was directly controlled by brain activity. Robot veloc-
Figure 1. Experimental design and modes of operation. A, Experimental apparatus. The monkey was seated in front of a computer monitor on which visual stimuli were shown. It had to pursue a visual target (large circle) with a cursor (small circle). The monkey controlled the cursor by moving a hand-held pole (pole control). The pole actually controlled a robotic arm invisible to the monkey, and the cursor position on the screen reflected the robot’s position. A linear model was trained to predict hand/robot velocity from neuronal ensemble activity recorded from the monkey’s cortex. Then, the pole was disconnected, and the robot was directly controlled by the model’s output (brain control). B, Schematics of movement trajectory, instantaneous velocity, and neuronal discharges preceding or succeeding an IVM. Neuronal rates were estimated using 100 ms bins placed at different lags relative to the IVM. C, Representative traces of the hand (black) and the robot (red) during pole control. D, Hand and robot traces during brain control. E1, E2, Time-dependent traces of the hand and robot position during pole control. F1, F2, Time-dependent position traces during brain control. G1, G2, Hand and robot velocity during pole control. E1, E2, Velocity during brain control.
Lebedev et al. • Cortical Adaptation during BMI Control
J. Neurosci., May 11, 2005 • 25(19):4681– 4693 • 4683
et al., 2003), but continued to operate the BMI. This mode of operation is termed brain control without hand movements (BCWOH). BCWOH was first attempted after the monkeys were trained in BCWH for 1 week; the monkeys were able to control the actuator in this mode of operation and obtain rewards on the very first attempt. Each recording session continued for 60 –90 min, until the monkeys had had enough juice and became unmotivated to perform the task. In some sessions, to obtain longer records of BCWOH, the pole was removed immediately after pole control. Tuning to velocity during pole and brain control. Significant correlation between neuronal firing rate and movement velocity has been documented in previous studies of M1 (Georgopoulos et al., 1988; Ashe and Georgopoulos, 1994; Moran and Schwartz, 1999; Carmena et al., 2003) and other cortical areas (Carmena et al., 2003; Averbeck et al., 2005). This finding was key for the experiment reported here, because the BMI relied on predictions of velocity. The linear model predicted velocity in real time, and the velocity of the robot was set to the output of the model. In the present analysis, we describe the relationship between neuronal firing rate and movement by examining the firing rate of each neuron as a function of velocity and of the time lag between the firing rate and instantaneous velocity measurement (IVM) (see Fig. 1 B). IVMs were sampled every 100 ms. Neuronal activity was binned in 100 ms nonoverlapping windows. Binned firing rates were then normalized by subtracting the mean and dividing by the SD. Lags in the range of 1 s before to 1 s after the IVM were examined. For each lag , neuronal firing rate n was fitted to velocity using the following multiple linear regression:
n 共 t ⫹ 兲 ⫽ a 共 兲 V x 共 t 兲 ⫹ b 共 兲 V y 共 t 兲 ⫹ c 共 兲 ⫹ 共 t, 兲 ,
(1)
where t is time, n(t ⫹ ) is neuronal firing rate at time from velocity measurement (negative corresponds to activity preceding velocity measurement, and positive activity succeeding velocity measurement), Vx(t) and Vy(t) are x- and y-components of velocity, a(), b(), and c()
are regression coefficients, and (t, ) is the residual error. We characterized the degree of correlation between the neuronal firing rate and the velocity as the velocity tuning index (VTI), which was calculated as the square root of R 2 for the regression (Eq. 1). This measure describes correlation between neuronal firing rate and movement velocity (both direction and amplitude taken into account) and represents it in normalized form. The better the neuronal firing rate tracked movement velocity, the higher was the VTI. The VTI did not depend on the absolute value of firing rate (e.g., highly active versus less active neurons) because of normalization. Preferred direction (PD; i.e., movement direction for which the neuron fired the most) was calculated as PD() ⫽ arctan b()/a(). To examine whether the PDs of individual neurons in the population were preserved after the monkey started to perform in a new mode of operation (e.g., pole control vs BCWH), we used a correspondence index defined as follows:
C⫽
90⬚ ⫺ 兩 ␣ ⫺  兩 , 90⬚
(2)
where statistical values are calculated for the neuronal samples of the PDs (measured in degrees) before and after the transition, ␣ and , respectively, the bar denotes the mean, and 90° is the mathematical expectation of 兩␣⫺兩 in case they are uncorrelated. C was scaled from 0 to 1. Values of C approaching zero indicate no correspondence between the PDs, whereas values of C approaching unity indicate an exact correspondence. To examine the contribution of correlation between neurons and tuning parameters, we conducted a shuffle test that destroyed the correlation between neurons by shifting spike trains of different neurons with respect to each other by a random interval in the range of 0 to 200 s. This procedure preserved the sequence of spikes of each neuron but removed correlations between the neurons. After shuffling, robot movements were recalculated using the same model with the fixed weights that had been used for the real-time brain control. The VTI of each individual neuron for shuffled data was a measure of tuning that would be expected simply because that neuron had a weighted contribution to the robot control signal. Higher values of VTIs for unshuffled data indicated that correlated firing between neurons improved tuning characteristics of individual neurons (i.e., neuronal subgroups acted as “teams” producing movements in particular directions). A separate analysis tested velocity tuning properties for instances in which the monkeys’ hands or the robotic actuator moved in straight-line trajectories. Epochs of straightline movements of at least 300 ms duration were selected. Firing rates were measured using a 300 ms window placed at different time lags relative to the selected epochs. Regression of Equation 1 was used to determine the VTI. In addition, directional tuning depth was calculated (Carmena et al., 2003). Directional tuning depth was equal to the difference in the average firing rate between the directions of maximum and minimum firing, divided by the SD of the firing rate. Off-line predictions of hand velocity. Predictions of velocity were made from a weighted linear combination of neuronal firing rates using the following:
冘 n
V x共 t 兲 ⫽ b ⫹
w共兲n共t ⫹ 兲 ⫹ 共t兲 ,
⫽⫺m
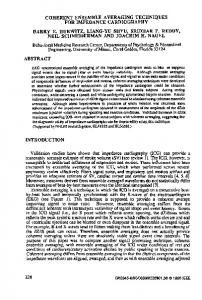
Figure 2. Frequency distributions of velocity (Vx and Vy) for different operations for monkey 1 (A–D) and monkey 2 (E–H ). A, E, Pole control, hand velocity. B, F, Brain control with hand movements, hand velocity. C, G, Brain control with hand movements, robot velocity. D, H, Brain control without hand movements, robot velocity.
(3) where n(t ⫹ ) is a vector of neuronal firing rates, at time t and time lag (negative lags correspond to past events), Vx is the x-component
4684 • J. Neurosci., May 11, 2005 • 25(19):4681– 4693
Lebedev et al. • Cortical Adaptation during BMI Control
of velocity at time t, w() is a vector of weights for each neuron at time lag , b is the y-intercept, and (t) is the residual error. An analogous equation was used to estimate Vy. These equations were solved using linear leastsquares regression. Ten time lags preceding velocity measurement with a bin size of 100 ms were used for predictions. In a separate analysis, estimations of velocity were calculated using a single 100 ms bin placed at different lags relative to velocity. Estimation quality was quantified by the correlation coefficient ( R). Random neuron dropping was implemented as follows: 10 min of neuronal population data were used to fit the model and find the weights, w(). These weights were then used to make predictions of velocity on a different 10 min period. A single neuron was then randomly removed from the population, the model retrained, and new predictions generated on the same data. This process was repeated until no neurons remained. Average R as a function of number of neurons was obtained by repeating this procedure 100 times.
Results Hand and robot velocity during different modes of operation The linear model was trained during pole control. However, after the mode of operation was switched to brain control, robot movements did not precisely match movements of the hand. This is illustrated by Figure 1C–H, which shows representative traces of the hand and the robot during pole and brain control. During pole control, movements of the hand and the robot were in close correspondence (Fig. 1C), which can also be seen in time-dependent plots of the x- and y-components of position (Fig. 1 E1,E2) and velocity (Fig. 1G1,G2). During BCWH, the hand and the robot moved differently (Fig. 1 D), albeit in a correlated manner (Fig. 1 F, H ). Figure 2 shows the frequency distribution of hand and robot velocities (Vx and Figure 3. Velocity tuning in M1 neuron tuned during pole control and brain control. A, Color plots of the firing rate of the Vy) during different modes of operation in neuron (color coded; key, bottom left) as a function of V and V (key, bottom left) for different lags with respect to IVM, different x y two monkeys. The correlation coefficient modes of operation (pole control and brain control with and without hand movements), and different velocity parameters (hand between the robot and hand velocities was or robot movements). B, Velocity tuning index as a function of lag for different types of operation (color coded; key on top). C, 0.995 ⫾ 0.001 (mean ⫾ SE) during pole Preferred direction as a function of lag (color coded; key on top). deg, Degrees. control versus 0.61 ⫾ 0.02 during BCWH in monkey 1 and 0.980 ⫾ 0.001 versus ities were similar during BCWH (Fig. 2C,G) and BCWOH (Fig. 0.50 ⫾ 0.04 in monkey 2. The difference between these values was 2D,H). highly significant statistically ( p ⬍ 0.001; Wilcoxon rank–sum test). Ranges of hand velocities were similar during pole (Fig. 2 A, E) and brain (Fig. 2 B, F ) control. However, a comparison of Neuronal tuning during different modes of operation robot velocities (Fig. 2C,G) with the hand velocities that accomWe analyzed neuronal data collected in nine daily recording sespanied them during brain control (Fig. 2 B, F ) showed that lower sions in monkey 1 and in 20 sessions in monkey 2. Analyzed robot velocities were less frequent than those of the hand. Absoneuronal samples on average consisted of 177 units per recording lute velocity of the hand (5.65 ⫾ 0.03 cm/s in monkey 1 and session in monkey 1 and 72 units in monkey 2. Examination of 4.51 ⫾ 0.04 cm/s in monkey 2) was statistically different ( p ⬍ 0.001; neuronal rates at different time lags relative to IVM (Fig. 1 B) Wilcoxon rank–sum test) from absolute velocity of the robot showed modulations correlated with velocity magnitude and di(6.93 ⫾ 0.03 and 7.00 ⫾ 0.03 for monkeys 1 and 2, respectively). rection (Figs. 3-5). We refer to correlation between neuronal rate Thus, the monkey’s hand often moved slowly, but the robot moved and velocity (Georgopoulos et al., 1988; Ashe and Georgopoulos, 1994; Moran and Schwartz, 1999; Carmena et al., 2003) as velocfaster, driven by neuronal ensemble activity. Ranges of robot veloc-
Lebedev et al. • Cortical Adaptation during BMI Control
J. Neurosci., May 11, 2005 • 25(19):4681– 4693 • 4685
zero velocity; x- and y-axes correspond to x- and y-components of velocity, respectively. These color plots are useful to evaluate the velocity tuning of a neuron at a glance. They contain information about both directional tuning of the neurons (direction is represented by a vector originating in the center of the plot) and their sensitivity to velocity magnitude (velocity magnitude is measured as the distance from the center of the plot). The color plots were constructed for different lags relative to the IVM and for different modes of operation (compare Figs. 3–5). Two sets of color-plots were calculated for BCWH, because during this mode of operation, hand movements did not match robot movements. One set relates firing rate to velocity of hand movements (Fig. 3A, second row from top). The other was calculated relative to robot velocity (Fig. 3A, third row from top). The color plots for BCWOH were calculated relative to robot velocity (Fig. 3A, bottom row). In addition, VTIs (Fig. 3B) and PDs (Fig. 3C) were plotted as a function of lag for different modes of operation. Individual neurons exhibited a diversity of tuning patterns that depended on the mode of operation. Figures 3–5 illustrate three representative neurons recorded in M1. Their tuning characteristics were averaged over five consecutive recording sessions. The neuron shown in Figure 3 was tuned during both pole and brain control. The VTI of this neuron peaked at ⬃200 ms before the IVM (Fig. 3B), and for all modes of operation, it was better tuned before the IVM than after it. Peak VTI values (Fig. 3B) for different modes of operation were significantly different ( p ⬍ 0.001; Kruskal–Wallis ANOVA; ␣ ⫽ 0.05 for Tukey’s multiple comparison). The highest VTI values were observed during pole control (Fig. 3B, blue Figure 4. An M1 neuron that was tuned to movement velocity only if the monkey’s hand moved. Conventions are as in Figure curve). During BCWH, tuning relative to 3. deg, Degrees. hand movements (Fig. 3B, red curve) was significantly diminished. However, tuning ity tuning. The degree of velocity tuning was quantified as the VTI relative to robot movements (Fig. 3B, black curve) was compara(see Materials and Methods). This normalized index measured ble with tuning during pole control (no statistical difference). the dependency of neuronal firing rate on both direction and Tuning during BCWOH was measured relative to robot movemagnitude of velocity. Because of normalization, the VTI was not ments. It was significantly lower than tuning relative to robot biased toward highly active neurons. Neurons tuned before the movements during BCWH but higher than tuning relative to IVM are more likely to have a causal relationship to movements, hand movements during BCWH. The PD of this neuron was for example by projecting to spinal motoneurons. Neurons tuned stable and similar for different modes of operation for the lags after the IVM may reflect sensory feedback. Pre-IVM and postpreceding the IVM (Fig. 3C). For the points after the IVM, the PD IVM tuning can also be related to movement patterns, such as rotated for all modes of operation except BCWOH. Thus, after acceleration and deceleration (Sergio and Kalaska, 1998; Johnson transition to brain control, this neuron retained many features of and Ebner, 2000; Todorov, 2000). The dependency of firing rate its original velocity tuning. However, it became less tuned to on x- and y-components of velocity is depicted in color plots (Fig. hand movements. 3A) (Johnson and Ebner, 2000; Lebedev et al., 2003; Paninski et Figure 4 illustrates a neuron whose tuning mostly reflected al., 2004). The color encodes firing rate (red, high rate; blue, low hand movements. Changes in the VTI during different modes of rate). The center of each color plot represents the firing rate for operation were statistically significant ( p ⬍ 0.001; Kruskal–Wal-
4686 • J. Neurosci., May 11, 2005 • 25(19):4681– 4693
Lebedev et al. • Cortical Adaptation during BMI Control
lis ANOVA; ␣ ⫽ 0.05 for Tukey’s multiple comparison). This neuron was tuned during pole control and BCWH. However, velocity tuning vanished during BCWOH (Fig. 4 A, B). Similar to the neuron illustrated in Figure 3, the highest VTIs of this neuron were observed for lags preceding the IVM, which may have been related to the causal relationship between the neuronal activity and hand movements. However, this neuron was also tuned after the IVM, especially during pole control. The PD depended on the lag relative to the IVM. It rotated counterclockwise (Fig. 4C) and completely reversed for lags succeeding the IVM. Comparable PD reversals have been reported previously in arm movement tasks and attributed to a representation of accelerative and decelerative forces (Sergio and Kalaska, 1998; Todorov, 2000). Note, in addition, that post-IVM tuning was markedly decreased when tuning was assessed relative to robot movements during brain control. Prevalence of pre-IVM tuning was also observed for the whole neuronal ensemble (see below). Because of the strong dependency of tuning on the presence of hand movements, this neuron is likely to have been critically involved in generation of descending motor commands (e.g., pyramidal tract neuron). Pairwise comparison of pole control with different types of brain control (which was somewhat different from grouping the data from different sessions together, because different types of brain control were not tested in every session) showed that in the majority of neurons (77 ⫾ 2%; mean ⫾ SE), the peak VTI for hand movements decreased after the transition to BCWH. During BCWH, the peak VTI relative to robot velocity exceeded the peak VTI relative to hand velocity in 84 ⫾ 2% of neurons. Each of these differences in proportions was highly significant statistically ( p ⬍ 0.001; Wilcoxon signed rank Figure 5. An M1 neuron with enhanced tuning to robot velocity during brain control without hand movements. Conventions test). Importantly, the peak VTI of a sub- are as in Figure 3. deg, Degrees. stantial number of neurons (38 ⫾ 2%) was higher during BCWOH than during pole control. A neuron of the latter type (Fig. 5) tiple comparison; ␣ ⫽ 0.05) showed that the peak VTI during had a peculiar tuning pattern: it was much better tuned during BCWH relative to hand was significantly less than the peak BCWOH than other conditions ( p ⬍ 0.001; Kruskal–Wallis VTI during pole control and BCWH and BCWOH relative to ANOVA; ␣ ⫽ 0.05 for Tukey’s multiple comparison). robot. This decrease in tuning to hand movements and better Population averages for all recording sessions confirmed that tuning to the actuator instead was observed in the majority of neurons typically became less tuned to hand movements and sampled areas. Statistical comparison of peak VTIs for indibetter tuned to robot movements (Table 1). Population avervidual cortical areas is presented in Table 1. ages of peak VTIs were 0.074 ⫾ 0.002 for pole control, 0.056 ⫾ 0.002 for BCWH relative to hand, 0.077 ⫾ 0.003 for BCWH Tuning patterns for the whole ensemble relative to robot, and 0.070 ⫾ 0.001 for BCWOH relative to Color plots of Figure 6 show VTIs as a function of lag for the robot (mean ⫾ SE) in monkey 1 and 0.104 ⫾ 0.005, 0.069 ⫾ whole neuronal ensemble. They present VTI curves (Figs. 3B, 4 B, 0.004, 0.118 ⫾ 0.002, and 0.126 ⫾ 0.007 in monkey 2. Changes 5B) in color-coded format, stacked one above the other, so that in the peak VTI were statistically significant ( p ⬍ 0.001; each line corresponds to a neuron. It can be seen that for the Kruskal–Wallis ANOVA). Pairwise comparison (Tukey’s mul-
Lebedev et al. • Cortical Adaptation during BMI Control
J. Neurosci., May 11, 2005 • 25(19):4681– 4693 • 4687
Table 1. Velocity tuning index (mean ⴞ SE) by cortical area and condition Monkey 1 PMd (n ⫽ 62) M1 (n ⫽ 54) S1 (n ⫽ 37) SMA (n ⫽ 18) M1 ipsilateral (n ⫽ 6) All neurons (n ⫽ 177) Monkey 2 PP (n ⫽ 52) M1 (n ⫽ 15) SMA (n ⫽ 5) All neurons (n ⫽ 72)
Pole control (a)
BCWH, relative to hand (b)
BCWH, relative to robot (c)
BCWOH, relative to robot (d)
BCWOH, shuffled data (e)
0.047 ⫾ 0.002 c, d 0.127 ⫾ 0.005 b, d, e 0.059 ⫾ 0.003 b, d, e 0.055 ⫾ 0.006 0.035 ⫾ 0.002 d 0.074 ⫾ 0.002 b, c, d, e
0.046 ⫾ 0.003 c, d 0.089 ⫾ 0.004 a, c, e 0.036 ⫾ 0.002 a, c, d, e 0.049 ⫾ 0.008 d 0.026 ⫾ 0.003 d 0.056 ⫾ 0.002 a, c, d
0.063 ⫾ 0.004 a, b, e 0.116 ⫾ 0.006 b, e 0.054 ⫾ 0.003 b, d 0.063 ⫾ 0.010 0.037 ⫾ 0.002 0.077 ⫾ 0.003 a, b, e
0.060 ⫾ 0.002 a, b, e 0.096 ⫾ 0.003 a, e 0.060 ⫾ 0.002 b, c, e 0.055 ⫾ 0.004 b 0.044 ⫾ 0.002 a, b, e 0.070 ⫾ 0.001 a, b, e
0.045 ⫾ 0.001 c, d 0.071 ⫾ 0.003 a, b, c, d 0.044 ⫾ 0.001 a, b, d 0.046 ⫾ 0.003 0.034 ⫾ 0.002 d 0.052 ⫾ 0.001 a, c, d
0.104 ⫾ 0.005 b, c, d 0.080 ⫾ 0.004 b, c, d 0.078 ⫾ 0.005 b 0.097 ⫾ 0.004 b, c, d
0.069 ⫾ 0.004 a, c, d, e 0.042 ⫾ 0.002 a, c, d, e 0.040 ⫾ 0.002 a, c, d, e 0.061 ⫾ 0.003 a, c, d, e
0.118 ⫾ 0.005 a, b, e 0.102 ⫾ 0.002 a, b, e 0.108 ⫾ 0.005 b 0.114 ⫾ 0.004 a, b, e
0.126 ⫾ 0.007 a, b, e 0.125 ⫾ 0.005 a, b, e 0.126 ⫾ 0.006 b 0.126 ⫾ 0.005 a, b, e
0.082 ⫾ 0.007 b, c, d 0.065 ⫾ 0.002 b, c, d 0.094 ⫾ 0.009 b 0.079 ⫾ 0.005 b, c, d
Numbers represent mean ⫾ SE and the columns for which Tukey’s multiple comparison test indicated significant difference (p ⬍ 0.05).
ensemble as a whole, tuning to hand movements decreased during BCWH (Fig. 6 A2) compared with tuning during pole control (Fig. 6 A1) and tuning to robot movements during BCWH (Figs. 6 A3, 4). Individual neurons exhibited a diversity of VTI changes. Averaging VTIs for the whole ensemble (Fig. 6 B) confirmed a decrease in tuning to hand movements during BCWH (Fig. 6 B, compare blue and red curves). VTIs for robot movements (Fig. 6 B, black and green curves) were clearly higher before than after the IVM. This occurred for two reasons. First, only the bins preceding the IVM contributed to the on-line predictions of velocity. Second, as a result of the delay of the robotic system (⬃100 ms), the curves were shifted to the left. VTIs for hand movements during pole and brain control peaked closer to IVM compared with robot movements. Average VTIs for the whole ensemble were similar to those for M1 (Fig. 6 B, C), because in the sampled neuronal population, M1 neurons were tuned most strongly. The occurrence of tuning of the neuronal ensemble to robot velocity during BCWOH is not surprising, because the weighted sum of neuronal firing rates was made to control the robot. However, neuronal tuning to robot movements during BCWOH was not a simple consequence of using the linear model (as it would be if just one neuron controlled the BMI). Rather, correlated firing of the whole ensemble played a role in the tuning properties of individual neurons. This was shown using the shuffle test. The average VTI decreased after the correlation between the neurons was destroyed by the shuffling procedure (see Materials and Methods), as seen in Figure 6, B and C (dotted green lines vs solid green lines) and Table 1. This decrease was statistically significant for both monkeys ( p ⬍ 0.001; Wilcoxon signed rank test; means and SDs are presented in Table 1). Thus, tuning of any individual neuron was not related only to the weights assigned to that neuron by the linear model but also depended on the firing of the rest of the ensemble. We have shown previously (Carmena et al., 2003) that firing of individual neurons was correlated, and this correlation increased in brain control. Because of the enhancement in correlated activity, VTIs of individual neurons increased as well. Preferred directions plotted as a function of lag relative to the IVM (Fig. 7A) showed that, generally, there was no fixed PD for each neuron. Rather, PDs rotated with lag changes similarly to the examples in Figure 3 and 4. This rotation is consistent with previous results of Sergio and Kalaska (1998), Todorov (2000), and Johnson and Ebner (2000). After the mode of operation was switched to brain control, if the monkeys continued to move their arms, the pattern of PDs generally resembled that of pole control (Fig. 7A1–A3). Correspondence index analysis indicated that the best correspondence between the PDs measured with
respect to hand movements during pole control and BCWH occurred at the time of the IVM (Fig. 7B, red line), whereas PDs measured with respect to robot movements were in best correspondence to pole control ⬃100 ms before the IVM (Fig. 7B, black line). This is in agreement with average VTI curves (Fig. 6 B). Statistical analysis of peak values of correspondence indices showed better correspondence between the PDs during pole control and BCWH measured with respect to robot movements compared with the values measured with respect to hand movements, which was statistically significant for monkey 1 (0.38 ⫾ 0.01 vs 0.33 ⫾ 0.01; mean ⫾ SE; p ⬍ 0.05; Wilcoxon signed rank test) and did not reach statistical significance for monkey 2 (0.66 ⫾ 0.03 vs 0.59 ⫾ 0.04; p ⬎ 0.05). The PDs during BCWOH (Fig. 7A4) were confined to a narrower angular range and rotated much less with changes in the lag than those observed during pole control (Fig. 7A1) and BCWH (Fig. 7A2,A3) (Carmena et al., 2003). Correspondence index analysis, however, indicated a relatively good match between the PDs during BCWOH and pole control for the 100 ms lag preceding the IVM (Fig. 7B, green line). Peak values of the correspondence between the PDs during BCWOH and pole control for monkey 1 (0.24 ⫾ 0.01) were significantly less than the correspondence index between pole control and BCWH ( p ⬍ 0.05; Wilcoxon signed rank test), and the values for monkey 2 (0.52 ⫾ 0.05) were not significantly different ( p ⬎ 0.05). Neuronal tuning for selected hand movements Changes in neuronal tuning to hand movements that occurred after the monkeys started to perform in brain control could be related, among other factors, to differences in the pattern of hand movements. To test whether these changes would still be present if the same hand movements were compared, we selected epochs during which the monkeys’ hands or the robot moved in straight lines for at least 300 ms (Fig. 8 A). For these epochs, we constructed classical tuning curves, which represented average firing rate as a function of movement direction (Fig. 8 B). Directional tuning depth (Fig. 8C) and VTI (Fig. 8 D), calculated as functions of the lag between the 300 ms window in which firing rate was measured, showed the same effect as demonstrated with other methods: both directional tuning depth and VTI with respect to hand movements were less during BCWH than during pole control. Average peak tuning depth was 0.55 ⫾ 0.01 and 0.71 ⫾ 0.01 in monkeys 1 and 2, respectively, during pole control, and it was 0.44 ⫾ 0.01 and 0.55 ⫾ 0.01 during brain control. Average peak VTI was 0.203 ⫾ 0.005 and 0.277 ⫾ 0.005 (monkeys 1 and 2) during pole control versus 0.161 ⫾ 0.004 and 0.207 ⫾ 0.005 during brain control. These differences between tuning to hand movements in pole
4688 • J. Neurosci., May 11, 2005 • 25(19):4681– 4693
Lebedev et al. • Cortical Adaptation during BMI Control
control and brain control were statistically significant ( p ⬍ 0.001; Wilcoxon signed rank test). Off-line predictions of hand velocity during pole and brain control Similar to the decrease in VTIs, the quality of off-line predictions of hand velocity decreased during BCWH (Fig. 9A). In this analysis, the linear model was trained to predict hand velocity using either polecontrol or brain-control data as training epochs. Ten minute (Fig. 9A) or 5 min (Table 2) data segments were used for training. Predictions were then tested on a new 10 or 5 min epoch (splitting the data into 5 min epochs was useful for statistical analysis, although prediction quality was less compared with 10 min epochs, which was also used for training the model during online predictions). Prediction quality dropped during brain control (Fig. 9A). This decrease occurred quite abruptly after the operation was switched to brain control (Fig. 9B). Average R values for predictions of hand velocity using 5 min segments of data during pole control were 0.64 ⫾ 0.02 and 0.48 ⫾ 0.01 for monkey 1 and 2, respectively, whereas they were 0.40 ⫾ 0.01 and 0.30 ⫾ 0.01 for predictions of hand velocity made during BCWH (Table 2). This change in R values was statistically significant ( p ⬍ 0.001; Kruskal– Wallis ANOVA; ␣ ⫽ 0.05 for Tukey’s multiple comparison). To inspect changes in contribution to velocity prediction for different lags between the velocity and neuronal activity, velocity predictions were performed using a single 100 ms sampling window. The window was placed at different lags with respect to the IVM. This analysis showed a decrease in prediction for all tested lags (Fig. 9C). It is important to note that the same Figure 6. Changes in velocity tuning for the whole ensemble. A, VTI as a function of lag relative to IVM for the ensemble drop in prediction quality for hand veloc- recorded in monkey 1. Each row corresponds to a neuron. VTI values are shown for pole control (1), brain control with hand ity as we show here in the off-line analyses movements, relative to hand (2) and to robot (3), and brain control without hand movements, relative to robot (4). ips, Ipsilateral. occurred during the experimental sessions B, Average VTIs as a function of lag for different conditions (color coded; key on right). Average VTI for shuffled data during brain control without hand movements is shown by the green dotted line. Averages are shown for the whole ensemble. C, Average VTIs as well after the mode of operation was as a function of lag for M1 only. switched to brain control. However, such deterioration in prediction quality only meant that the model became less predicactuator, it is less representative of the movements of the animal’s tive of the velocity of the hand. This decrease in predictions of hand own limb. Although the original rate of the sample of recorded movement did not impede the behavioral performance, which was cortical neurons was initially modulated in association with hand determined by the robot movements rather than hand movements. movements, after these neurons became involved in brain conBehavioral performance improved with training in brain control trol, they became less correlated with hand movements. More(Carmena et al., 2003), suggesting that cortical representation of the over, neuronal tuning to the movements of the actuator was enrobot was optimized at the expense of representation of the animal’s hanced because of increased correlation between the neurons. own limb. This result accords with the vast literature showing that neuronal Discussion modulations in cortical motor areas do not exclusively reflect limb movements and that cognitive signals are abundant in these The principal finding of this study is that once cortical ensemble activity is switched to represent the movements of the artificial areas (for review, see Wise et al., 1997; Georgopoulos, 2000; John-
Lebedev et al. • Cortical Adaptation during BMI Control
J. Neurosci., May 11, 2005 • 25(19):4681– 4693 • 4689
Neurophysiological studies have shown that modulations in cortical areas that occur during movement planning and execution often reflect abstract parameters of movements rather than low-level details. Cortical neurons can encode movement direction regardless of muscle patterns (Kakei et al., 1999, 2001), represent target of movement and movement of the hand-controlled visual marker toward it rather than actual hand trajectory (Alexander and Crutcher, 1990; Shen and Alexander, 1997a,b; Ochiai et al., 2002), encode multiple spatial variables (Lebedev et al., 2004; Cisek and Kalaska, 2005), reflect orientation of selective spatial attention (Lebedev and Wise, 2001), and represent misperceived movements of visual targets (Lebedev et al., 2001; Lebedev and Wise, 2002; Schwartz et al., 2004). In addition, frontal cortex neurons can flexibly adapt to new visuomotor (Wise et al., 1998; Paz et al., 2003; Paz and Vaadia, 2004) and dynamic (Li et al., 2001; Padoa-Schioppa et al., 2004) conditions. Based on the results presented here, we suggest that neuronal mechanisms underlying these adaptive properties can also subserve cortical ensemble adaptation during the BMI operation. Operating a BMI is not unlike using mechanical tools, and the idea that body schema can extend along a wielded tool was formulated almost 100 years ago (Head and Holmes, 1911). This suggestion was substantiated much later by neurophysiological data showing that cortical neurons responsive to both somatosensory and visual stimuli extended their receptive fields along a rake that a monkey used to retrieve distant objects (Iriki et al., Figure 7. Changes in preferred directions for the whole ensemble. A, PD as a function of lag relative to IVM for the ensemble 1996). Effects consistent with the idea of recorded in monkey 1. Each row corresponds to a neuron. PDs are shown for pole control (1), brain control with hand movements, remapping body schema after tool usage relative to hand (2) and to robot (3), and brain control without hand movements, relative to robot (4). ips, Ipsilateral. B, Corre- have been also observed in human psychophysics experiments (for review, see Maraspondence index describing the similarity between PD distribution during pole control and brain control. deg, Degrees. vita et al., 2003). A recent neuroimaging study (Maruishi et al., 2004) reported specific activations of the right ventral premoson et al., 2001; Andersen and Buneo, 2002; Paz et al., 2004). For tor cortex during manipulation of a myoelectric prosthetic hand. instance, neuroimaging studies in human subjects have shown an The authors interpreted this result as the recognition by the brain activation of cortical motor areas in the absence of limb moveof the prosthetic hand as a “high performance alternative to a real ments (e.g., when subjects imagine that they produce movehand.” Perhaps a long-term operation of a BMI-controlled actuaments) (Leonardo et al., 1995; Porro et al., 1996; Ehrsson et al., tor would lead to even more vivid perception of the actuator 2003) or when the illusion of limb movement is induced by musbeing a body part rather than merely a tool or an alternative to the cle vibration (Naito et al., 1999). Moreover, Graziano et al. (Grareal hand. In support of this suggestion, perceived voluntary ziano, 1999; Graziano et al., 2000) demonstrated that if the vision movements of phantom limbs in amputees were associated with of the monkey’s own arm was occluded, PMd and PP neurons primary sensorimotor cortex activation (Roux et al., 2003). reflected the position of a visible, realistic false arm, but at the When interpreting neuronal patterns during BMI control as same time, they were not sensitive to unrealistic substitutes for reflecting a new representation of the artificial actuator, however, the arm. A recent neuroimaging study confirmed this result by demone should be careful, because the BMI design effectively makes onstrating similar activations that occurred in human premotor corany modulation of neuronal activity translate into the movetex when the subjects experienced a rubber hand illusion (Ehrsson et ments of the actuator. One piece of evidence that the system al., 2004). Thus, cortical representation of the limb is highly flexible adapts to control the actuator comes from the nonrandomness of and susceptible to illusions and mental imagery. the actuator movements and behavioral improvements as the
4690 • J. Neurosci., May 11, 2005 • 25(19):4681– 4693
Figure 8. Analysis of neuronal tuning for straight trajectories of the hand. A, Straight trajectories of the hand selected for eight movement directions during pole control and brain control with hand movements. B, Directional tuning curves calculated for the traces above by averaging firing rates for different movement directions within a 300 ms window leading the movement by 100 ms. Each horizontal line represents a curve for a particular neuron. ips, Ipsilateral; deg, degrees. C, Directional tuning depth as a function of lag between the firing rate window and movement trace. D, Velocity tuning index.
monkey trains (Taylor et al., 2002; Carmena et al., 2003). The second piece of evidence is coordinated activity of the neurons in the ensemble. Extending our previous demonstration of increased correlation between the neurons during brain control (Carmena et al., 2003), we showed here using the shuffle test that neuronal correlation enhanced tuning to robot velocity in individual neurons. Moreover, tuning of the same neurons to hand
Lebedev et al. • Cortical Adaptation during BMI Control
velocity decreased, and this decrease occurred even for the relatively stereotypical subset of hand movements having a straight-line trajectory (Fig. 8). Together, these observations suggest that the neuronal ensemble adapted to represent the actuator at the expense of the representation of the animal’s own limb. Tuning patterns in the entire ensemble (Fig. 5A) during pole control and brain control with and without hand movements showed that, in general, most of the neurons that encoded movement velocity during pole control continued to do so during the BMI operation. How then could the monkeys operate the BMI and at the same time inhibit movements of their hands? We suggest that subtle rather than dramatic differences in the way the activity of individual neurons was combined at the ensemble level determined this novel behavioral outcome. For example, although the overall modulation pattern was similar across behavioral states, some neurons (Fig. 4) did not modulate when the monkeys’ hands stopped moving, whereas others (Fig. 3) were strongly modulated. It should be noted that the neuronal ensemble that was recorded and used to control the BMI constituted only a tiny part of the entire network normally involved in controlling arm movements. It is possible that these selected neurons were preferentially modulated to control the actuator during BCWOH, whereas the ones that were not recorded from continued to operate as normally. Alternatively, the ensemble controlling the BMI could be assisted by a neuronal network to which it was connected. Additional studies will be needed to resolve between these possibilities. Our finding that after learning to control an artificial actuator using a BMI, neuronal ensembles represented the actuator velocity better than the velocity of the animal’s own arm appears to support the theory of optimal feedback control (Todorov and Jordan, 2002; Scott, 2004). This theory describes the motor system as a stochastic feedback controller that optimizes only those motor parameters that are necessary to achieve task goals. In our study, the task goals were achieved by the robot. Thus, in terms of optimal feedback control theory, cortical ensembles should adapt to represent the goal-related variable although it is related to the robot instead of the limb. The present observations also suggest that the quality of predictions in open-loop mode that computational neuroscientists are striving to achieve may be relatively unimportant for closedloop BMI control. Once the neuronal ensemble starts to control a BMI, imperfections in the model may be compensated by neuronal adaptations that improve control of the actuator movements. Whereas they improve the BMI performance, these adaptations may actually worsen the predictions of hand movements, the effect that we observed here. These considerations concur with the results of Taylor et al. (2002), who showed differences in tuning properties of M1 neurons during hand movements and during a BMI control that used a coadaptive algorithm for adjusting the model weights in the absence of hand movements. To clarify the dynamics of cortical plasticity associated with BMI control and to elucidate the exact mechanism of cortical adaptation to represent an artificial actuator will require additional studies. It is very likely that the features of such adaptations will depend on concrete requirements for the BMI operations. For example, it is possible that if the subject is required to subserve the BMI control with limb movements, the system may come to an optimal solution in which both the limb and the actuator are represented. Alternatively, if limb movement is not required, the system may gradually evolve to a different state (Taylor et al., 2002; Carmena et al., 2003). It is also possible that certain neuronal adaptations could work as temporary solutions
Lebedev et al. • Cortical Adaptation during BMI Control
J. Neurosci., May 11, 2005 • 25(19):4681– 4693 • 4691
In conclusion, we propose that a widespread process of cortical plasticity, resulting from BMI operation, may lead to the establishment of a representation of an artificial actuator into multiple cortical areas. This raises the interesting hypothesis that the distinct levels of primate proficiency in tool manufacturing and utilization may be defined by the ability of these animals to incorporate the properties of these tools as extensions of the subject’s own body.
References Alexander GE, Crutcher MD (1990) Neural representations of the target (goal) of visually guided arm movements in three motor areas of Figure 9. Off-line predictions of hand velocity under different conditions (key on top). A, Neuron-dropping curves depicting the monkey. J Neurophysiol 64:164 –178. hand prediction quality as a function of neuronal sample size. B, Temporal dynamics of prediction quality for the entire ensemble. Andersen RA, Buneo CA (2002) Intentional C, Prediction quality estimated using a single 100 ms bin placed at different lags with respect to IVM. maps in posterior parietal cortex. Annu Rev Neurosci 25:189 –220. Ashe J, Georgopoulos AP (1994) Movement parameters and neural activity in motor cortex Table 2. Prediction of hand velocity during pole control and brain control with hand and area 5. Cereb Cortex 4:590 – 600. movements using 5 min epochs for training the model and testing predictions Averbeck BB, Chafee MV, Crowe DA, Georgopoulos AP (2005) The parietal representation of hand velocity in a copy task. J Neurophysiol 93:508 –518. Brain control model Brain control model trained in pole trained in brain Baker SN, Spinks R, Jackson A, Lemon RN (2001) Synchronization in monPole control (a) control (b) control (c) key motor cortex during a precision grip task. I. Task-dependent modulation in single-unit synchrony. J Neurophysiol 85:869 – 885. Monkey 1 Carmena JM, Lebedev MA, Crist RE, O’Doherty JE, Santucci DM, Dimitrov 0.63 ⫾ 0.02 b, c 0.39 ⫾ 0.01 a, c 0.44 ⫾ 0.01 a, b Prediction of Vx D, Patil PG, Henriquez CS, Nicolelis MA (2003) Learning to control a 0.65 ⫾ 0.02 b, c 0.42 ⫾ 0.01 a 0.45 ⫾ 0.01 a Prediction of Vy brain-machine interface for reaching and grasping by primates. PLoS Biol Monkey 2 1:193–208. 0.55 ⫾ 0.01 b, c 0.40 ⫾ 0.01 a 0.43 ⫾ 0.02 a Prediction of Vx Chapin JK, Moxon KA, Markowitz RS, Nicolelis MAL (1999) Real-time 0.40 ⫾ 0.01 b, c 0.20 ⫾ 0.01 a 0.25 ⫾ 0.02 a Prediction of Vy control of a robot arm using simultaneously recorded neurons in the Numbers represent mean R (correlation coefficient between actual and predicted velocities) ⫾ SD and the columns motor cortex. Nat Neurosci 2:664 – 670. for which Tukey’s multiple comparison test indicated significant difference (p ⬍ 0.05). Cheney PD, Fetz EE (1980) Functional classes of primate corticomotoneuronal cells and their relation to active force. J Neurophysiol 44:773–791. Cisek P, Kalaska JF (2005) Neural correlates of reaching decisions in dorsal premotor cortex: specification of multiple direction choices and final selection of action. Neuron 45:801– 814. to maintain performance. Previously, we reported (Carmena et Cohen D, Nicolelis MAL (2004) Reduction of single-neuron firing unceral., 2003) that, as a consequence of the increase in correlation tainty by cortical ensembles during motor skill learning. J Neurosci between the neurons during BCWOH, PDs of many neurons 24:3574 –3582. became more similar (Fig. 6 A). This effect may appear maladapDonchin O, Gribova A, Steinberg O, Bergman H, Vaadia E (1998) Primary tive, because PD diversity is likely to improve directional encodmotor cortex is involved in bimanual coordination. Nature 395:274 –278. ing (Georgopoulos et al., 1986, 1988). However, our present analEhrsson HH, Geyer S, Naito E (2003) Imagery of voluntary movement of ysis using the shuffling procedure showed that tuning of fingers, toes, and tongue activates corresponding body-part-specific moindividual neurons was increased because of the correlation betor representations. J Neurophysiol 90:3304 –3316. Ehrsson HH, Spense C, Passingham RE (2004) That’s my hand! Activity in tween neurons. Thus, the neuronal ensemble controlling the BMI premotor cortex reflects feeling of ownership of a limb. Science may have been optimizing its performance by finding a trade-off 305:875– 877. between the magnitude of tuning and the diversity of PDs. It is Evarts EV (1966) Pyramidal tract activity associated with a conditioned hand possible that increased correlation was a temporary effect, and movement in the monkey. J Neurophysiol 29:1011–1027. with prolonged and intensive training to control the BMI, the Floyer-Lea A, Matthews PM (2004) Changing brain networks for visuomoneuronal ensemble would eventually return to the original distritor control with increased movement automaticity. J Neurophysiol bution of PDs and neuronal correlations. Even during learning of 92:2405–2412. relatively simple motor skills, highly distributed cortical netFu QG, Flament D, Coltz JD, Ebner TJ (1995) Temporal encoding of movement kinematics in the discharge of primate primary motor and premoworks undergo transient changes before settling to the level of tor neurons. J Neurophysiol 73: 836 – 854 automated performance, as shown by human neuroimaging Georgopoulos AP (2000) Neural aspects of cognitive motor control. Curr studies (Jueptner et al., 1997; Floyer-Lea and Matthews, 2004). Opin Neurobiol 10:238 –241. Interestingly, epochs of high attention to motor performance Georgopoulos AP, Schwartz AB, Kettner RE (1986) Neuronal population (and increased attention is very likely needed for successful learncoding of movement direction. Science 233:1416 –1419. ing to control a BMI) have been found to be associated with Georgopoulos AP, Kettner RE, Schwartz AB (1988) Primate motor cortex increases of synchrony between neurons (Murthy and Fetz, 1992, and free arm movements to visual targets in three-dimensional space. II. 1996a,b; Riehle et al., 1997, 2000; Hatsopoulos et al., 1998; LebCoding of the direction of movement by a neuronal population. J Neuedev and Wise, 2000; Baker et al., 2001). rosci 8:2928 –2932.
4692 • J. Neurosci., May 11, 2005 • 25(19):4681– 4693 Georgopoulos AP, Ashe J, Smyrnis N, Taira M (1992) The motor cortex and the coding of force. Science 256:1692–1695. Graziano MS (1999) Where is my arm? The relative role of vision and proprioception in the neuronal representation of limb position. Proc Natl Acad Sci USA 96:10418 –10421. Graziano MS, Cooke DF, Taylor CS (2000) Coding the location of the arm by sight. Science 290:1782–1786. Gurfinkel VS, Levick YS, Lebedev MA (1991) Body scheme concept and motor control. Body scheme in the postural automatisms regulation. In: Intellectual processes and their modelling, pp 24 –53. Moscow: Nauka. Hatsopoulos NG, Ojakangas CL, Paninski L, Donoghue JP (1998) Information about movement direction obtained from synchronous activity of motor cortical neurons. Proc Natl Acad Sci USA 95:15706 –15711. Head H, Holmes G (1911) Sensory disturbances from cerebral lesion. Brain 34:102–254. Iriki A, Tanaka M, Iwamura Y (1996) Coding of modified body schema during tool use by macaque postcentral neurons. NeuroReport 7:2325–2330. Jueptner M, Stephan KM, Frith CD, Brooks DJ, Frackowiak RS, Passingham RE (1997) Anatomy of motor learning. I. Frontal cortex and attention to action. J Neurophysiol 77:1313–1324. Johnson MT, Ebner TJ (2000) Processing of multiple kinematic signals in the cerebellum and motor cortices. Brain Res Brain Res Rev 33:155–168. Johnson MT, Mason CR, Ebner TJ (2001) Central processes for the multiparametric control of arm movements in primates. Curr Opin Neurobiol 11:684 – 688. Kakei S, Hoffman DS, Strick PL (1999) Muscle and movement representations in the primary motor cortex. Science 285:2136 –2139. Kakei S, Hoffman DS, Strick PL (2001) Direction of action is represented in the ventral premotor cortex. Nat Neurosci 4:1020 –1025. Kralik JD, Dimitrov DF, Krupa DJ, Katz DB, Cohen D, Nicolelis MAL (2001) Techniques for long-term multisite neuronal ensemble recordings in behaving animals. Methods 25:121–150. Lebedev MA, Wise SP (2000) Oscillations in the premotor cortex: singleunit activity from awake, behaving monkeys. Exp Brain Res 130:195–215. Lebedev MA, Wise SP (2001) Tuning for the orientation of spatial attention in dorsal premotor cortex. Eur J Neurosci 13:1002–1008. Lebedev MA, Wise SP (2002) Insights into seeing and grasping: distinguishing the neural correlates of perception and action. Behav Cogn Neurosci Rev 1:108 –129. Lebedev MA, Denton JM, Nelson RJ (1994) Vibration-entrained and premovement activity in monkey primary somatosensory cortex. J Neurophysiol 72:1654 –1673. Lebedev MA, Douglass DK, Moody SL, Wise SP (2001) Prefrontal cortex neurons reflecting reports of a visual illusion. J Neurophysiol 85:1395–1411. Lebedev MA, Carmena JM, Nicolelis MAL (2003) Directional tuning of frontal and parietal neurons during operation of brain–machine interface. Soc Neurosci Abstr 29:279.22. Lebedev MA, Messinger A, Kralik JD, Wise SP (2004) Representation of attended versus remembered locations in prefrontal cortex. PLoS Biol 2:1919 –1935. Lee D, Port NL, Kruse W, Georgopoulos AP (1998) Variability and correlated noise in the discharge of neurons in motor and parietal areas of the primate cortex. J Neurosci 18:1161–1170. Leonardo M, Fieldman J, Sadato N, Campbell G, Ibanez V, Cohen L, Deiber M, Jezzard P, Pons T, Turner R, Le Bihan D, Hallett M (1995) A functional magnetic resonance imaging study of cortical regions associated with motor task execution and motor ideation in humans. Hum Brain Mapp 3:83–92. Li CS, Padoa-Schioppa C, Bizzi E (2001) Neuronal correlates of motor performance and motor learning in the primary motor cortex of monkeys adapting to an external force field. Neuron 30:593– 607. Maravita A, Spence C, Driver J (2003) Multisensory integration and the body schema: close to hand and within reach. Curr Biol 13:R531–R539. Maruishi M, Tanaka Y, Muranaka H, Tsuji T, Ozawa Y, Imaizumi S, Miyatani M, Kawahara J (2004) Brain activation during manipulation of the myoelectric prosthetic hand: a functional magnetic resonance imaging study. NeuroImage 21:1604 –1611. Moran DW, Schwartz AB (1999) Motor cortical representation of speed and direction during reaching. J Neurophysiol 82:2676 –2692.
Lebedev et al. • Cortical Adaptation during BMI Control Murthy VN, Fetz EE (1992) Coherent 25- to 35-Hz oscillations in the sensorimotor cortex of awake behaving monkeys. Proc Natl Acad Sci USA 89:5670 –5674. Murthy VN, Fetz EE (1996a) Oscillatory activity in sensorimotor cortex of awake monkeys: synchronization of local field potentials and relation to behavior. J Neurophysiol 76:3949 –3967. Murthy VN, Fetz EE (1996b) Synchronization of neurons during local field potential oscillations in sensorimotor cortex of awake monkeys. J Neurophysiol 76:3968 –3982. Musallam S, Corneil BD, Greger B, Scherberger H, Andersen RA (2004) Cognitive control signals for neural prosthetics. Science 305:258 –262. Naito E, Ehrsson HH, Geyer S, Zilles K, Roland PE (1999) Illusory arm movements activate cortical motor areas: a positron emission tomography study. J Neurosci 19:6134 – 6144. Nicolelis MA, Baccala LA, Lin RC, Chapin JK (1995) Sensorimotor encoding by synchronous neural ensemble activity at multiple levels of the somatosensory system. Science 268:1353–1358. Nicolelis MAL (2001) Actions from thoughts. Nature 409:403– 407. Nicolelis MAL (2003) Brain-machine interfaces to restore motor function and probe neural circuits. Nat Rev Neurosci 4:417– 422. Nicolelis MAL, Ribeiro S (2002) Multielectrode recordings: the next steps. Curr Opin Neurobiol 12:602– 606. Nicolelis MAL, Ghazanfar AA, Faggin BM, Votaw S, Oliveira LM (1997) Reconstructing the engram: simultaneous, multisite, many single neuron recordings. Neuron 18:529 –537. Nicolelis MAL, Dimitrov D, Carmena JM, Crist R, Lehew G, Kralik JD, Wise SP (2003) Chronic, multisite, multielectrode recordings in macaque monkeys. Proc Natl Acad Sci USA 100:11041–11046. Ochiai T, Mushiake H, Tanji J (2002) Effects of image motion in the dorsal premotor cortex during planning of an arm movement. J Neurophysiol 88:2167–2171. Padoa-Schioppa C, Li CS, Bizzi E (2004) Neuronal activity in the supplementary motor area of monkeys adapting to a new dynamic environment. J Neurophysiol 91:449 – 473. Paninski L, Fellows MR, Hatsopoulos NG, Donoghue JP (2004) Spatiotemporal tuning of motor cortical neurons for hand position and velocity. J Neurophysiol 91:515–532. Patil PG, Carmena JM, Nicolelis MA, Turner DA (2004) Ensemble recordings of human subcortical neurons as a source of motor control signals for a brain-machine interface. Neurosurgery 55:27–35. Paz R, Vaadia E (2004) Learning-induced improvement in encoding and decoding of specific movement directions by neurons in the primary motor cortex. PLoS Biol 2:264 –274. Paz R, Boraud T, Natan C, Bergman H, Vaadia E (2003) Preparatory activity in motor cortex reflects learning of local visuomotor skills. Nat Neurosci 6:882– 890. Paz R, Wise SP, Vaadia E (2004) Viewing and doing: similar cortical mechanisms for perceptual and motor learning. Trends Neurosci 27:496 –503. Porro CA, Francescato MP, Cettolo V, Diamond ME, Baraldi P, Zuiani C, Bazzocchi M, di Prampero PE (1996) Primary motor and sensory cortex activation during motor performance and motor imagery: a functional magnetic resonance imaging study. J Neurosci 16:7688 –7698. Riehle A, Grun S, Diesmann M, Aertsen A (1997) Spike synchronization and rate modulation differentially involved in motor cortical function. Science 278:1950 –1953. Riehle A, Grammont F, Diesmann M, Grun S (2000) Dynamical changes and temporal precision of synchronized spiking activity in monkey motor cortex during movement preparation. J Physiol (Paris) 94:569 –582. Roux FE, Lotterie JA, Cassol E, Lazorthes Y, Sol JC, Berry I (2003) Cortical areas involved in virtual movement of phantom limbs: comparison with normal subjects. Neurosurgery 53:1342–1352. Schwartz AB, Moran DW, Reina GA (2004) Differential representation of perception and action in the frontal cortex. Science 303:380 –383. Scott SH (2004) Optimal feedback control and the neural basis of volitional motor control. Nat Rev Neurosci 5:532–546. Sergio LE, Kalaska JF (1998) Changes in the temporal pattern of primary motor cortex activity in a directional isometric force versus limb movement task. J Neurophysiol 80:1577–1583.
Lebedev et al. • Cortical Adaptation during BMI Control Serruya MD, Hatsopoulos NG, Paninski L, Fellows MR, Donoghue JP (2002) Instant neural control of a movement signal. Nature 416:141–142. Shadlen MN, Newsome WT (1998) The variable discharge of cortical neurons: implications for connectivity, computation, and information coding. J Neurosci 18:3870 –3896. Shen L, Alexander GE (1997a) Neural correlates of a spatial sensory-to-motor transformation in primary motor cortex. J Neurophysiol 77:1171–1194. Shen L, Alexander GE (1997b) Preferential representation of instructed target location versus limb trajectory in dorsal premotor area. J Neurophysiol 77:1195–1212. Taylor DM, Tillery SI, Schwartz AB (2002) Direct cortical control of 3D neuroprosthetic devices. Science 296:1829 –1832. Todorov E (2000) Direct cortical control of muscle activation in voluntary arm movements: a model. Nat Neurosci 3:391–398.
J. Neurosci., May 11, 2005 • 25(19):4681– 4693 • 4693 Todorov E, Jordan MI (2002) Optimal feedback control as a theory of motor coordination. Nat Neurosci 5:1226 –1235. Wessberg J, Nicolelis MAL (2004) Optimizing a linear algorithm for realtime robotic control using chronic cortical ensemble recordings in monkeys. J Cogn Neurosci 16:1022–1035. Wessberg J, Stambaugh CR, Kralik JD, Beck PD, Laubach M, Chapin JK, Kim J, Biggs SJ, Srinivasan MA, Nicolelis MA (2000) Real-time prediction of hand trajectory by ensembles of cortical neurons in primates. Nature 408:361–365. Wise SP, Boussaoud D, Johnson PB, Caminiti R (1997) Premotor and parietal cortex: corticocortical connectivity and combinatorial computations. Annu Rev Neurosci 20:25– 42. Wise SP, Moody SL, Blomstrom KJ, Mitz AR (1998) Changes in motor cortical activity during visuomotor adaptation. Exp Brain Res 121:285–299.