Cost sensitive adaptive random subspace ensemble for computer-aided nodule detection Peng Cao1,2*, Dazhe Zhao 1, Osmar Zaiane2 1
Key Laboratory of Medical Image Computing of Ministry of Education, Northeastern University, China 2 University of Alberta, Edmonton, Alberta, Canada
[email protected];
[email protected];
[email protected]
Abstract Many lung nodule computer-aided detection methods have been proposed to help radiologists in their decision making. Because high sensitivity is essential in the candidate identification stage, there are countless false positives produced by the initial suspect nodule generation process, giving more work to radiologists. The difficulty of false positive reduction lies in the variation of the appearances of the potential nodules, and the imbalance distribution between the amount of nodule and non-nodule candidates in the dataset. To solve these challenges, we extend the random subspace method to a novel Cost Sensitive Adaptive Random Subspace ensemble (CSARS), so as to increase the diversity among the components and overcome imbalanced data classification. Experimental results show the effectiveness of the proposed method in terms of G-mean and AUC in comparison with commonly used methods.
1. Introduction Lung cancer is one of the main public health issues in developed countries [1], and early detection of pulmonary nodules is an important clinical indication for early-stage lung cancer diagnosis. Computer aided detection (CAD) can provide initial nodule detection which may help expert radiologists in their decision making. A CAD scheme for nodule detection in CT (Computed Tomography) images can be broadly divided into a nodule identification step and a false-positive reduction step. For finding the suspicious nodules, the initial detection of the CAD requires high sensitivity, and so, it produces a number of false positives. Since the radiologists must examine each identified object, it is highly desirable to reduce false positives while retaining the true positives [2]. The purpose of false-positive reduction is to remove these false positives (FPs) as much as possible while retaining a relatively high sensitivity. It is a
binary classification between the nodule class (positive class) and non-nodule class (negative class). The falsepositive reduction step, or classification step, is a critical part in the Lung nodule detection system [3-5]. There are two significant problems in the classification of the potential nodules: one is the enormous variances in the volumes, shapes, appearances of the suspicious nodule objects and one single classifier cannot model the complex data; the other is that the two classes are skewed and have extremely unequal misclassification costs, which is a typical class imbalance problem [6-7]. The imbalanced data issue usually occurs in computer-aided detection systems since the “healthy” class is far better represented than the “diseased” [8]. Due to the nature of learning algorithms, class imbalance is often a major challenge as it hinders the ability of classifiers to learn the minority class. This is due to the fact that most classifiers assume an even distribution among classes and assume an equal misclassification cost, resulting in classifiers being overwhelmed by the majority class and ignoring the minority class examples. An important trend in research is the appearance of ensemble learners, which can improve the performance of automated lung nodule detection. However, the key factor for the success of ensemble classifier construction is the diversity between components. In addition, cost-sensitive learning (CSL) adapts the existing classifier learning model to bias toward the positive class, so as to solve the skewed class distribution and misclassification cost problem. Therefore, we propose a cost sensitive adaptive random subspace ensemble algorithm for learning imbalanced potential nodule data. The novel ensemble can guarantee the diversity and complementary of each component; and this principle can determine the amount of non-redundant components in the ensemble classifier adaptively. In addition, the cost sensitive strategy can improve the recognition of the nodule class with threshold selection for maximizing the imbalanced data evaluation. We empirically investigate and compare the proposed method with the state-of-
the-art approaches in the class imbalance classification. Experimental results show the unique feature of our algorithm for overcoming the challenges and demonstrate a promising effectiveness.
2. Method Proposed 2.1. Random subspace (RS) method Ensembles are often capable of greater predictive performance than any of their individual classifiers. Ho showed that the random subspace method was able to improve the generalization error [9]. In the random subspace method, repeatedly for an ensemble of given size, an individual classifier is built by randomly projecting the original data into a subspace. and training a proper base learner on this subspace The various classifiers in the ensemble capture possible patterns that are informative on the classification. In the imbalanced suspicious nodule classification problem, we choose the random subspace method based on the fact that: (1) Before discriminating the nodules and non-nodules, many features are extracted in order to describe nodule objects sufficiently. By constructing classifiers in random subspaces one may solve the high dimensional problem. (2) Varying the feature subsets gives an opportunity to control the diversity of feature sets provided to each classifier in the ensemble and therefore ultimately combines classifiers with different characteristics and achieves improved accuracy; (3) Furthermore, random subspaces can avoid the strong bias of noisy features. The algorithm is described in Algorithm 1. Algorithm 1 Random Subspace Method (RS) Input: Training set TrainingSet, Test set TestSet, Ensemble size B, Ratio of feature subspace Rf Training: for k=1,2,...,B 1. Select an random subspace Dk from the original feature set of dataset TrainingSet with Rf 2. Construct a classifier Ck in D k 3. Ensemble=Ensemble∪Ck for end Testing: 4. Predict the unknown instances by majority average voting with Ensemble on the TestSet
2.2. Cost-sensitive adaptive random subspace Under the current standard RS scheme, there are three disadvantages requiring improvement: 1) It assumes a relatively balanced class distribution and equal misclassification costs, resulting in low accuracy of the positive class; 2) it only picks the feature subset
for the original feature set randomly without considering the diversity of instances; 3) it has random characteristics through the selection of feature subsets, but it is very possible that there are overlaps of the features used in constructing individual classifiers on different subspaces, since there is no formulation to guarantee small or reduced overlap. Therefore, we propose an improvement of RS, called CSARS (Cost Sensitive Adaptive Random subspace) for addressing the three disadvantages. CSARS made three improvements: 1) we employ cost-sensitive learning in each subspace to discriminate the imbalanced potential nodule data with adjusting decision threshold; 2) in order to obtain more diversity in each classifier, we extend the common random subspace method by integrating bootstrapping samples; 3) we use a formulation to make sure to maximize diversity in each sub-dataset. The cost-sensitive learning technique takes misclassification costs into account during the model construction, and does not modify the imbalanced data distribution directly. Given a certain cost matrix, a cost sensitive-learning will classify an instance x into positive class if and only if: (1) P( | x)C () P( | x)C () where C(+) and C(-) are misclassification cost of positive and negative class. Therefore the theoretical threshold for making a decision on classifying instances into positive is obtained as: C ( ) 1 (2) p( | x) C ( )+C ()
1+Crf
where Crf is ratio of two cost value, Crf= C(+)/C(-). Thus the final decision criterion is only decided by the ratio misclassification cost Crf. In the normal classification without considering the cost, Crf is 1, that means both of the classes have the same weight. In the class imbalance scenario, we need to change the default decision threshold by adjusting the parameter of the Crf. The value of Crf plays a crucial role in the construction of cost-sensitive learning, but the value of Crf is unknown in many domains where it is in fact difficult to specify the precise cost ratio information. Therefore, to achieve the best performance on the imbalanced data, we can adjust Crf using a heuristic search strategy guided by an evaluation measure.. Adjusting the decision threshold can move the output threshold towards the inexpensive class such that instances with high costs become harder to be misclassified [10]. In the procedure of searching for the best Crf, evaluation measures play a crucial role in both assessing the classification performance and guiding the modeling of the classifier. For imbalanced datasets, the average accuracy is not an appropriate
evaluation metric. We use G-mean as the fitness function to guild the search of Crf parameter. G-mean is the geometric mean of specificity and sensitivity, which is commonly used when performance of both classes is concerned and expected to be high simultaneously. It is defined as follows: G mean
TP TN TP FN TN FP
(3)
Since diversity is known to be an important factor affecting the generalization performance of ensemble methods, several means have been proposed to get varied base-classifiers inside an ensemble. In order to obtain more diversity in each classifier, we extend the common RS method by integrating bootstrapping samples. In the bootstrapping method, different training subsets are generated with uniform random selection with replacement. In addition, in the random subspace method, different features in each training subsets are randomly chosen for producing component classifiers. However, this cannot ensure the diversity of each subset since the instances and the features are chosen randomly without considering previously selected subspaces for other classifiers. Therefore, to improve diversity between each subset, we use a formulation to make sure each subset is diverse. Firstly, we introduce a concept of overlapping rate: subseti subset j (4) Overlapping rate N fea Nins where the subset is the sub-dataset within a certain subspace, Nfea and Nins are the feature size and instance size of each subset. In addition, we guarantee that the class ratio of each subset follows the one of the original training data distribution. We quantify data diversity between each subset with the data overlapping region, which measures the proportion of feature and instance subspace overlap between the training data of different classifiers in the ensemble. We then introduce a threshold Tover to control the intersection between each subset. The overlapping rate of all the subsets needs to be smaller than the threshold Tover. Therefore Tover is critical to the performance of the ensemble. If it is too large, the subsets lack diversity. If it is too low, the ensemble size is small, diminishing the advantage of ensemble classification. It is a trade-off between the diversity and the required ensemble size. Through quantifying data diversity between each subset for a component classifier with the data overlapping region which measures the proportion of feature and instance subspace overlap between the training data of different classifiers in the ensemble, we can guarantee the diversity of subsets provided to each
classifier, and at the same time provide a way to adaptively determine in an iterative way the number of classifiers in the ensemble. The GenerateDiverseSets algorithm can be described as in Algorithm 2. Algorithm 2 GenerateDiverseSets Input: Training set TrainingSet, Ratio of bootstrap samples Rs, Ratio of feature subspace Rf , Overlapping region threshold Tover, Stagnation rate sr=100 1. change=0; DiverseSets={}; while changeadd(Dsk ); change=0; 5. else change=change+1; end if end while Output: DiverseSets
The function isDiverse (Dsk, DiverseSet, Tover) examines if the new projection Dsk is diverse enough from the previously collected projections in DiverseSet based on the overlapping threshold Tover. The generation of projections stops when there is stagnation – i.e. after enough trials, no new projection is diverse enough from the collected subspaces. The number of projections is determined dynamically. Algorithm 3 CSARS Input: Training set TrainingSet, Test set TestSet, Ratio of bootstrap samples Rs, Ratio of feature subspace Rf,Overlapping region threshold Tover, Training phase: 1. DiverseSets = GenerateDiverseSets (TrainingSet, Rs, Rf, Tover ); for each subset Dk in DiverseSets 2. Construct a classifier model Lk in Dk 3. Select a decision threshold p* for maximizing the Gmean on the OOB( Dk), bestGM, according to adjusting the ratio misclassification cost. 4. Lk->Subspace= subspace(Dk ); Lk-> Threshold = p* 5. Ensemble=Ensemble∪Lk; end for Testing phase: 6. Calculate output from each classifier Lk of Ensemble with its p* in its Subspace on the TestSet 7. Generate the final output by aggregating all the outputs
After obtaining the DiverseSets, each costsensitive classifier is constructed on individual subset under different subspaces then ultimately we combine classifiers with different characteristics and achieve improved performance. Algorithm 3 illustrates the CSARS algorithm. Rather than considering the global
distribution in the whole dataset, we adjust and determine the decision threshold diversely in the individual subset under different subspaces. We attempt to make use of the difference of individual classifiers for the performance improvement by adjusting the learning focus on the minority class differently during training (i.e. diverse decision threshold). Since the imbalance ratio is different in each sub dataset, the appropriate cost ratio is different for each classifier.
from the center to the surrounding. Table 1 describes the features extracted from the candidate nodule VOI for classification.
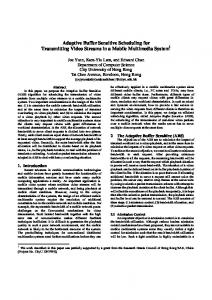
3. Experimental study 3.1. Potential Nodule Detection Our database consists of 98 thin section CT scans with 106 solid nodules, obtained from Guangzhou hospital in China. These databases include nodules of different sizes (3-30mm). The nodule locations of these scans are marked by expert radiologists. For obtaining the candidate nodules, we employ the 3D hessian filter to detect the candidate nodule VOI (Volume of Interest) [11] and use a 3D region growing method to obtain the core region [12]. Fig. 1 shows an example result image of candidate VOI detection. We obtained 95 true nodules as positive class and 592 nonnodules as negative class from the total CT scans.
3.2. Feature extraction In order to more accurately identify true or false positive nodules, we calculated multiple types of features for each nodule candidate: intensity, shape and gradient. These extracted features are based on the characteristics of nodules: 1) the nodules often have higher gray values than parts of vessels misidentified as nodules; 2) an isolated nodule or a nodule attached to a blood vessel is generally either depicted as a sphere or has some spherical elements; 3) the true nodules have a high concentration because they grow # 1-7 8-12
Feature Type Intensity distribution
13-19 Shape 20-26 27-29 30-36 Gradient distribution 37-43
Fig. 1 Potential nodule initial detection. TP indicated by arrow, other circled spots are FP
3.3. Potential nodules classification 3.3.1 Experiment I: Evaluating the effectiveness of CSARS algorithm In this experiment, we evaluate the effectiveness of our proposed CSARS algorithm. Since the ARS ensemble uses the idea of RS and Bagging, we conduct the comparison between CSARS, original RS (CSRS), Bagging (CSB) as well as the single methods with cost sensitive learning. In CSRS and CSB, each training set is separated randomly into training subset (70%) for training cost sensitive classifier and validation subset (30%) for adjusting decision threshold. The Neural network classifier is commonly used to discriminate nodules against background patterns. In our work, a standard three-layered feed-forward neural network is employed as the base learner. In the setting of the neural network classifier, the number of input neurons is equal to the number of features in a given subspace, and the number of neurons in the hidden layer is set to be 15. The G-mean is chosen as the evaluation metric. In all our experiments, we used 10-fold cross validation to train and validate our methods.
Table 1. Feature set for potential nodule classification Feature Description Intensity statistical feature The gray value within the objects was characterized by use of seven statistics (mean, variance, max, min, skew, kurt, entropy). Radial volume distribution feature [13] The average intensity within each sub-volume along the radial directions SI statistical feature [12, 14] The volumetric shape index (SI) representing the local shape feature at each voxel was characterized by use of seven statistics. CV statistical feature[12, 14] The volumetric curvedness (CV), which quantifies how highly curved a surface is, was characterized by use of seven statistics. Volume, surface area and compactness Some explicit shape features of VOI Gradient concentration statistical feature The concentration characterizing the degree of convergence of [15] the gradient vectors at each voxel, was characterized by use of seven statistics Gradient strength statistical feature The gradient strength of the gradient vectors at each voxel, was characterized by use of seven statistics
The ensemble size of RS and Bagging are set to 50. In the construction of CSARS, we enforce the independence of each subset by minimizing the overlapping region among the subsets for each classifier in the ensemble. This approach allows us to determine the ensemble size adaptively with a certain overlapping region threshold. Since the original RS and Bagging have a limit on the ensemble size, to have a fair comparison, we set the maximum of the ensemble size of CSARS to the same limit, typically fixed at 50. To that end, we selected the first 50 from the Diversets in the algorithm if the limit is exceeded. In the CSARS, the ratio parameters are under the default condition where the ratio of bootstrap sampling Rs is 0.7 and the ratio of features Rf is 0.5. Here we vary the value of Tover to exploit the relationship between Tover and the classification performance. We adjusted different values for the overlapping threshold parameter Tover. The range of Tover is [0.2, 0.5], the step is 0.02. With each Tover, we conduct a 10-fold cross validation and obtain an average G-mean result.
is repeated 10 times. The output is a Tover which obtains the best G-mean value among all tests. After obtaining the optimal Tover for CSARS, we compare the CSARS with optimal Tover parameter, with the original RS, Bagging, as well as the single solution on the test dataset. For CSARS, the section of the 10 fold cross validation is totally independent from the one of cross validation for obtaining the optimal Tover. All the results are shown in Table 2. We also evaluate the four comparative methods based on the basic classifier without injecting cost. To make our comparisons more convincing, we further use the AUC (Area Under the ROC curve) as the performance evaluation which is a commonly used measurement in medical CAD systems. Table 2. The comparison results of the different ensemble methods with or without CSL Method Sen. Spec. G-mean Size AUC Single RS Bagging
0.89 0.87
ARS
G‐mean
0.85 CSL 0.83
basic CSL basic CSL basic CSL basic CSL
0.635 0.787 0.657 0.807 0.634 0.795 0.690 0.831
0.887 0.846 0.918 0.896 0.929 0.884 0.925 0.920
0.750 0.816 0.777 0.850 0.757 0.838 0.799 0.874
1 1 50 50 50 50 37 37
0.792 0.833 0.826 0.864 0.811 0.843 0.825 0.893
CSRS
0.81
CSB
0.79
CSARS
0.77
Tover
0.75 0.2
0.3
0.4
0.5
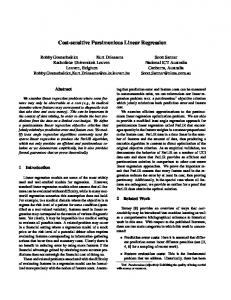
Fig. 2 The performance of CSARS while tuning Tover in terms of G-mean
From Figure 2, we can see that the result of Gmean changes as we vary the value of Tover in CSARS, and CSARS can outperform single cost-sensitive neural network and other traditional ensemble methods when Tover gets to certain value with or without costsensitive learning. CSARS obtains the best G-mean 0.883 when Tover is at 0.38. Thus, what should the value of Tover be? Clearly, this value should not be constant, because in an ensemble it determines the diversity and number of components, so as to affect the final performance directly. Therefore, we have to estimate the optimal parameter for obtaining the best performance on each dataset. In order to estimate the optimal parameter Tover for obtaining the best performance, the best overlapping rate threshold Tover is chosen by cross validation in the dataset. In imbalanced data case, available data instances, mainly instances of the minority classes, are insufficient for traditional cross validation in the training set. For this reason, we randomly divided the original data set into two sets: the training set (80%) and the validation set (20%) for measuring the performance of each Tover. This process
The results show that the ARS framework outperforms other ensemble framework in terms of Gmean and AUC. Moreover, the threshold adjustment with the guidance of G-mean can improve the performance of a neural network classifier on the imbalanced nodule data. Table 2 also shows the ensemble size obtained by CSARS; we can see that the size is indeed significantly smaller than the fixed size of 50 for the other ensemble method. The empirical studies have shown that CSARS can improve the generalization performance of ensembles with fewer components, that is, the diverse subset construction and cost sensitive learning strategy can achieve better performance than the complete ensemble on the imbalanced data. 3.3.2 Experiment II: Comparison between CSARS and state of the art methods In this experiment, we empirically compare CSARS against the state-of-the art methods for imbalanced data learning, such as AdaCost [16], Tomek Link [17], SMOTE [18] and SMOTEBoost [19]. AdaCost is a general cost sensitive learning integrating ensemble approach, in which the cost factor C is set to three according to [16]. Tomek Link is an under-sampling method; only examples belonging to the majority class are eliminated. All the sizes of ensemble methods are set to 50. We do not use the non-heuristic random re-sampling in our
comparison since they have potential drawbacks such as information loss or causing overfitting [19]. For all re-sampling methods, the minority class was oversampled until both classes obtain balanced distribution. From Table 3, we find that CSARS obtained the best performance amongst all the methods. The comparable results demonstrate that CSARS outperforms the re-sampling techniques. Tomek Link is the worst method since it is hard to identify the noise when the distribution is complex and imbalanced. Some useful border points may also be removed as noise, resulting in loss of information. SMOTE and SMOTEBoost help in broadening the decision region of the positive class blindly without regard to the distribution of the majority class. This leads to over-generalization so as to inevitably decrease the accuracy of the majority class. For the general cost sensitive learning method, AdaCost obtains an unexpected performance. It may be because the parameter of cost is not appropriate, resulting in obtaining an unexpected performance. It reveals again that the misclassification cost is vital for cost sensitive learning, and needs to be searched by some heuristic methods. Table 3. The comparison between our method with other approaches for imbalanced data learning Method AdaCost SMOTE SMOTEBoost Tomek link CSARS
Sen. 0.791 0.813 0.821 0.623 0.811
Spec. 0.872 0.845 0.849 0.893 0.920
G-mean 0.831 0.829 0.835 0.746 0.864
AUC 0.851 0.856 0.863 0.817 0.878
4. Conclusion The false positive reduction is a class imbalance task in the Lung nodule detection. In this paper, we have proposed a cost sensitive adaptive random subspace ensemble for imbalanced data learning. CSARS is a good framework for imbalanced data learning as it provides varied and complementary base classifiers by explicitly encouraging the diversity of subsets used by each classifier and adjusting the decision threshold. Through theoretical justifications and empirical studies, we demonstrated the effectiveness of the method on the performance of reducing false positives. The proposed method could be applied on the many other potential lesion detection problems, such as mass and polyp. Furthermore, it can also be applied to other imbalanced data learning problems such as fraud detection or text classification.
5. References [1] R.T. Greenlee, T. Murray, S. Bolden, P.A. Wingo, Cancer statistics, 2000. CA: a cancer journal for clinicians, 50(1), 7-33, 2008. [2] Q. Li. Recent progress in computer-aided diagnosis of lung nodules on thin-section CT,” Computerized Medical Imaging and Graphics, 31(4-5), pp. 248-257, 2007. [3] L. Boroczky, L.Z. Zhao, K.P. Lee. Feature Subset Selection for Improving the Performance of False Positive Reduction In Lung Nodule CAD. IEEE Transactions On Information Technology In Biomedicine, 10(3), 2006. [4] K. Suzuki, S.G. Armato, F. Li, S. Sone, K. Doi. Massive training artificial neural network for reduction of false positives in computerized detection of lung nodules in low-dose computed tomography. Med. Phy., 30, pp. 1602–1617, 2003. [5] P. Campadelli, E. Casiraghi, G. Valentini. Support vector machines for candidate nodules classification. Neurocomputing 68, pp. 281–289, 2005. [6] H. He, E.A. Garcia. Learning from imbalanced data. IEEE Transactions on Knowledge and Data Engineering, 21(9):12631284, 2009. [7] N.V. Chawla, N. Japkowicz, A. Kolcz. Editorial: special issue on learning from imbalanced data sets. SIGKDD Explorations Special Issue on Learning from Imbalanced Datasets, 6 (1):1-6, 2004. [8] Mazurowski et al. Training neural network classifiers for medical decision making: The effects of imbalanced datasets on classification performance. Neural networks: the official journal of the International Neural Network Society, 21(2-3), 427, 2008. [9] T. Ho. The random subspace method for constructing decision forests. Pattern Analysis and Machine Intelligence 20 (8): 832–844, 1998. [10] V. S. Sheng, C. X. Ling. Thresholding for making classifiers cost-sensitive. In Proceedings of the National Conference on Artificial Intelligence, 21(1):476-481, 2006. [11] Q. Li. Selective enhancement filters for nodules, vessels, and airway walls in two- and three-dimensional CT scans. Med. Phys., 30(8): 2040-2051, 2003. [12] Q. Li, F. Li, K. Doi. Computerized detection of lung nodules in thin-section CT images by use of selective enhancement filters and an automated rule-based classifier. Academic Radiology, 15(2): 165–175, 2008. [13] X. Lu, G. Wei, J. Qian, A.K. Jain. Learning-based pulmonary nodule detection from multislice CT data. In International Congress Series, 1268: 1356-1356, 2004. [14] H. Yoshida, J. Nappi. Three-dimensional computer-aided diagnosis scheme for detection of colonic polyps. IEEE Transactions on Medical Imaging, 20(12):1261-1274, 2001. [15] H. Kobatake, M. Murakami. Adaptive filter to detect rounded convex regions: Iris filter. in Proc. Int. Conf. Pattern Recognition, vol. II, pp. 340–344, 1996. [16] W. Fan, S.J. Stolfo, J. Zhang, P.K. Chan. AdaCost: Misclassification Cost-Sensitive Boosting. Proc. Of Int’l Conf. Machine Learning, pp. 97-105, 1999. [17] I. Tomek. Two modifications of cnn. IEEE Transactions on Systems, Man and Cybernetics, 6(11):pp.769-772, 1976. [18] N.V. Chawla, K.W. Bowyer, L.O. Hall, W.P. Kegelmeyer. SMOTE: Synthetic minority over-sampling technique. Journal of Artificial Intelligence Research, pp. 341–378, 2002. [19] N.V. Chawla, A. Lazarevic, L. Hall, K. Bowyer. SMOTEBoost: Improving prediction of the minority class in boosting. Proc. of 7th European Conf. Principles and Practice of Knowledge Discovery in Databases, pp. 107-119, 2003.