IEEE TRANSACTIONS ON NUCLEAR SCIENCE, VOL. 54, NO. 2, APRIL 2007
383
Counting and Integrating Readout for Direct Conversion X-ray Imaging: Concept, Realization and First Prototype Measurements Edgar Kraft, Peter Fischer, Michael Karagounis, Manuel Koch, Hans Krueger, Ivan Peric, Norbert Wermes, Christoph Herrmann, Augusto Nascetti, Michael Overdick, and Walter Ruetten
Abstract—A novel signal processing concept for X-ray imaging with directly converting pixelated semiconductor sensors is presented. The novelty of this approach compared to existing concepts is the combination of charge integration and photon counting in every single pixel. Simultaneous operation of both signal processing chains extends the dynamic range beyond the limits of the individual schemes and allows determination of the mean photon energy. Medical applications such as X-ray computed tomography can benefit from this additional spectral information through improved contrast and the ability to determine the hardening of the tube spectrum due to attenuation by the scanned object. A prototype chip in 0.35-micrometer technology has been successfully tested. The pixel electronics are designed using a low-swing differential current mode logic. Key element is a configurable feedback circuit for the charge sensitive amplifier which provides continuous reset, leakage current compensation and replicates the input signal for the integrator. This paper will discuss measurement results of the prototype structures and give details on the circuit design. Index Terms—Direct conversion, semiconductor sensors, single photon counting, X-ray imaging.
I. INTRODUCTION HIS paper discusses first results of a project focusing on the exploration and realization of a new signal processing concept for semiconductor X-ray sensors such as CdZnTe for the use in computed tomography and medical imaging in general. This research activity is pursued jointly by Bonn University and the Philips Research Laboratories Aachen. The signal of direct conversion pixelated semiconductor sensors is often processed using one of two distinct schemes: photon counting or integration of the signal current.
T
Manuscript received July 7, 2006; revised October 25, 2006. This work was presented at the IEEE Nuclear Science Symposium and Medical Imaging Conference (J1-03), October 2005, Puerto Rico. E. Kraft, M. Karagounis, M. Koch, H. Krueger, and N. Wermes are with the Institute of Physics, Bonn University, D-53115 Bonn, Germany (e-mail:
[email protected];
[email protected]; koch@physik. uni-bonn.de;
[email protected];
[email protected]). P. Fischer and I. Peric were with the Institute of Physics, Bonn University, D-53115 Bonn, Germany. They are now with the Institute of Computer Engineering, Mannheim University, D-68131 Mannheim, Germany (e-mail: pfischer @rumms.uni-mannheim.de;
[email protected]). C. Herrmann, M. Overdick, and W. Ruetten are with Philips Research Laboratories Aachen, D-52066 Aachen, Germany (e-mail: christoph.herrmann@ philips.com;
[email protected];
[email protected]). A. Nascetti was with Philips Research Laboratories Aachen, D-52066 Aachen, Germany. He is now with the Department of Electronic Engineering, University of Rome La Sapienza, 00184 Rome, Italy (e-mail: nascetti@ mail.die.uniroma1.it). Digital Object Identifier 10.1109/TNS.2007.891571
Counting schemes measure the number of absorbed photons whose deposited energy exceeds a certain threshold [1], [2], [3]. The lowest measurable flux is therefore a single photon per measurement interval. With rising photon flux, it becomes increasingly difficult to distinguish individual charge pulses and the number of unregistered events increases up to the point where no counts are registered at all. Another shortcoming is that, unless multiple energy thresholds are used, measurements of the photon count rate do not yield any spectral information besides the minimal energy determined by the threshold. Schemes measuring the integrated signal current, on the other hand, give information on the total deposited energy [4]. The designs are well suited for large rates and signal currents, but measuring small signals can be difficult due to electronic noise. Furthermore, the integrating technique does not yield spectral information either. The concept proposed here overcomes the limitations of the individual schemes with a design that allows simultaneous measurement of absorbed photon flux and deposited energy. This combination does not only extend the dynamic range beyond the limits of the respective concepts, it also yields additional spectral information in terms of mean photon energy in the region where both operating ranges overlap. Medical X-ray imaging applications can benefit from this concept through larger dynamic range, improved contrast and the ability to determine the hardening of the tube spectrum due to attenuation in the imaged object. II. PIXEL STRUCTURE A pixel providing counting and integrating x-ray imaging (CIX) contains three basic elements: a photon counter, an integrator and a special feedback circuit which provides both signal shaping for the photon counter and signal replication for the integrator [5]. Fig. 1 shows a schematic view of this structure. A. The Photon Counter The signal processing chain of the photon counting channel consists of a charge sensitive amplifier (preamplifier), a comparator with differential output and a 12-bit ripple counter. Incoming charge accumulates on the feedback capacitor until it is removed by the feedback circuit, which is basically a differential pair acting as a voltage controlled current source. This continuous reset of the amplifier is implemented using MOS transistors operating in saturation region. The feedback current delivered to the counting amplifier is also mirrored and drained from the integrator input, thereby duplicating the original signal charge.
0018-9499/$25.00 © 2007 IEEE
384
IEEE TRANSACTIONS ON NUCLEAR SCIENCE, VOL. 54, NO. 2, APRIL 2007
The largest measurable current causes a pump action on every -fold mulclock cycle. It is therefore approximately the being the number of tiple of the minimal current, with clock cycles within the measurement interval:
(3) Note that the discretization accuracy is determined by , as well. At a clock rate of 8 MHz and a measurement duration of 320 s, the discretization accuracy computes to : (4) In this example, the dynamic range extends over approximately decades. The absolute values of and are determined by the choice of the packet size . C. The Feedback Circuit
Fig. 1. Schematic structure of a pixel cell allowing simultaneous counting of individual photons and integration of the total signal current.
B. The Integrator The integrator implementation is similar to the sigma-delta converter concept which is often used in high precision, low frequency measurement applications [6]. More details can be found in [7]. The first stage of the integrator signal processing chain is an amplifier-comparator stage similar to the one found in the single photon counter. One difference is the clock-synchronized operation of the feedback circuit, which uses a charge each pump that delivers a charge packet of defined size time the accumulated charge on the feedback capacitor exceeds a given threshold. This type of feedback converts the incoming current to a frequency of pump actions. Two counters record and the elapsed time , the number of charge packets between the first and the namely the number of clock cycles last pump action in the measurement cycle. The current meais then given by: surement (1) Here, is the integrator clock frequency. A convenient property of this method of current measurement is that the discretization error decreases as the input signal gets smaller which leads to a nearly constant relative resolution throughout the full dynamic range. Common analog to digital converters with a constant bin size do not possess this property due to the inherently large relative discretization errors at small values. The dynamic range of the integrator is determined by the charge packet size, . The the clock frequency and the measurement duration smallest signal measurable corresponds to a current producing a single charge packet within the measurement interval. (2)
Fig. 2 shows a simplified diagram of the feedback circuit. Its main purposes are signal shaping for the photon counter, signal replication for the integrator and leakage current compensation. The key elements of the feedback circuit are the differential pairs. In every pair, the two current drains in the bottom of each branch sink precisely half the current entering from the current source on top. If the gate potentials of both pmos transistors match, the pair is balanced and no current will flow into or out of the nodes between the transistors and the current drains. A mismatch between the gate voltages, however, shifts the current from one branch into the other, causing some additional current in one branch and missing current in the other. This additional/missing current must leave/enter the branch through the node above the respective current drain. 1) Feedback and Signal Duplication: The operation of the feedback circuit can be understood by following the chain of events caused by a negative charge pulse arriving at the input node (IN) from the sensor. Let us assume that all differential pairs are balanced in the beginning. The output voltage (Out) and there is no current entering or leaving equals through the nodes above the current drains. Since the input node is connected to the inverting input of the amplifier, the output so that the input voltage revoltage will increase by mains constant (equal to ) and the charge pulse is stored . This voltage increase is seen on the feedback capacitor on the left branch of the first differential pair and shifts some feedback current from the left branch into the right. The additional current in the right branch flows into the input node, thereby canceling the original charge pulse. During the cancelation process, the output voltage of the amplifier decreases until . At that point, the first differential pair is it reaches balanced again and no further current flows into the input node. This is how the first differential pair provides the feedback (continuous reset) for the photon counting amplifier. Note that the imbalance in the differential pair causes not only a current flowing out of the right branch into the amplifier input node, but also an identical current entering the left branch from node 1. The integral over both current pulses is identical in size (matching the original input pulse), but of opposite sign. Hence, if the integrator is connected to node 1 (switch C closed,
KRAFT et al.: COUNTING AND INTEGRATING READOUT FOR DIRECT CONVERSION X-RAY IMAGING
385
Fig. 2. Simplified schematic of the feedback circuit. Three differential pairs with different bias currents provide feedback and leakage current compensation. Differential pair 1 delivers fast, but weak feedback for the preamplifier. Pair 2 is used for leakage current compensation. It is biased with a significantly larger current, but responds with a longer timer constant than pair 1. Pair 3 is used for the offset correction in case of continuous leakage compensation The four switches A, B, C and D allow different feedback types.
Fig. 3. Timing diagram illustrating the feedback modes and their response to the sensor signals. Graphs denote the sensor signal (top), the imbalance in the differential pairs of the feedback circuit (middle) and the signal seen by the integrator. The letters below the mode names indicate the switch settings (black: closed, gray: open.). After the sampling phase, the currents delivered by the 2nd and 3rd differential pairs match the leakage. Note the additional delay of the duplicated signal in the continuous leakage compensation mode. A sampling phase is normally followed by either static or continuous leakage compensation. The sequence above serves illustration purposes only.
switches A and D open), it receives a charge pulse of equal size and sign as the input pulse (Fig. 3, center). This is how the first differential pair provides signal duplication. Between the input nodes of preamplifier and integrator, there is also a diode connected nmos transistor (bypass), seen in the bottom right of Fig. 2. This transistor becomes conductive if the potential on the input node drops more than a threshold voltage below the integrator input voltage (about 1.2 V) - a situation which can occur only if the feedback currents are not sufficient to compensate the sensor signal. Surplus current bypasses the feedback via the diode, allowing the integrator a proper measurement of the input signal. 2) Static Leakage Current Compensation: Biased semiconductor sensors usually exhibit some degree of leakage current
flowing into the input readout electronics even when no real signal is present. This current can cause shifts in the output voltage baseline of the amplifier and decrease the dynamic range. It is therefore desirable to compensate the leakage current prior to the signal processing. In our feedback design, this is done by the second differential pair. Note that the right output node of this pair is connected to the preamplifier input node. The current delivered to the input node corresponds to an imbalance in the second pair. The strength of this current is determined by the voltage on the sampling capacitor . When switch A is open, the voltage will remain constant, thereby freezing the current to the input node (which is the reason why this mode is called static leakage current compensation). During a sampling phase, this voltage is adjusted so that the current compensates the leakage current. 3) Sampling: The sampling of the feedback current is performed in the absence of real signals, when there is only leakage current flowing to the sensor (Fig. 3, left). Closing switches A and B and opening switches C and D disconnects the integrator , the from the feedback. Node 1 is now only connected to right gate of the second differential pair and left output node of the first differential pair. There can thus be no DC current flowing into or out of the first differential pair. This implies that the leakage current can only be compensated by the current from the right branch of the second differential pair (which is connected to the input node). The corresponding imbalance in the second pair also causes an equally sized current into its left branch from differential pair number 3. Through this mechand so that the anism, sampling adjusts the voltages on leakage current is matched by the currents leaving the right output nodes of both differential pairs. For illustration purposes, one can follow the chain of events triggered by a sudden increase in the sensor leakage current. At first, this increase would be compensated by the first differential pair, shifting current from the left branch to the right. This decreases the potential of node 1, increasing the voltage drop across the sampling capacitor , which is connected to the gate of the right branch of the second differential pair. As a result, the second pair delivers more current to the input node. The first pair reacts by delivering slightly less current. This slows down the voltage decrease in node 1 until it reaches a stable level. At that point, the first differential pair is balanced again and the
386
second pair has adjusted to the new leakage current by adjusting (node 1). A similar mechanism changes the the voltage on to suit the new voltage on the second sampling capacitor conditions. Once stable conditions are reached, the sampling switches A and B can be opened. This freezes the voltage on the sampling capacitors and consequently also the compensation current delivered to the input node. For stability reasons, is much smaller than and and the sampling capacitors are large compared to . The first differential pair reacts quickly but with limited current, while the other pairs reacts more slowly but can handle significantly larger currents. Closing either switch C or D connects the integrator to node 1 or 2 and establishes the measurement mode with static or continuous leakage current compensation, respectively. Note that there will be no current flow to the integrator unless a signal arrives at the input node. Since the leakage current is already compensated at the input node, there will also be no baseline shift in the amplifier output. 4) Continuous Leakage Current Compensation: This feedback mode differs from the previously discussed static leakage current compensation in that it adjusts the compensation current of the second differential pair continuously to the incoming DC current - regardless of whether it is actual leakage current or signal current. The motivation for continuous leakage current compensation lies in the behavior of the photon counter at very large signals: Large photon flux causes pile-up of subsequent events, leading to a quick breakdown of the count efficiency. Additionally, the effective threshold voltage shifts since even smaller pulses can cross the threshold while the previous pulse is not yet fully compensated. Continuous leakage current compensation allows operation of the photon counter at significantly higher fluxes at the expense of an baseline shift in the high signal regime. The basic idea is to use the second feedback pair to keep the preamplifier within operation limits at all times by removing the DC component of the input signal. Since the second feedback is slow, the effect of this is only noticeable at high pulse rates. Following a sampling phase, the voltage on is frozen by opening switch B and the integrator is connected to node 2 by closing switch D (switch A remains closed, switch C remains open). Note that there cannot be any DC current flowing from the first differential pair into node 1, since it is is only connected to capacitive loads. The first differential pair can thus provide fast (AC) feedback for the amplifier, but its net charge balance must be zero. Hence, any DC signal current entering the input node will in the end be compensated by the second differential pair (Fig. 3, right). After sampling of the leakage current, any additional current leaving the second differential pair on the right branch will also enter the left branch from node 2. Since switch B is now open, the third pair acts only like a constant current source, removing the previously sampled offset current. The additional current must therefore come from the integrator. Hence, the integrator will also receive the correct average signal current if connected to node 2. Due to the large time constant of the second differential pair, the integrator signal will be considerably low-pass filtered compared to the original input. This behavior is considered not to be an issue, since the integration interval is usually much longer than this time constant.
IEEE TRANSACTIONS ON NUCLEAR SCIENCE, VOL. 54, NO. 2, APRIL 2007
Fig. 4. Waveforms at output of the charge sensitive amplifier caused by input pulse streams of different frequencies (A: 2 MHz, B: 2.5 MHz, C: 3.3 MHz, D: 5 MHz). Static leakage current compensation does not exhibit a baseline shift. Pulse frequencies exceeding 5 MHz saturate the amplifier through pileup (not visible here).
Fig. 5. Waveforms at output of the charge sensitive amplifier caused by input pulse streams of different frequencies (A: 1 MHz, B: 2 MHz, C: 3.3 MHz, D: 5 MHz, E: 10 MHz). Continuous leakage current compensation allows fast counting (10 Mhz) but leads to a baseline.
5) Comparison of the Feedback Modi: The waveforms in Figs. 4 and 5 show the signal at the output of the charge sensitive amplifier, measured using an analog buffer situated in the chip. have Fast continuous streams of charge pulses been injected into the input of the amplifier using a fast switched current source. In Fig. 4, the feedback circuit was configured to provide static leakage compensation. The waveforms A, B, C and D correspond to series of charge pulses with periods of 500 ns, 400 ns, 300 ns and 200 ns, respectively. A bias current setting nA allows the first differential pair to deliver curof rents up to 25 nA. This limits the input pulse frequency to a maximum of about 5 MHz (waveform D). The advantage of the static leakage compensation is the absence of a shift in the baseline. Fig. 5 shows the result of a similar measurement using identical bias settings but the feedback configuration for continuous leakage compensation. Waveforms A, B, C, D and E correspond to streams of charge pulses with 1000 ns, 500 ns, 300
KRAFT et al.: COUNTING AND INTEGRATING READOUT FOR DIRECT CONVERSION X-RAY IMAGING
Fig. 6 Comparisonof feedback modes: Black: Measurements of the dynamic range of the single photon counter under static and dynamic leakage current compensation. Input signal was a sequence of equidistant 6.7 fC (42 000e ) pulses. Continuous leakage current compensation raises the upper frequency limit from 4.5 MHz to 10 MHz. Both modes behave quite similar at lower frequencies. The dent at 6 MHz is attributed to an interference between the integrator clock (which operates at 6 MHz) and the charge injection signal. Gray: modeled results for Poisson-distributed pulses based on the measured maximal frequencies (A/B: static/continuous leakage current compensation).
ns, 200 ns and 100 ns period, respectively. The maximal discriminable pulse frequency increased to about 10 MHz, which is also demonstrated by similar measurements in Fig. 6. This increase in maximal count rate is paid for by a baseline shift, visible in Fig. 5. Increasing input signal frequencies cause a higher DC current, which is compensated by the second differential pair. This leads to a decrease in the output level, lowering the baseline and thereby increasing the pulse height necessary to cross the threshold of the photon counter. As a result, the energy discrimination of the photon counter is no longer well defined. Summarizing it can be said that the higher count rates achievable with continuous leakage current compensation come at the price of a flux dependent baseline shift.
387
Fig. 7. Photon counter noise performance under variation of the capacitive load on the amplifier input node and the leakage compensation bias current I . The equivalent noise charge was measured using threshold scans with equidistant 2 fC charge pulses at 12.7 kHz pulse rate and a feedback current bias setting of 19 nA. The photon counter noise increases from 119 e by about 0.375 e per fF additional capacitive load and by 1.00 e for each nA of leakage compensation bias current.
main building blocks and allow investigation of the digital counters and the analog output of the counting amplifier. The analog signal can be measured using an analog buffer. Substrate noise coupling and digital-analog crosstalk during operation are minimized by using a low swing differential logic for the design of counters and digital circuits [8]. The trigger signals of the charge injection circuits however, are full swing single line CMOS signals - which makes them the suspected dominant source of digital-analog crosstalk. III. MEASUREMENTS The counting and integrating channels in each pixel were tested both separately and simultaneously. All measurements took place at room temperature in an environment without special electromagnetic shielding. A. Photon Counter
D. Implementation The prototype chip was fabricated in AMS 0.35 m technology. It contains seventeen counting and integrating pixels m m. Since this prototype with a pixel size of does not posses pads for the connection to an external sensor, the sensor properties have to be simulated by internal circuits. The input signal is produced in each pixel using switched capacitor (10 fF) and switched current source charge injection circuits, allowing the simulation of both variable photon energies and charge collection times. Up to five 100 fF capacitors can be connected to the input node of each pixel to mimic the capacitive load of a connected sensor electrode. Sensor leakage current of adjustable strength is simulated by a dedicated current source. The feedback capacitors of preamplifier and integrator fF and fF, respectively. have values of Two different charge pump concepts were implemented in the integrator: a switched current source and a switched capacitor . Two of the pixels are partitioned into their
1) Noise Performance: Fig. 7 shows an investigation of the photon counter noise performance with 2 fC charge pulses produced by the switched capacitor. Threshold scans show an electronic noise equivalent to approximately 119 . This value increases with the capacitive load on the amplifier input node by approximately 0.375 electrons per fF. Large leakage compen(Fig. 1) cause additional noise of about sation bias currents one electron per nA. The influence of increasing feedback bias is smaller, about 0.72 per nA. current 2) Minimal Pulse Size: The minimal comparator threshold voltage that does not produce accidental noise counts was determined by sweeping the comparator threshold voltage around the voltage at the positive input of the comparator . All counts recorded are attributed to noise, since no charge pulses were injected during the 320 s measurement interval. These measurements produce a count distribution resembling a Gaussian shape with a standard deviation of . The minimal safe threshold setting lies therefore
388
Fig. 8. Double pulse resolution: Minimal delay between two consecutive charge pulses allowing a reliable distinction of both. This delay depends on the comparator threshold voltage and the feedback current. The minimal delay (69 ns) for this pulse size was achieved using a threshold voltage of 4 900 e and a feedback current setting of 85 nA.
at about 500 . This value was also found to depend on the type and amount of digital activity on the chip. 3) Double Pulse Resolution, Maximal Count Rate: Investigation showed that the analog signal processing allows distinction of two typical photon signals (using optimized feedback and threshold settings) if the time difference of their occurrence exceeds approximately 100 ns. This was tested using a series of one thousand 2 fC double pulses with a tuneable delay between the two pulses. The 2 fC correspond to approximately 12 500 , i.e., the charge generated by 58 keV photons when absorbed in CdZnTe. The distinction was assumed to be reliable if double pulses) were counted successall 2 000 pulses ( fully. Fig. 8 shows the minimal delay under variation of the comparator threshold and the feedback current settings (prototype allows settings up to 85 nA). A continuous stream of equidistant 2 fC pulses is measured correctly up to a maximal rate of approximately 6 MHz using static leakage current compensation. This rate corresponds to an input current of about 12 nA (pulse charge frequency product). Higher rates can be achieved with continuous leakage current compensation. B. Integrator The integrator was investigated using direct charge injection. Both feedback circuit and photon counter were disconnected from the integrator input node. Two different types of charge injection were used for the measurements: • Continuous current injection with a current controlled by an external current source (Keithley 2400) via a current mirror with a translation factor of approx. 85:1 • Pulsed current injection with an on-chip current source which is gated by an external strobe signal. The strength of this current source can be controlled either externally or by an internal DAC on the prototype chip. 1) Linearity: Investigation of the integrator linearity with pulsed and continuous charge injection revealed no difference between measured and injected current within the achieved test accuracy.
IEEE TRANSACTIONS ON NUCLEAR SCIENCE, VOL. 54, NO. 2, APRIL 2007
Fig. 9. The integrator signal to noise ratio depends on input current, injection mechanism and operation parameters. Input currents were injected directly into the integrator, bypassing the feedback. Best results are achieved with a comparably large, capacitive charge pump. Two lines denote the discretization limits of the integrator and a 12-bit ADC with constant bin size.
2) Dynamic Range: The dynamic range of the integrator was found to be in good agreement with the theoretically expected value determined by measurement duration, integrator clock frequency and pump packet size. Measurements with 640 s duration and 6 MHz clock rate yield a dynamic range covering approximately 3.6 decades. Adjustment of the pump packet size allows lower current limits of
and upper current limits up to
Fig. 12 shows a typical operation range (with 33 fC pump packet size) which extends from 66 pA to 200 nA. 3) Noise Performance: Fig. 9 displays the ratio between signal and noise amplitudes of the integrator, which was found to vary between 4000 (72 dB) and 20 (26 dB), depending on the input current amplitude, type of charge pump and charge packet size. Since our prototype chip uses 12 bit counters, the discretization limit is approximately 1/4000 throughout the full dynamic range. The measurement showing the best performance (top) uses a capacitive charge pump with a packet . Larger charge size of packet sizes are slightly beneficial. This can be seen by comparing the remaining two measurements, which use a switched current source as a charge pump and packet sizes of 181 fC and 13 fC . Two lines illustrate the discretization limits of the integrator and a 12-bit ADC with constant bin size, respectively. In conclusion, the factors influencing the noise performance are: • charge pump type: Switched capacitor charge pumps behave better than switched current sources. • charge injection method: Continuous current injection causes less noise than pulsed charge injection. • pump packet size: Larger packet sizes are slightly beneficial.
KRAFT et al.: COUNTING AND INTEGRATING READOUT FOR DIRECT CONVERSION X-RAY IMAGING
Fig. 10. Impact of feedback on integrator noise: Identical input signals (4 fC pulses) were injected into the integrator once directly and in the other case indirectly via the feedback circuit. The latter is the normal mode of operation. Comparison of both measurements show that the integrator signal to noise ratio deteriorates significantly if the signal passes through the feedback circuit.
389
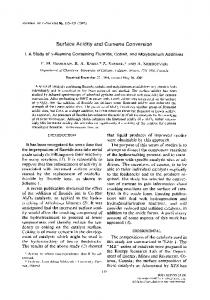
Fig. 11. The mean photon energy can be reconstructed by dividing the measured current by the number of photons. In this measurement, the input signal consisted of equally spaced pulses of 6.7 fC (42 000e ). black: static leakage current compensation, gray: continuous leakage current compensation.
C. Feedback and Simultaneous Operation All measurements discussed above investigated the performance of counting and integrating channel separately. This section discusses the impact of simultaneous operation. Results show that the feedback circuit successfully provides static and continuous leakage current compensation and allows parallel measurements on both channels. Yet, the measurements also revealed several issues that have still to be addressed: • The signal to noise ratio deteriorates significantly, especially in the low current regime (Fig. 10) • The feedback circuit produces a small offset current which decreases the measured signal. This effect is most noticeable at small signal currents as is visible in the slight underestimation of the measured current in Fig. 12 (gray data). The deterioration of the signal to noise ratio is a result of the noise generated by the transistors in the feedback circuit. This noise is signal independent, leading to a linear SNR vs. signal dependence as seen in Fig. 10. The offset current can be attributed to non-ideal offset compensation caused by finite drain-source resistances and by the charge injection into samand (Fig. 2). pling capacitors The overall performance in the overlap region between photon counter and integrator is best viewed by looking at the reconstruction of the mean photon charge deposit. This is computed by dividing the measured current by the recorded number of photons. Fig. 11 shows a measurement in which the input current was varied by changing the time interval . In between subsequent pulses of equal size order to illustrate the feedback behavior, this measurement was conducted two times, once with static and once with continuous leakage current compensation. The overlap region of the dynamic ranges of photon counter and integrator allows successful reconstruction of the original pulse size. It is limited by the minimal current measurable by the integrator and the maximal count rate which the photon counter can handle. The steep increase in the reconstructed pulse size at high input currents is caused by a rapid deterioration of the
Fig. 12. CIX dynamic range: Exemplary total dynamic range of the counting and integrating pixel. Shown is the response of the photon counter (gray) and integrator (light gray) to an input signal consisting of equidistant 2 fC pulses. The black measurement shows the potential behavior of the integrator, if it was not impaired by the present limitations of the feedback circuit (using a packet size of 33 fC and a constant current injected directly into the integrator).
count efficiency. This results in too few counted pulses and thus in too much charge attributed to each individual pulse. The decline in the gray measurement at around 50 nA is an effect of the feedback circuit, which limits the duplicated current and thereby causes an underestimation of the signal current. The diode bypass (Fig. 2) did not help in this measurement since the switched current source used for charge injection fails if the input node potential is too low. Note that the limitation of the smallest current in the measurement with continuous leakage compensation (gray) is imposed by an offset current of 710 pA diminishing the input signal. As discussed above, this offset current originates in the feedback circuit. Static leakage current compensation (black) exhibits a far smaller offset current, indicated only by the slight underestimation of the photon energy near the lower limit. Fig. 11 also illustrates the increasingly dominant integrator noise near the low current region. The three measurements in Fig. 12 demonstrate the total dynamic range of a photon counting and charge integrating
390
pixel and the limits currently imposed by the feedback circuit. The input current, consisting of equidistant 2 fC charge pulses , was injected into the preamplifier and measured both by photon counter and integrator. Starting from a single photon per frame (which corresponds to about 3 pA), the photon counter covers a range up to about 12 nA (gray). The integrator is able to measure the current in the range from approximately 50 pA up to 20 nA, at which point the current is clipped by the maximal feedback current (light gray). The potential dynamic range of the integrator, if it wasn’t impaired by the prototype’s implementation of the feedback circuit, is shown in the black measurement (using a slightly larger packet size of 33 fC and a continuous current source feeding directly into the integrator). Here, the integrator covers a range between 66 pA and 200 nA, giving a potential overlap region between 66 pA and 12 nA and extending the total dynamic range well beyond the limits of the photon counter. Unfortunately however, the present limitations of the feedback circuit, which is mandatory for simultaneous operation, prevent the demonstration of this feature. D. Power Consumption The power consumption of the prototype pixels depends largely on the desired clock speed. For typical settings such as those used in the measurements in Fig. 12, the power consumption amounts to 875 per pixel. ) are used by the digital About two thirds (61%, 536 circuits, comprising three 12-bit counters, one 12-bit latch, 48 bus drivers and the necessary control logic and registers. Note that both prototype design and operation parameters focussed rather on the reliable exploration of the signal processing concept than on power effectiveness. The measurements presented in [8] show that a power optimized 16-bit ripple counter of similar design can be operated up to 20 MHz at a power consump. It is therefore expected that the optimization of only 6.5 tion of the readout architecture and minimization of the digital bias currents will allow a significant reduction in power usage, as is necessary if this readout scheme is to be employed in a large scale pixelated imaging system. This also holds for the bias settings of the two stage comparators of integrator and photon
IEEE TRANSACTIONS ON NUCLEAR SCIENCE, VOL. 54, NO. 2, APRIL 2007
) of the total power. The counter, which use about 24% (212 ) remaining power is consumed by the amplifiers (13%, 113 of photon counter and integrator and the feedback circuit (2%, ). 14 IV. CONCLUSION A readout scheme for direct conversion X-ray imaging using simultaneous photon counting and integration was proposed. The two channels are combined into a single pixel using a special feedback circuit which also provides leakage current compensation. Investigation of a prototype chip demonstrated the feasibility of the concept and identified the properties. Simultaneous operation is fully functional, however exhibits limitations which may be addressed by a noise improved design. REFERENCES [1] P. Fischer, S. Krimmel, H. Krüger, M. Lindner, M. Löcker, K. Nakazawa, T. Takahashi, and N. Wermes, “Single photon counting X-ray imaging with Si and CdTe single chip pixel detectors and multichip pixel modules,” IEEE Trans. Nucl. Sci., vol. 51, no. 4, pp. 1717–1723, Aug. 2004. [2] M. Chmeissani, C. Frojdh, O. Gal, X. Llopart, J. Ludwig, M. Maiorino, E. Manach, G. Mettivier, M. C. Montesi, C. Ponchut, P. Russo, L. Tlustos, and A. Zwerger, “First experimental tests with a CdTe photon counting pixel detector hybridized with a medipix2 readout chip,” IEEE Trans. Nucl. Sci., vol. 51, no. 5, pp. 2379–2385, Oct. 2004. [3] F. Edling, N. Bingefors, R. Brenner, L. del Risco Norrlid, K. Fransson, L. Gustafsson, and C. Rönnqvist, “Performance of a chip for hybrid pixel detectors with two counters for X-ray imaging,” Nucl. Instrum. Methods Phys. Res. A, Accel. Spectrom. Detect. Assoc. Equip., vol. A531, no. 1–2, pp. 216–220, Sep. 2004. [4] S. O. Kasap and J. A. Rowlands, “Direct-conversion flat-panel X-ray image sensors for digital radiography,” in Proc. IEEE, Apr. 2002, vol. 90, no. 4, pp. 591–604. [5] I. Peric, “Design and Realisation of Integrated Circuits for the Readout of Pixel Sensors in High-Energy Physics and Biomedical Imaging,” Ph.D. dissertation, Bonn Univ., Bonn, Germany, Sep. 2004. [6] P. M. Aziz, H. V. Sorensen, J. Van, and D. Spiegel, “An overview of sigma-delta converters,” IEEE Signal Process. Mag., vol. 13, no. 1, pp. 61–84, Jan. 1996. [7] R. Luhta, M. Chappo, B. Harwood, R. Mattson, D. Salk, and C. Vrettos, “A new 2D-tiled detector for multislice CT,” in Proc. SPIE, Feb. 2006, vol. 6142, pp. 275–286, Medical Imaging. [8] P. Fischer and E. Kraft, “Low swing differential logic for mixed signal applications,” Nucl. Instrum. Methods Phys. Res. A, Accel. Spectrom. Detect. Assoc. Equip., vol. A518, no. 1–2, pp. 511–514, Feb. 2004.