from pick-up coil was detected using a lock-in amplifier. The surface profile of magnetic materials with a crack was obtained using a specially designed ...
Vol.
125
(2014)
No. 2
ACTA PHYSICA POLONICA A
Proceedings of the 3rd International Congress APMAS2013, April 24�28, 2013, Antalya, Turkey
Crack Detection Using Fluxgate Magnetic Field Sensor T. Izgi
a,∗
b
a
, M. Goktepe , N. Bayri , V.S. Kolat
a
a
and S. Atalay
Inonu University Science and Art Faculty, Physics Department, 44069 Malatya, Turkey Balikesir University, Faculty of Science and Literature, Department of Physics, 10145 Balikesir, Turkey a
b
In this study, the variation of the magnetic �ux distribution in a magnetised ferromagnetic material which has in homogeneity as a crack is studied. An orthogonal �uxgate magnetic �eld sensor was used in the inspection of cracks. In the �uxgate sensor, the sensing element (Co0.94 Fe0.06 )72.5 Si12.5 B15 amorphous ferromagnetic wire was placed inside a pickup coil winding with 50 µm copper wire and connected to a signal generator and the output from pick-up coil was detected using a lock-in ampli�er. The surface pro�le of magnetic materials with a crack was obtained using a specially designed 3-dimensional moving system. A large decrease in the output voltage of the sensor was observed when the sensor was moved on the top of the crack, after the further movement of the sensor the output voltage came back to the previous value. DOI: 10.12693/APhysPolA.125.211 PACS: 85.75.Ss, 46.50.+a, 75.50.Kj 1. Introduction
Non-destructive evaluation systems have been widely utilized for inspection of many materials used in safety and critical applications. Magnetic non-destructive testing methods such as the magnetic �ux leakage (MFL) method, eddy current testing, and the residual magnetic �eld technique are useful methods for the prevention of accidents due to break of mechanical parts in the machines, and also useful for the prolongation of the service life-time of a structure [1]. The magnetic �ux leakage (MFL) method is the most common and cost-e�ective nondestructive magnetic testing technique used in various nondestructive testing applications. This method is based on measuring the magnetic leakage �eld over the surface of a test specimen in the vicinity of small defects such as cracks [2]. In the measurement of MFL, we need to visualize the magnetic map of the surface with good precision and sensitivity. The most commonly used sensors for these applications are �uxgate sensor, the Hall e�ect sensor and induction coil sensor [3�5]. Related to recent advances in magnetic sensor technology, for the detection of very small changes in the MFL distribution, high resolution magnetic sensors such as SQUID [3], GMR [3], and GMI [6�8] have been introduced. The microstructural changes induced in a thermal or stressed environment and cracked region of industrial applications and moving machine parts are often degradation of the mechanical properties of steel. The �uxgate sensor can be used either to detect magnetic �elds created by current passing through conductors or to detect localised magnetic �elds non-destructive testing applications. The occurred discontinuity resulting from a crack also produces disturbance in the magnetic �eld in the material, and the magnitude of the disturbance is deter-
∗ corresponding
mined by the size and shape of the crack. The �uxgate magnetic �eld sensor with amorphous ferromagnetic core can be to capture cracked regions in the materials. 2. Experimental
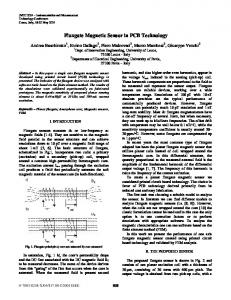
The basic con�guration of the �uxgate sensor is shown in Fig. 1a. The sensing element consists of the soft magnetic amorphous ferromagnetic (Co0.94 Fe0.06 )72.5 Si12.5 B15 core and pick-up coil. Amorphous wire was annealed at 460 ◦C for 90 min. The presented �uxgate sensor is orthogonal type. The magnetic wire is excited by an AC sine wave with 50 kHz frequency and wire was magnetically saturated in the circumferential direction. The magnetic �eld produced by AC sine wave should be large enough to saturate the core. The second harmonic of induced voltage in the pick-up coil was measured using a lock-in ampli�er. The sensor was placed in a shielded solenoid and external magnetic �eld
Fig. 1. The basic con�guration of (a) the �uxgate sensor and (b) experimental setup.
author
(211)
212
T. Izgi et al.
Fig. 2. Sensor output as a function of external magnetic �eld, (b) sensor output as a function of time.
applied along the sample length. The magnetic �eld was applied using a bipolar power supply�solenoid system. The variation of sample output voltage measured from lock-in as a function of external �eld is given in Fig. 2. The sensor shows a nearly linear change at ±50 A/m magnetic �eld regions. 2 nT magnetic �eld pulse was applied to sensor and the change in the output can be seen in Fig. 2b. It can be seen that the typical sensitivity of �uxgate sensor is better than 1 nT. 3. Results and discussion
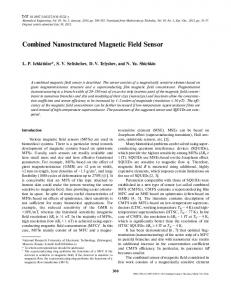
Figure 3 shows magnetic map of a small magnet with 1.5 × 1.5 mm2 size. Sensor was placed orthogonally to magnet and scanned with 0.1 mm steps. A large increase in the sensor output was observed on the top of magnet, Fig. 3b is the contour plot of Fig. 3a. An experimental setup has been used to capture cracks in a material as shown in Fig. 1b. C-core was used to magnetize the system. C-core was made from 3% Si�Fe laminations with 110 mm limb length with 1200 mm2 cross-sectional area of limbs and 220 mm distance between the limbs. N = 110 turn magnetisation coil was made on the C-core to get magnetisation in the core. Number of crystalline 3% Si�Fe lamination sheets have been used to simulate cracks in the material. Lamination sheets with 0.35 mm thickness, 30 mm width, and 150 mm length have been stacked on each other to simulate full and half cracks. 1.6 mm wide crack has been made in the middle of the sample and the crack was located along the sample of the cross-section as a full crack.
Fig. 3. Magnetic mapping of a small magnet.
2 mm wide and 1.6 mm deep crack is also prepared in the middle of the sample and called as a half crack as shown in Fig. 1b. C-core was magnetised by applying an dc current to the 100 turn magnetisation windings. Therefore, a dc magnetisation occurred in the core because of the reorientation of the magnetic domains along the �ux lines. During this progress variation of �ux density ( dB/ dt 6= 0) in time becomes greater than zero. Magnetic �ux lines follow closed magnetic circuit than jump to the sample from the C-core limbs and �ux �ows in the core up to meet a crack. The normal component of the �ux gets bigger around the cracked region. An amorphous wire has been used to capture normal component of magnetic �ux lines. The amplitude of the measured signal was changed when amorphous wire captured the normal component of the magnetic �ux on the surface of the magnetised sample and that means a crack or scratch is located around the wire. When a crack or a scratch somehow occurs on
Crack Detection Using Fluxgate Magnetic Field Sensor
the material, a discontinuity suddenly appears and normal component of magnetic �ux becomes greater than zero instead of a signal becoming big enough to occur in the amorphous wire. Therefore, a signal variation could be read from the lock-in ampli�er.
213
A large decrease in the output voltage of the sensor circuit was observed when the sensor was moved on the top of the crack, after the further movement of the sensor the output voltage came back to the nearly previous value (Fig. 4). If the magnetised materials have not got any crack, no signi�cant variation in the sensor output was measured, because all magnetic �ux lines pass through the material due to its higher permeability. 4. Conclusion
In conclusion, results have shown that there is a good correlation between the size and position of a crack and the sensor output. This method has great potential for application in the inspection of cracks in the surface or inside of magnetic materials. Acknowledgments
This work was supported by Inonu University Research Fund with the project number 2012/168. References
[1] J.G. Martin, J. Gomez-Gil, E.V. Sanchez, Sensors 11, 2525 (2011). [2] K. Tsukada, M. Yoshioka, T. Kiwa, Y. Hirano, NDT&E Int. 44, 101 (2011). [3] J.E. Lenz, Proc. IEEE 78, 973 (1990). [4] M. Butta, I. Sasada, J. Appl. Phys. 111, p07E517 (2012). [5] S. Atalay, N. Bayri, T. Izgi, F.E. Atalay, V.S. Kolat, Sens. Actuat. A, Phys. 158, 37 (2010). [6] M.M. Tehranchi, M. Ranjbaran, H. Eftekhari, Sens. Actuat. A, Phys. 170, 55 (2011). [7] G.V. Kurlyandskaya, D. de Cos, S.O. Volchkov, Russ. J. Nondestruct. Test. 45, 377 (2009). [8] M. Goktepe, Y. Ege, N. Bayri, S. Atalay, Phys. Status Solidi C 12, 3436 (2004).
Fig. 4. Variation of sensor signal around crack region.