Journal of Magnetics 17(4), 302-307 (2012)
ISSN (Print) 1226-1750 ISSN (Online) 2233-6656 http://dx.doi.org/10.4283/JMAG.2012.17.4.302
Magnetic Sensor-Based Detection of Picoliter Volumes of Magnetic Nanoparticle Droplets in a Microfluidic Chip Ilgyo Jeong#, Young-Jae Eu#, Kun Woo Kim, XingHao Hu, Brajalal Sinha, and CheolGi Kim* Department of Materials Science and Engineering, Chungnam National University, Daejeon 305-764, Korea
(Received 5 November 2012, Received in final form 26 November 2012, Accepted 27 November 2012) We have designed, fabricated and tested an integrated microfluidic chip with a Planar Hall Effect (PHE) sensor. The sensor was constructed by sequentially sputtering Ta/NiFe/Cu/NiFe/IrMn/Ta onto glass. The microfluidic channel was fabricated with poly(dimethylsiloxane) (PDMS) using soft lithography. Magnetic nanoparticles suspended in hexadecane were used as ferrofluid, of which the saturation magnetisation was 3.4 emu/cc. Droplets of ferrofluid were generated in a T-junction of a microfluidic channel after hydrophilic modification of the PDMS. The size and interval of the droplets were regulated by pressure on the ferrofluid channel inlet. The PHE sensor detected the flowing droplets of ferrofluid, as expected from simulation results. The shape of the signal was dependent on both the distance of the magnetic droplet from the sensor and the droplet length. The sensor was able to detect a magnetic moment of 2 × 10⁻¹⁰ emu at a distance of 10 µm. This study provides an enhanced understanding of the magnetic parameters of ferrofluid in a microfluidic channel using a PHE sensor and will be used for a sample inlet module inside of integrated magnetic lab-on-a-chip systems for the analysis of biomolecules. Keywords : magnetic sensor, droplet, magnetic nanoparticle, ferrofluid, microfluidics
1. Introduction Magnetic sensors detect magnetic fields and have been used in data storage, proximity switches, position sensing, speed detection and current sensing. The high sensitivity of magnetoresistive sensors to very weak magnetic fields at room temperature is utilised in biomolecular recognition [16]. Proteins, antibodies or nucleic acids are attached to magnetic nanoparticles or microbeads and employed in detecting a target molecule with the help of conjugating probes immobilised on the surface of the magnetic sensor. Many types of magnetic nanoparticles are synthesised, functionalised and applied as biological labels inside colloidal suspensions [2]. Superparamagentic nanoparticles with a size of ~10 nm have no remaining magnetisation and facilitate even dispersion. Ferrofluid is a stable colloidal suspension of these magnetic nanoparticles. Most of the early research in the field of magnetic sensors have been focused on improving the limits of detection. Many types of sensors have been investigated, including ©The Korean Magnetics Society. All rights reserved. #
These authors contributed equally to this work. *Corresponding author: Tel: +82-42-821-6893 Fax: +82-42-822-6272, e-mail:
[email protected]
giant magnetoresistive (GMR) sensors, anisotropic magnetoresistive ring (AMR) sensors, semiconductor Hall sensors, PHE sensors and magnetic tunnel junctions (MTJs) [2]. Detection of single magnetic microbeads has been demonstrated with Hall sensors [7], MTJs [8] and PHE sensors [9]. Measurement instrumentation has also been improved to increase the signal-to-noise ratio by using lock-in amplifiers. For biosensing applications, magnetic sensors are exposed [7, 9-12] or integrated into microfluidic systems [8, 13-15]. Magnetic beads and nanoparticles are dropped on the exposed sensor and the signal is measured. The integrated sensor allows dynamic detection of the flowing magnetic nanoparticle or nanobead. Valves, pumps and mixers can be added to the microfluidic system with the magnetic sensor, which can be developed into an automated and complex analytical system. Ferrofluid has been widely used as a magnetic material for testing the performance of magnetic sensors [9, 11, 13, 15-17]. Most of the signals from ferrofluids are weak and respond to slow flowing with the exception of one group [15], who has simulated the shape of magnetic signal of ferrofluid. They demonstrated the use of microfluidic chips to generate ferrofluid droplets at high frequencies and its detection with a GMR sensor. The picoliter magnetic nanoparticle droplet is a prerequisite for the performance of a © 2012 Journal of Magnetics
− 303 −
Magnetic Sensor-Based Detection of Picoliter Volumes of Magnetic Nanoparticle Droplets… − Ilgyo Jeong et al.
lab-on-a-chip, based on the magnetic method. However, few available references describe the monitoring of a flowing droplet. In this work, we designed, constructed and tested an integrated microfluidic chip with a PHE sensor. Different sizes of ferrofluid droplets were generated using a microfluidic channel. The flow of the droplets was detected with the sensor and simultaneously observed with a microscope. The induced magnetic moment of the droplet was simulated and compared to the obtained signal. The detection limit was calculated from the magnetic properties of the ferrofluid and the signal.
2. Simulation of the Magnetic Field from a Magnetic Nanoparticle Droplet A finite element method (FEM) simulation using Max-
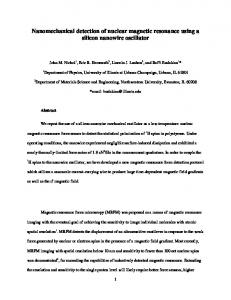
well software (Ver. 12.2, Ansoft, USA) was used to analyse the induced magnetic field of magnetic nanoparticle droplets. A two-dimensional map of the magnetic field at a distance from a droplet of magnetic nanoparticles was calculated along with the magnetic properties (Fig. 1). The saturation magnetisation was 3.4 emu/cc. A parallel external field of 15 Oe was applied to an elliptical droplet with a thickness of 10 µm, a length of 100 µm and a width of 50 µm. The average x-component of the magnetic field along the x-axis (Fig. 1(c)) was obtained from the simulated field contour map (Fig. 1(b)). A magnetic sensor detected the averaged magnetic field on the entire surface of the droplet. The simulated field shows symmetry in the two maximum peaks surrounding two valleys, as reported [15]. The two peaks are found at both the tips of the elliptical droplet (Fig. 1(b)). The intensity of the magnetic field is inversely proportional to the cubed distance of the droplet from the sensor surface. The intensity decreases on both sides of the droplet. This phenomenon is also observed as the plane used for calculation of the magnetic field moves farther from the droplet (Fig. 1(c)). The positions of the zeroinduced fields shift to the left and right from the centre as the height increases. Additionally, the two valleys become shallower and finally merge when the height of droplet is larger than 10 µm. The values of the minimum and maximum field strengths are similar at the shortest distance. However, the maximum value decreases to be smaller than the minimum value with increasing droplet height. The rate of decrease of the maximum peak strength is greater than that of the valley with droplet height.
3. Experiment
Fig. 1. (Color online) Simulation of the average magnetic field of a magnetic nanoparticle droplet with a length of 100 µm. (a) Schematic side view of a droplet (black central bar) and the plane for the simulation of magnetic field (thick dotted blue line). (b) A map of the induced magnetic field from a droplet at a distance of 10 µm. The white line is the boundary of the droplet. The Y-axis is expanded relative to X-axis to show the droplet and the magnetic field clearly. (c) An average of the ycomponent of the magnetic field along the x-axis generated from the droplet at different droplet heights. An external magnetic field of 15 Oe is applied longitudinally along the droplet.
3.1. Fabrication of a microfluidic chip integrated with a magnetic sensor A spin-valve magnetic sensor was patterned on a glass substrate using conventional photolithography and lift-off technique [10]. First, the negative patterns of the sensor and electrodes were drawn using AutoCAD software and printed on a transparent film at a resolution of 25,000 dpi. The inverse image of the photoresist layer was created with AZ 5462 (MicroChemicals, Germany) on a glass. A spin-valve structure of Ta(3)/NiFe(10)/Cu(1.2)/NiFe(2)/IrMn(10)/Ta(3) (nm) was deposited on the photoresist-coated glass in a sputtering chamber. The photoresist layer was removed with acetone. Gold electrodes were connected to the sensor using the same process. The active area of the magnetic sensor was 50 µm × 50 µm. A PDMS block was produced using soft-photolithography. The negative pattern of a microfluidic channel was drawn using AutoCAD software and printed onto a transparent film at high resolution. A mould for the channel with a width of 100 µm and a thickness of 15 µm was fabricated
Journal of Magnetics, Vol. 17, No. 4, December 2012
− 304 −
on a silicon wafer with SU-8 25 photoresist (MicroChem, USA). The PDMS prepolymer base and curing agent (Sylgard 184, Dow Corning, USA) were mixed at a 10:1 ratio and degassed. The mixture was poured into the mould and cured at 70°C for 1 h. The solidified PDMS block was lifted out of the mould and punched to create the inlet and outlet. The PDMS channel was aligned and bonded on the magnetic sensor after being treated with a plasma cleaner (CUTE, FEMTO SCIENCE, Korea) for 90 s at 0.5 Torr of oxygen and 100 W. The hydrophobic surface of the PDMS was modified to be hydrophilic with tetraethoxysilane (TEOS) (Sigma, USA) [18]. The assembled channel was injected with a solution of 10% TEOS in ethanol for 1 h, washed with ethanol and dried in vacuum.
3.2. Characterisation of the magnetic nanoparticles Nanoparticles were diluted in hexadecane (TCI, Japan) for ferrofluid formation. Images from transmission electron microscopy (TEM) of the magnetic nanoparticles were obtained using a TecnaiTM F20 transmission electron microscope (EFI Co., USA) at 200 kV. The magnetic properties of the magnetic nanoparticles were measured using a vibrating sample magnetometer (VSM) (7407 series, Lakeshore, USA) with a sensitivity of 10−6 emu. A tube for sample was filled with 50 µL of ferrofluid and sealed with plastic glue. The measurement was carried out with an external field range of ± 10 kOe at room temperature. 3.3. Measurement set up Two sets of Helmholtz coil were aligned on a solid aluminium board to generate a uniform magnetic field (Fig. 2(a)). A controlled current was applied to the coils with 5050 Linear Amplifier (AE Techron, USA) connected to a data acquisition system (DAQ) (National Instruments, USA). A stage for a microfluidic chip (Fig. 2(b)) was inserted at the centre of the magnetic field. A current of 5 mA was applied to the magnetic sensor using a current source (6220, Keithley, USA). A nano-voltmeter (2182A, Keithley, USA) was used to measure the change in voltage from the response of the passing magnetic droplet over the magnetic sensor. The output of the voltmeter was connected to a computer with GPIB-USB-HS (National Instruments, USA) and recorded using LabView (National Instruments, USA). Droplets of magnetic nanoparticles in hexadecane were generated at the T-junction of the microfluidic channel (Fig. 2(c)) [19]. The interval, speed, and length of the droplets were regulated by applying air-pressure to the dispersed hexadecane phase and the continuous liquid solution phase of 50% polyethylene glycol (PEG, average Mn 400) (Sigma, USA) and 1% sodium dodecylsulfate (SDS) (Sigma, USA). The pressure was generated from an air compressor and monitored with a G49D pressure gauge (CKD, Japan). The applied pressure was regulated with a solenoid valve (Lee Co., USA). Bright field images were captured with a CCD
Fig. 2. (Color online) Experimental setup for the generation and detection of magnetic nanoparticle droplets. (a) Measurement system: the Helmholtz coil produces a uniform magnetic field. An integrated microfluidic chip is loaded onto the stage and is connected to measuring instruments and tubes of the continuous and dispersion phases. The flowing droplets are observed via the CCD camera. (b) Design of the integrated microfluidic chip. Continuous phase is injected into the microfluidic channel (blue) to generate droplets of ferrofluid. The inset shows the magnetic sensor (yellow) under the microfluidic channel (blue). The sensor is connected to the electrodes (red). (c) Micrograph showing the generation process of a droplet of magnetic nanoparticles at the T-junction. Blue-dyed continuous phase (50% of PEG and 1% of SDS) is injected, and it cuts the ferrofluid flow creating droplets.
camera (ARTCAM, ARTRAY Co., Japan) using a Navitar zoom lens (Navitar, USA) with iSolution software (IMT iSolution Inc., Canada).
4. Results and Discussion 4.1. Characterisation of the hexadecane-suspended magnetic nanoparticles Magnetic nanoparticles are generally synthesised in organic
− 305 −
Magnetic Sensor-Based Detection of Picoliter Volumes of Magnetic Nanoparticle Droplets… − Ilgyo Jeong et al.
at H = 0 Oe and a saturation magnetisation of approximately 3.4 emu/cc. The magnetic nanoparticles were round, with a size of approximately 10-20 nm (Fig. 3(b)). The TEM image shows well-dispersed nanoparticles which were clustered after washing with ethanol. A strong magnet was able to attract the entire sample of ferrofluid, demonstrating the sample’s high colloidal stability (Fig. 3(c)). These properties make ferrofluid an ideal material for testing the magnetic sensor.
Fig. 3. (Color online) Properties of the Fe3O4 magnetic nanoparticles. (a) Magnetic hysteresis loop of the hexadecane-suspended magnetic nanoparticles (50 µL) used in the experiment at room temperature. The inset shows the full field magnetic property of ferrofluid with a magnetic saturation of 0.17 emu. (b) TEM image of the magnetic nanoparticles. The size of the magnetic nanoparticles is approximately 10-20 nm and their shape is round. (c) High colloidal stability of the hexadecanesuspended magnetic nanoparticles is shown in the response to an externally applied magnetic field.
solvents [20]. Their dispersion in water is very poor. Thus, many surface modifications are made to render it waterdispersible. We used an organic solvent-based suspension of magnetic nanoparticle, ferrofluid. The obtained ferrofluid was diluted in hexadecane. The magnetic properties were analysed using the liquid sample with VSM (Fig. 3(a)). The VSM curve shows high noise, especially at both ends of a high magnetic field. The tube for the VSM sample was not filled completely with ferrofluid, resulting in vibrational noise in the high magnetic field region. The sample exhibited superparamagnetic properties, no residual magnetisation
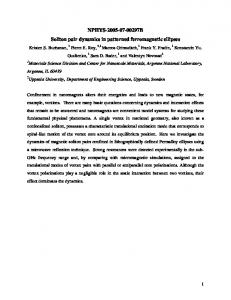
4.2. Generation and detection of ferrofluid droplets Ferrofluid contains well-suspended magnetic nanoparticles in a solvent. Its fluidic properties are similar to that of a liquid. Hexadecane-suspended magnetic nanoparticles were used in this experiment. PDMS was used for the fabrication of an integrated microfluidic chip constructed with a fluidic channel and a magnetic sensor (Fig. 2(b)). The T-junction of the channel was used to generate droplets of ferrofluid. The size and interval of the droplets were regulated by changing the air-pressure at the inlet of the ferrofluid channel and the opening time of the pressure-valve. Long droplets were produced by applying higher pressure on the inlet channel of the ferrofluid. The hydrophobic PDMS microchannel tended to capture the droplets, resulting in blockages of the microfluidic channel. The TEOS coating on the PDMS channel inhibited sticking of ferrofluid to PDMS and produced well-flowing droplets of ferrofluid (Fig. 2(c)). Serial droplets of ferrofluid were generated at the T-junction and detected with the magnetic sensor (Fig. 4). As expected from the simulation data, the signal displayed two maximum peaks and one valley. The signal maximum value compared to the base line, approximately 3 µV, was relatively small compared to the minimum value compared to the base signal of approximately 15 µV. This finding indicates that the droplet height from the magnetic sensor was substantial but within the range of detection for the magnetic droplet. The height was estimated to be greater than 5 µm, according to the simulation (Fig. 1(c)). We were able to obtain signals in other experiments with similar maximumto-minimum ratios to those reported [15]. This finding suggests a smaller distance between the magnetic droplet and the sensor. Additional experiments with different heights in the microfluidic channel will provide clear comparisons for the simulated data (Fig. 1(c)). The micrograph and signal from ferrofluid droplets were captured and measured simultaneously in the experimental setup (Fig. 2(a)). The length and width of the small elliptical droplet in Fig. 4 were approximately 100 µm and 50 µm, respectively. The thickness of the droplet was presumed to be 10 µm, based on the dimensions of the microfluidic channel. From these values, the volume of the droplet was estimated to be 40 pL. The induced magnetic moment from 50 µL of the ferrofluid was approximately 7 × 10⁻³ emu at 15 Oe (Fig. 3(a)). Based on these values, the magnetic
Journal of Magnetics, Vol. 17, No. 4, December 2012
− 306 −
Fig. 5. (Color online) Simultaneous microscopic observation and magnetic detection of the ferrofluid droplets with different sizes. The left images show micrographs of ferrofluid droplets flowing over the magnetic sensors. The stray magnetic field from the droplet of ferrofluid was measured with the magnetic sensor (shown in images on the right).
Fig. 4. (Color online) Detection of ferrofluid droplets with a PHE sensor. (a) Sensor signal recorded during a continuous flow of ferrofluid droplets. The long downward peaks correspond to the sensing of droplets. (b) The peak indicated by an arrow in part (a) is zoomed in on. (c) Images of ferrofluid droplets flowing over a PHE sensor captured at the times indicated by the arrows in part (b). The maximum peaks observed in (b) at 15.2 s and 15.6 s are detected when the droplet is in the leftmost image in (c) and the rightmost image in (c), respectively. The valley observed at 15.5 s in (b) is detected when the droplet is placed on the sensor, the middle image in (c).
moment of the 40 pL droplet was calculated to be approximately 6 × 10⁻⁹ emu. The signal intensity was 15 µV (Fig. 4). The measurable minimum signal for this system was 0.5 µV, indicating that it is possible to detect a magnetic moment as low as 2 × 10⁻¹⁰ emu. Lower levels of magnetic fields may be sensed if advanced measurement setup and noise reduction are employed. Different sizes of magnetic droplets were generated by regulating the pressure on channel inlet for the ferrofluid. These different sizes were also detected with the magnetic sensor (Fig. 5). Both the experimental results for the middle and long droplets show two valleys, as in the simulation data (Fig. 1(c)). The maximum and the ratio of
the maximum and minimum signals were similar irrespective of the size of the magnetic droplets. However, the width of the signal was not directly proportional to the length of droplet. A long droplet had a wider signal compared to its increase in size. The droplets’ flow rate should be considered in order to fully understand its signal.
5. Conclusions We successfully designed, constructed and tested an integrated microfluidic chip with microfluidic channels and a PHE magnetic sensor. A system for visual and magnetic observations of droplets of magnetic nanoparticles was installed with the integrated chip and with a detection limit of 2 × 10⁻¹⁰ emu. The chip generated droplets of magnetic fluid, which were detected by the magnetic sensor. A simulation of the induced magnetic field showed good correlation with the experimental data and provided information on the distance between the sensor and the magnetic droplet. We are now exploring the development of a system for application in the detection of biological samples on a magnetic lab-on-a-chip.
Acknowledgements This research was supported by the World Class University program through the National Research Foundation of Korea
− 307 −
Magnetic Sensor-Based Detection of Picoliter Volumes of Magnetic Nanoparticle Droplets… − Ilgyo Jeong et al.
funded by the Ministry of Education, Science and Technology (R32-20026).
References [1] P. P. Freitas, R. Ferreria, S. Cardoso, and F. Cardoso, J. Phys.: Condens. Matter 19, 165221 (2007). [2] D. L. Graham, H. A. Ferreira, and P. P. Freitas, Trends Biotechnol. 22, 455 (2004). [3] B. Srinivasan, Y. Li, Y. Jing, Y. Xu, X. Yao, C. Xing, and J. Wang, Angew. Chem.-Int. Edit. 48, 2764 (2009). [4] R. S. Gaster, L. Xu, S. Han, R. J. Wilson, D. A. Hall, S. J. Osterfeld, H. Yu, and S. X. Wang, Nature Nanotech. 6, 314 (2011). [5] R. S. Gaster, D. A. Hall, C. H. Nielsen, S. J. Osterfeld, H. Yu, K. E. Mach, R. J. Wilson, B. Murmann, J. C. Liao, S. S. Gambhir, and S. X. Wang, Nature Med. 15, 1327 (2009). [6] Y. Li, B. Srivivasan, Y. Jing, X. Yao, M. A. Hugger, J. Wang, and C. Xing, J. Am. Chem. Soc. 132, 4388 (2010). [7] P. Besse, G. Boero, M. Demierre, V. Pott, and R. Popovic, Appl. Phys. Lett. 80, 4199 (2002). [8] W. Shen, X. Liu, D. Mazumdar, and G. Xiao, Appl. Phys. Lett. 86, 253901 (2005). [9] L. Ejsing, M. F. Hansen, A. K. Menon, H. A. Ferreira, D. L. Graham, and P. P. Freitas, Appl. Phys. Lett. 84, 4729 (2004).
[10] B. Sinha, S. Anandakumar, S. Oh, and C. Kim, Sens. Actuators A 182, 34 (2012). [11] G. V. Kurlyandskaya, M. L. Sánchez, B. Hernando, V. M. Prida, P. Gorria, and M. Tejedor, Appl. Phys. Lett. 82, 3053 (2003). [12] R. E. Thilwind, M. Megens, J. B. A. D. van Zon, R. Coehoorn, and M. W. J. Prins, J. Magn. Magn. Mater. 320, 486 (2008). [13] A. García-Arribas, F. Martínez, E. Fernández, I. Ozaeta, G. V. Kurlyandskayay, A. V. Svalov, J. Berganzo, and J. M. Barandiaran, Sens. Actuators A 172, 103 (2011). [14] F. W. Østerberg, B. T. Dalslet, C. D. Damsgaard, S. C. Freitas, P. P. Freitas, and M. F. Hansen, IEEE Sensors J. 9, 682 (2009). [15] N. Pekas, M. D. Porter, M. Tondra, A. Popple, and A. Jander, Appl. Phys. Lett. 85, 4783 (2004). [16] J. Feng, Y. Q. Wang, F. Q. Li, H. P. Shi, and X. Chen, J. Phys.: Conf. Ser. 263, 0122002 (2011). [17] M. Denoual, M. Harnois, S. Saez, C. Dolabdjian, and V. Senez, DOI: 10.1109/TRANSDUCERS.2011.5969140. [18] A. R. Abate, D. Lee, T. Do, C. Holtze, and D. A. Weitz, Lab Chip 8, 516 (2008). [19] S. Teh, R. Lin, L. Hung, and A. P. Lee, Lab Chip 8, 198 (2008). [20] N. A. Fey, S. Peng, K. Cheng, and S. Sun, Chem. Soc. Rev. 38, 2532 (2009).