necessary to classify images relevant to a given theme to one or more sub-topics or clusters. We describe the challenges in building (as far as we are aware) the ...
Creating a test collection to evaluate diversity in image retrieval Thomas Arni, Jiayu Tang, Mark Sanderson and Paul Clough Department of Information Studies, University of Sheffield, UK
ABSTRACT This paper describes the adaptation of an existing test collection for image retrieval to enable diversity in the results set to be measured. Previous research has shown that a more diverse set of results often satisfies the needs of more users better than standard document rankings. To enable diversity to be quantified, it is necessary to classify images relevant to a given theme to one or more sub-topics or clusters. We describe the challenges in building (as far as we are aware) the first test collection for evaluating diversity in image retrieval. This includes selecting appropriate topics, creating sub-topics, and quantifying the overall effectiveness of a retrieval system. A total of 39 topics were augmented for cluster-based relevance and we also provide an initial analysis of assessor agreement for grouping relevant images into sub-topics or clusters.
Categories and Subject Descriptors H.3.3 [Information Storage and Retrieval]: Information Search
General Terms Measurement, Experimentation, Human Factors, Verification.
Keywords Diversity, image test collection, evaluation, image retrieval, building test collection
1. INTRODUCTION It is common for modern search engines to ensure that duplicate or near-duplicate documents retrieved in response to a query are hidden from the user. This in turn leads to results (typically a ranked list), which offers a greater diversity: describing different sub-topics; or representing different senses of a query. This functionality is particularly important when a user’s query is either ambiguous or poorly specified. Users issuing such queries are likely to have a clear idea of the kind of items they wish to retrieve, but the search engine has little knowledge of users’ exact preferences. A search engine that retrieves a diverse, yet relevant, set of documents at the top of a ranked list is more likely to satisfy the user [1, 2, 9]. New diversity-aware retrieval systems should not only increase diversity within the top n documents of the result set, but also reduce redundancy in the overall results set.
In turn, eliminating redundancy should lead to promotion of novelty leading to an overall set of results which are likely to be more satisfying to a user. Although diversity is a key aspect to many commercial search engines, there are limited benchmarking resources to evaluate approaches for generating diverse results sets. To the best of our knowledge, only one test collection exists that provides some support for evaluating diversity [19]. However, in the field of image retrieval no such collection exists, despite the benefits that such a resource might offer. Building test collections is typically an expensive task in terms of time and effort [12]. However, we describe how to reduce the amount of effort involved by augmenting a pre-existing image test collection to support the evaluation of diversity. The remainder of the paper is organized as follows: Section 2 describes related literature; Section 3 discusses principles behind evaluation, the ImageCLEFPhoto evaluation campaign as well as this year’s task., Section 4 shows a the process of creating a test collection for diversity, comparison of cluster judgements as well as some statistics. Section 6 describes metrics to quantify retrieval effectiveness; and Section 7 concludes the paper and describes future work.
2. LITERATURE REVIEW 2.1 Probability Ranking Principle The underlying principle of many classic document ranking systems is the Probability Ranking Principle (PRP). According to a common interpretation of this principle, retrieval systems should rank documents, which are most similar to the query, nearer the top of a ranked list, as well as maximize the number of relevant documents returned. Documents are therefore ranked in decreasing order of their predictive probabilities of relevance. Under reasonable assumptions, one can prove that ranking documents in descending order by their probability of relevance yields the maximum expected number of relevant documents, and thus maximizes the expected values of the well known precision and recall metrics [1]. However, simply returning all relevant documents including duplicates or near-duplicates, is not always the best way to satisfy a user’s needs [2, 9]. Therefore, the common interpretation of the PRP needs to be re-thought, and consequently, new retrieval techniques are needed. To test their effectiveness and improve them, adequate test collections are essential.
2.2 Definition of Terms Copyright is held by the author/owner(s). SIGIR 2008 Workshop: Beyond Binary Relevance: Preferences, Diversity and Set-Level Judgments, July 24th, 2008, Singapore. ACM 978-1-60558-164-4/08/07
There is no general consensus in the literature about the naming of a more fine-grained categorization of relevant documents for a given topic. Terms such as “Sub-Topics” [1, 5], “Topic Aspects” [19], “Topic Instances” [6], “Facets” are interchangeably used and refer to the same concept. We refer to this concept as “Topic
Clusters”. The intention is always to group all relevant images into groups with similar content or to define to which group(s) a relevant image belongs to. While identifying relevant documents is one part of the search process, it is also crucial to include documents on as many sub-topics at the top of the results list as possible.
2.3 TREC Interactive Track The TREC Interactive Tracks 6, 7 and 8 have all focused on an instance recall task [16]. Searchers from each participating group were instructed to save as many documents as possible in 20 minutes on different aspects/instances of a topic. TREC assessors identified, a priori, all possible aspects (or instances) of a given topic. The resulting aspectual judgements were then used to measure the diversity of results sets generated by the searchers. Instance recall and instance precision metrics were used to compare results of participating groups and organisers concluded that methods such as relevance feedback, Okapi term weighting, and document summarisation did not improve instance recall. It is possible to use the aspectual judgements from the TREC assessors as a test collection to quantify diversity within the results set produced by ad hoc search. However, the number of topics which can be used for evaluation is limited because only six to eight new topics where introduced each year during the three years of the interactive track (a total of only 20 topics is available). Organisers of TREC themselves, however, argue that 25 topics is the minimum number of topics which should be used in comparative evaluations because system rankings become unstable with fewer topics [17].
2.4 Novelty Novelty aims to avoid the redundancy of documents in the results set and Maximal Marginal Relevance (MMR) is one approach which has shown to increase novelty successfully [9]. It is assumed that a user is satisfied with only one, or a few similar relevant documents in the results set, instead of finding duplicates or near-duplicates. While reducing or eliminating redundancy in the results set should not only promote novelty, but also diversity (the emphasis on novelty is therefore an indirect way of promoting diversity and vice versa [14]). Novelty and diversity are thus related and normally the increase of one will help the other.
2.5 Maximal Diverse Relevance While MMR aims to optimize novelty, Maximal Diverse Relevance (MDR) tries to specifically promote diversity. Zhai [14] proposes a method with mixture language models to directly increase the diversity of the result. Zhai [ibid.] used the aspectual judgements form TREC Interactive to measure diversity. However as mentioned earlier, the quantity of topics is at the absolute lower limit.
3. EVALUTION PRINCIPLES 3.1 History of evaluation campaigns Cranfield is generally regarded as the first IR test collection, which defined the model used for evaluation ever since [13]. For more than a decade, standard ad hoc retrieval campaigns such as
Text REtrieval Conference (TREC1), the Cross-Language Evaluation Forum (CLEF2) and the NII-NACSIS Test Collection for IR Systems (NTCIR3) have defined the manner in which large-scale comparative testing of search engines is conducted. The goal of all evaluation campaigns, and their test collections, is to measure and improve retrieval algorithms and methods for specific tasks (e.g. filtering, routing, adhoc retrieval). Metrics like precision and recall have been used to measure retrieval effectiveness and research has lead to an understanding of which retrieval approaches are best suited to optimising precision and recall. One drawback of most collections is that all judged relevant documents per topic in the assessment file (known as the qrels) are independent of each other. Further implications of this assumption are that all relevant documents are equally desirable, the user information need (expressed in the test collection topic) is static and the list of relevant documents is complete [12]. However, not all relevant duplicate or near-duplicate documents are equally desirable from a user’s perspective. Practical concerns of building test collections in a tractable number of person months were the reasons that drove the making of this assumption, because non-independent relevance judgements require much more effort to obtain. Evidence for this derives, in part, from the experiences in building a test collection as part of TREC interactive. Some support for measuring diversity in result sets was provided. However, the assessor effort required to build the collection was high and subsequently only a limited number of queries were created. However, there is increasing evidence that ambiguous illspecified queries are common [18], which has led to increased research in the fields of diversity and novelty [6, 9]. Therefore, it is necessary to re-examine the creation of test collections that support diversity measurement to try to determine the means of creating such collections in a tractable amount of time.
3.2 ImageCLEFPhoto 2008 The need for retrieval systems to produce diverse results is as strong in the field of image retrieval as it is document retrieval. As the organizers of the ImageCLEFPhoto task4, we have tried to address the growing need for diversity from image search engines. Hence, we created an image test collection which specifically allows diversity measurement. The guiding principles for the creation of this new collection were to ensure that result diversity could be measured effectively and make the use of the collection as easy as possible.
3.2.1 Collection overview The ImageCLEFPhoto task uses the IAPR TC-12 image collection, which comprises of 20,000 images with annotations in three different languages [3]. Sixty topics are available in 15 different languages [4], and the collection has been used in various ImageCLEFPhoto tasks during the past two years [7, 10]. 1
http://trec.nist.gov
2
http://www.clef-campaign.org
3
http://research.nii.ac.jp/ntcir
4
http://www.imageclef.org/2008/photo
3.2.2 Diversity in the collection The existing 60 topics of the IAPR TC-12 image collection were derived from a log file analysis and the domain knowledge of topic authors. The topics embrace various search patterns, like locations, tourist destinations, accommodation, animals, people, objects, action or landscapes. Each topic was also classified as to how “visual” they were considered to be. Here, the word “visual” refers to consistence of visual information that can be interpreted from the relevant images of a particular topic. The more “visual” a topic is, the more consistent visual information can be extracted from the relevant images. The level of “visual” is measured by a rating between 1 and 5 based on the score of a content based retrieval systems as well as the opinion of three experts in the field of image analysis [4]. Topics, which are classified as highly “visual” are more likely to produce good results from content based retrieval participants. The topics were also classified by their “complexity”, which defines the difficulty for a retrieval system to return relevant images [4].. The collection contains many different images of similar visual content. This is because most images were offered by a travel company, which repeated fixed itineraries on a regular basis. Therefore the collection’s similar images vary in illumination, viewing angle, weather condition and background [3].
3.2.3 Task Participants in the ImageCLEFPhoto 2008 task this year run each provided topic on their image search system to produce a ranking of images. In the top 20 results, there should be as many relevant images that are representatives of the different clusters within the overall set of results as possible. The definition of what constitutes diversity varies across the topics, but a clear indication is given in the topic indicating what clustering criteria the evaluators used. Participating groups return, for each topic, a ranked list of images IDs. We determine which images are relevant and count how many clusters are represented in the ranking. To make the task for all participants as straightforward as possible, participants only have to submit a usual TREC style results list. Thus the participants are not required to explicitly identify clusters or their labels. At the time of writing the paper, results from all participants have been submitted. We are in the process of evaluating all submissions, using the “gold standard” assessment file we created, which contains the information of cluster belongings of relevant images. In the following, we will discuss the details of the creation of clusters.
4. COLLECTION CREATION 4.1 Topic selection and enrichment 4.1.1 Deciding on cluster type To measure the diversity of a results set, the relevant images of each topic have first to be grouped into clusters. We examined each of the existing topics that are part of the collection to identify which topics would be good candidates for clustering. For the majority of the topics, the clustering was clear. For example, if a topic asked for images of beaches in Brazil, clusters
were formed based on location. The cluster type in this case is the location of the beach. If a topic asked for photos of animals, clusters were formed based on animal type. Typical clusters according the given cluster type “animal” would be Elephant, Lion, and Crocodile etc. However, there is room for subjective interpretation regarding how an optimal clustering should be defined. This is not a new problem; all existing test collection topics have some kind of subjective relevance assessment and the same is true for cluster assessment. Therefore, to form the clusters, a cluster type was determined and all images classified according to this cluster type.
4.1.2 Topic selection Out of the 60 existing topics it was judged that 39 were appropriate to use in the evaluation. The remaining 21 topics were either: (a) too specific, (b) lacked diversity within the relevant images or (c) were considered too difficult to cluster.
4.1.3 Cluster types As mentioned, we had to decide on a cluster type for each topic. Without an explicitly-defined cluster type, it would not be possible to compare diversity in the results sets of groups participating in ImageCLEFPhoto. For the task, it is necessary that all participants cluster the images according to the given cluster type. The 39 selected topics can be classified into two main groups of cluster types: Geographical and Miscellaneous. Table 1 shows different cluster types, as well as the number of corresponding topics. We believe that the 39 topics and their cluster type are well-balanced, diverse and should present a retrieval challenge to participants wishing to use either text and/or low-level visual analysis techniques for creating clusters. We expect that due to the detailed geo-referencing in the annotations of the images, a use of geographical knowledge will also help. Table 1. Overview of the cluster types Group
Country
Number of topics 12
City
5
Region / state
5
Animal
4
Sport
2
Vehicle
2
Composition
2
Weather condition
1
Cluster type
Geographical
Miscellaneous
Venue / tourist attraction / landmark Religious statue Volcano
4 1 1
4.2 Cluster assessment For each topic in the ImageClefPhoto set, relevant images need to be manually clustered into sub-topics. Cluster relevance judgements are required to indicate which cluster a relevant image belongs to. Relevance assessors were instructed to look for simple
clusters based on the cluster type of a topic. Three assessors were invited to cluster the relevant images of a topic into sub-topics. Firstly, two assessors, A1 and A2, were asked to manually judge all relevant images from each of the 39 topics according to the pre-defined cluster type. Then, a third assessor, A3, was asked to do the clustering, however only on the topics that the first two assessors could not achieve sufficient agreement. No time limit was given to any assessor to complete their judgements.
details on the 8 topics, i.e. description of the theme of topics, and the cluster types used for each topic.
The first two assessors used a graphical web tool showing all relevant images to categorize the images from one topic at a time. The assessor wrote down the ID of the image and assigned it to their individual chosen clusters. They were allowed to classify an image to more than one cluster, if this seemed appropriate to them. Topics, which needed further investigation, were given to the third assessor A3.
4.2.1 Cluster assessment file The cluster assessments from the three assessors are stored in three separate files. Each file stores the individual information for each of the 39 topics to which cluster(s) a relevant image belongs to. These judgements were then used to compare the cluster assessments from the assessors to build a “golden” standard cluster assessment file. Further details are described in the following section.
4.3 Cluster comparison Different judgements were observed across the assessors for some of the clusters. The geographic-based clusters types, as shown in Table 1, had an almost complete agreement from the first two assessors. Other topics from the Miscellaneous class had also a very large agreement. This means that the judgements from assessor A1 and A2 were nearly or completely consistent, were not analyzed further. Some small inconsistencies were found to be errors from one of the assessors. For example assessor A2 clustered some images from topic 6 (straight road in the USA), which has to be clustered by state, in a cluster “San Francisco”. San Francisco is though not a state, which is defined in the cluster type of the topic. Therefore the correct cluster assignments of these pictures belong to the cluster “California”. However, for 8 out of 39 of the topics there was variation. Reasons for this were analysed and found to be mainly because of (a) different notions of granularity, (b) different domain knowledge, (c) different interpretation of topic or (d) assignment of images to multiple clusters. These 8 topics were then given to assessor A3.
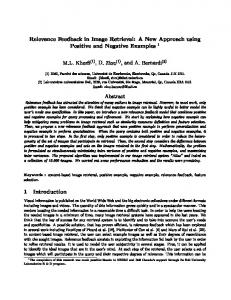
4.3.1 Granularity It was found that assessors can have a slightly different understanding of cluster granularity. In the 8 topics, a different granularity was observed. An example was that assessor A2 chose to classify animal images in a cluster bird, whereas assessor A1 had chosen specific bird types like pelican, condor etc. apart from other already defined clusters like dolphins, monkeys etc. However, it was not the case that one of the assessors consistently used more specific clusters; each assessor was in some cases more specific than the other 2 assessors. An overview of the comparison of different number of clusters generated by different assessors’ clustering is shown in Figure 1. Table 2 gives more
Figure 1. Granularity shown by the number of clusters Table 2. Topics with different granularity Topic Nr. 3
Topic
Cluster type
religious statue in the foreground
statue
5
animal swimming
animal
10
destinations in Venezuela
location
16
people in San Francisco
landmark
20
close-up photograph of an animal
animal
37
sights along the Inca-Trail
tourist attraction
44
mountains on mainland Australia
location
48
vehicle in South Korea
vehicle type
4.3.2 Multi clusters The first two assessors were encouraged to classify an image into more than one cluster, if this seemed appropriate to them. Although these instructions were given, a total of only 13 relevant images out of 2401 relevant images from 6 different topics belong to more than one cluster. An example is to cluster images by famous landmarks in Sydney. In one and the same image, both the Harbour Bridge and the Opera House can be prominent. Thus these images are classified in both cluster Opera House and Harbour Bridge. In case of doubt, an image was classified in both clusters so that participants are not disadvantaged whatever cluster they have chosen to classify the image. Contrary to the interactive TREC-Experiments no large overlap of documents within the topic clusters was observed. However, we regarded this as a positive quality as often in search, where diversity is a desired, such as dealing with ambiguous queries, overlap between clusters would be expected to be low.
4.3.3 Unknown clusters In four topics, there are relevant images which cannot be classified to a certain cluster. The reason is because some specific information is missing in the image’s caption, in the image itself or there is lack of domain knowledge from the assessor. In one
topic for example, where clustering must be done by city, a specific city annotation/caption is not available. Thus these images are classified in an unknown cluster. However, the total amount of relevant images assigned to unknown cluster is only 48 out of 2401 relevant judged images and appears in a total of 4 out of 39 topics. The occurrence of unknown images in these 4 topics varies between 1% up to 29 % of all relevant images for the given topic. Due to the lack of domain knowledge no further investigation was done to assess these unknown images to the already given clusters or to new ones. However, images from unknown clusters do not imperatively belong to the same cluster, because they don't have to be similar to each other. Because of the small amount of occurrences no further sub clustering is applied.
4.3.4 Creating “gold standard” cluster judgements After comparing the clusters from each assessor, a “gold standard” was defined. Although a true “gold standard” hardly exists in real life because different people have different views of an appropriate cluster type, we try to create one as general as possible based on the judgements of 3 assessors. For the 8 topics with different granularities as shown in Figure 1, a granularity acceptable to 3 assessors was agreed. For all other topics the gold standard was already obvious due to the high level of cluster agreement. Small disagreements were corrected in a way, which all assessors could agree on. In one case however (topic 10), it was not only a different granularity, but also a total different understanding of the cluster type which resulted in various clusters. Further analysis and perhaps more assessors will be needed to come to a point where all assessors could agree. If this will be not the case, we have to consider dropping this topic because the assessor could not identify a common denominator. Table 3. Cluster statistics Mean
Median
Range [min, max]
Number of clusters/topic
Ø 7.9 ± 5.0
7
2, 23
Number of relevant images/topic
Ø 61.6 ± 33.7
60
18, 184
Description
4.4 Statistics Table 3 provides some descriptive statistics regarding the 39 topics, the corresponding cluster number and relevant image number. On average there are 7.9 clusters per topic, with an average of 61.6 relevant images per topic. The whole collection comprises of 20000 images from which 2401 are judged as relevant to the given 39 topics. Out of the 2401 relevant judged images from the 39 topics are 2130 unique. Reason for the deviation is that an image can be judged relevant to more than one topic. In our case 107 images are relevant to 2 topics and 19 are relevant to 3 topics.
5. EVALUATION METRICS Evaluation of IR systems with diversity is not as straightforward as that on ordinary ones. Intuitively, a good diversity IR system ranks relevant documents that cover many different sub-topics
early in the ranking list while avoiding covering the same subtopics repeatedly. This leads to two new criteria as compared with ordinary retrieval: 1) maximize the number of sub-topics covered; 2) minimize the redundancy of covering of sub-topics. Zhai proposed two metrics for evaluation on sub-topic retrieval, namely the sub-topic recall (denoted as S-recall) and sub-topic precision (denoted as S-precision) [6]. They claimed that S-recall and S-precision are natural generalizations of ordinary recall and precision. S-recall at rank K is defined as the percentage of subtopics covered by the first K documents in the list: S-recall at K ≡
( )
K ∪ i =1 subtopics d i nA
where di represents the ith document, subtopics(di) is the number of sub-topics di belongs to, and nA is the total number of subtopics in a particular topic. The S-precision at S-recall level r (0