CREATING KNOWLEDGE TRANSFER ENVIRONMENT: CASE OF ESTONIAN BIOTECHNOLOGY SMES Tõnis Mets Faculty of Economics and Business Administration, Centre for Entrepreneurship, University of Tartu, Narva Rd.4, EE51009 Tartu, Estonia Phone: +3727 376 362; Fax: +3727 376 312; E-mail:
[email protected]
Abstract The aim of this article is to evaluate the ratio of expenditures between fundamental research, applied research and technological development, to analyse this proportion in the innovation processes of Estonian biotech public sector and private SMEs, and to shape supportive measures to knowledge transfer and entrepreneurship in the biotechnology sector. The empirical study explores Estonian biotechnology by mapping the strategy, innovation processes and related expenditures of the public sector and private businesses. The author deduced the gross funding structure proportion of basic and applied research, and product/service development in Estonian biotechnology sector according to the formula: 11:5:1. The structure of research expenditures in the public sector mostly reflects the success of Estonian biosciences rather than the success of the biotech as an economy sector. Some options for improvement of sectoral system of innovation are given. Keywords: knowledge transfer, innovation models, biotechnology, R&D expenditures, sectoral system of innovation. 1. Introduction Life sciences have had long traditions in the University of Tartu since the 19th century, since the time of Karl Ernst von Baer (1792-1876) who was born in Estonia – “a Darwin scale scientist – who discovered the mammalian ovum and notechord, and established the new science of comparative embryology” (Raagmaa & Tamm 2004). There were more favourable circumstances supporting development of Estonian life sciences, incl. medicine, at the University of Tartu during the period of independence in 1918-1940. Later, one of the drivers of new academic competence creation was the decision of Soviet government about research in biotechnology as a sheltered industry in the 1970s. Several enterprises in the field were established in the 1980s, but these all collapsed before 1991 as having no market any more (Talpsep 2005). New biotech companies were established in the beginning of 1990s, during the re-establishment of Estonian independence. These new biotech companies were mostly in some way related to research institutions and universities in the start-up period, sometimes even longer. Technology transfer and commercialisation of research results from university to business has become very topical in the conditions of movement towards knowledge economy in Europe. In the comparison of two best practices of American and European universities, Stanford and Cambridge, the Stanford University and Silicon Valley is demonstrating the majority in creation of new knowledge-based businesses (Moore & Davis
1
2004; Athreye 2004). Lower efficiency in socio-economic value-creation by European universities is evident also from other studies (Lambert Review 2003; Rodrigues 2002). This has raised the question about the change of universities’ mission in society. Over the last two decades, the traditional missions of universities – teaching and research – have been complemented by the third one – economic and social development of society. Adoption of the third mission by academia is called the second academic revolution (Etzkowitz 2004). For universities this means disclaiming the position of ivory tower and becoming a generator of economic wealth in society. The entrepreneurial paradigm of university in the triple helix of University-Industry-Government relations has become the concept leading to understanding of the innovation processes in knowledge economy (Etzkowitz et al. 2000). There are three well-known alternatives to transfer the achievements of university science into economy of the region (Lambert… 2003: 47; Audretsch, Thurik & Verheul 2002): 1. Spin-outs based on the new technological ideas from professors (from university); 2. High-level sales of licences for new technologies; 3. Knowledge spillover effects. The two first ways presume research in the marketable field and the right understanding of real market needs and business opportunities, but also wide range of other preconditions supporting these processes. The third one is possible if the industry in the region or country has capability for knowledge, market or network spillovers, i.e. there is an implementation possibility of university knowledge in direct or indirect way. Altogether the efficient realisation of these alternatives means having favourable environment, which contains “infrastructure of people, business and legal processes, and financial and technical resources” (Bergeron & Chan 2004: 142). Shane describes these environmental influences on university spinoff activity via geographic location, access to capital, locus of property rights, rigidity of the academic labour market and industrial composition of the geographic area (2005). The triple helix framework and the environment of knowledge transfer are the part of national innovation system (NIS) as well as the part of sectoral system of innovation (SSI). The influence of own national innovation environment on spin-off and knowledge transfer processes in a small country like Estonia should not be undervalued as besides the macroeconomic factors this contains the NIS (Marinova & Phillimore, 2003) and SSI (Malerba, 2004). The efficiency of university-industry public-private partnership in innovation processes is mostly depending on the principles of NIS where the government has the key role. The parliament has ratified the Estonian research and development strategy document “Knowledge-Based Estonia” (2002). However, this strategy document envisioned innovation and innovation support structures generally only as secondary to research and development (R&D). It has also been admitted that the ratio of expenditures between fundamental research, applied research and technological development (1:0.7:0.3 respectively; in further text also: R&D-ratio) is highly disproportionate, deviating sharply from the same figures in developed countries (ibid). What has given rise to that particular interpretation is not clear – the author was unable to find what is the basis of this concrete value for R&D-ratio. Other sources that do not distinguish between fundamental and applied research indicate that the ratio of R&D financing is 0.4:1 in Australia and 0.5:1 in the OECD countries (Lester, 2001). Another important question is the share of government and industry in R&D financing and how these sources are mutually related in a concrete (biotechnology) sector. In the USA government R&D investment made 27.8 % and industry share was 66.3 % of total financing sources. About 60 % of government R&D funding in 2000 was spent on development, the remaining money was split almost evenly between basic and applied
2
research. (Bergeron & Chan 2004). Absence of this data about Estonia is the indicator that relevant information is lacking as is the innovation policy based on it. It has been admitted that there is pour co-operation between research and the business sector in Estonia. Estonian companies mostly are not ready to finance (not only high-tech) R&D cooperation with university. This un-readiness is characterizing both partners: the industry as well as the university, which competences frequently do not cover the industry needs (Study… 2003). What should be impact of governmental intervention in this relationship is less studied. Even in more developed economies than Estonia, for example Australia, Portugal, Switzerland or Hungary, the share of government-financed business R&D exceeds 70% of the research budget (Lambert… 2003). At first glance the motivation of the university as the partner is depending on motivation and evaluation system of researchers and professors. Usually the biggest part, about 75% of biotechnology results are the input for pharmacy industry (Bergeron & Chan 2004). But as in Estonia this type of pharmacy plants practically does not exist, there is very little space for spillovers also in other industries such as traditional agricultural and food industry in the region. Especially if we are comparing the number of graduates from the University of Tartu and from Tallinn University of Technology on bachelor, master and doctoral level prepared for working in the sector – about 125 graduates per year – then it is hard to find employers for graduates’ professional qualifications in Estonia, where we have about 200 jobs in research and a little less jobs in the industry, incl. personnel with lower than university level. The graduates can find good jobs in Finland, Sweden or in California, USA but not enough in homeland. Therefore, the first two options of knowledge transfer remain topical in Estonia. The first way is related to the behaviour of individuals – entrepreneurs transfer university knowledge to business by establishing new companies. The other way consists in the creation of entrepreneurial climate in the university, enabling innovative capability and generating “economic wealth in society” by transferring university knowledge into functioning businesses. Academic entrepreneurship combines both ways. (Sijde 2002). What might be the best conditions supporting university knowledge transfer? What should be the strategy of the NIS to realise the challenging goals? Here arises the problem of how to get relevant information, as generalised data from community innovation survey (CIS) and other general statistical databases, for example about expenditure on innovation as a share of total sales (Dynamising… 2002) are not sufficient for decisions to be taken in a concrete economy sector in a concrete country. Even the above-mentioned R&D share in the total innovation expenditure ratio is not trustworthy enough because of the lack of related studies in Estonia. The question about reliable international benchmarks and benchmarking methodology is critical (Lundvall & Tomlinson 2002). The present article aims to evaluate the ratio of expenditure between fundamental research, applied research and technological development, to analyse this proportion in the innovation processes of Estonian biotech public sector and private SMEs, and to shape environment for knowledge transfer and entrepreneurship in the biotechnology sector, which has good prospects as a field of new knowledge economy. Biotechnology was selected also for the reason that all main knowledge transfer and congruent innovation processes of the sector from basic research to commercialisation on the market are represented in Estonia. One cannot say the same about the others, in business meaning even more successful1 knowledge-intensive sector – the ICT sector, which is mainly represented by wide scale of companies from low to high value-added businesses, from subcontract-based production of electronic equipment to special business model based software design. Both ICT businesses are functioning without noteworthy basic scientific
3
knowledge development in the field in Estonia. The biotech sector is rather compact and consequently more readily accessible to empirical studies. Therefore, among other things, this article provides an opportunity to evaluate the agreement between the actual innovation model of the public and private sectors on the example of the Estonian biotech sector. 2. University Knowledge Transfer Environment, Innovation Models and Innovation Systems All Estonian biotech companies are more or less related to universities and public R&Dinstitutions. As mentioned in the introduction, there are two main ways for commercialisation of the results of academic research: by knowledge (technology) transfer to either new start-up (spin-off) companies or to existing businesses (Sheen 2002). Both ways follow different routes before new technologies can be transferred to industry. On the one hand, the latter can be produced by undergraduate and post-graduate studies/research, by contract and collaborative research, by the creation of new strategic (technology) platforms, or on the other hand, simply by auditing and licensing previous R&D results (ibid). In both cases the university-company relations are usually regulated by a licence agreement. The current paper does not focus on different types of university spin-offs, the categorisation of which, as described by several authors (e.g., Rasmussen 2004; Smith & Ho 2005), is based on different knowledge transfer routes and ownership of start-ups. Herein the knowledge transfer is viewed as a phenomenon permeating all stages (phases) of innovation in society. The (technology) knowledge transfer from university to industry is a process reframed by the actors and rules of the NIS. The latter determines the efficiency by which the R&D results are created and implemented in industry. It also contains questions concerning the ownership of intellectual property (IP) created in university, institutional autonomy, the existence of venture and risk capital, and other factors of economic environment (Smith & Ho 2005). Not less significant for developing academic entrepreneurship is the adoption of friendly entrepreneurial policies and culture supporting the commercialisation of the R&D results. Rasmussen distinguishes between the following stages in the spin-off process: the preceding conditions, opportunity identification, and pursuing the opportunity and new venture development (2004), thus specifying the interconnected components of the entrepreneurial process throughout the route of knowledge transfer. This permits us to conclude that knowledge transfer is the leading concept connecting both innovation and the entrepreneurial process. The understanding of innovation covers the structure of products, services, production and management of organisation. Innovation is often seen as primarily related to products or processes. Product innovation increases the satisfaction level of a customer, while process innovation increases efficiency and productivity. Innovation is associated with creativity and generation of new ideas, their realisation through invention, R&D in general and development of a new product. (Business... 2002). Technological innovation involves the innovation of both products and production processes (Kurik et al. 2002). Some authors have narrowly confined their concept of innovation to invention and its subsequent application (Ettlie, 2000). Paul Trott uses the notion of technical invention in an analogous definition (1998). A defining criterion for invention is its novelty. The definition of innovation, on the other hand, does not specify the criterion of novelty, nor does it mention where this idea originates from. In such a case any novelty in any particular place or context can be conceived of as innovation. At the same time, technological innovation is used here in its narrow meaning as some authors also include organisational (Clark 2003) and social innovation in that scheme. Most of the authors agree on innovation primarily being a process and not the result of a process (Trott 1998; Dundon 2002 and others).
4
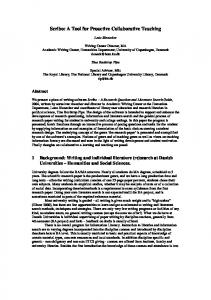
It follows from the statements and writings of many researchers and participants in the innovation process in Estonia (Knowledge-Based… 2002; Köörna & Koljajeva 2000) that the prevailing innovation models are explicitly or implicitly linear. The most prominent among them seems to be the ‘technological push’ model, which originates from the post-WWII period (Trott 1998). The subconscious impact of this model on our thinking has been so profound that we usually take the validity of this simple scheme for granted, as experienced by D. Mahdjoubi in the USA (1997). This way of thinking is also evident in the aforementioned Estonian R&D strategy document. Any innovation deficiencies are thought to be compensated by simply beefing up R&D financing (Knowledge-Based… 2002; Köörna & Koljajeva 2000; etc.). A second-generation linear innovation model, which puts the emphasis on the needs of a customer, the so-called ‘market pull’ model, dates from the 1970s (Trott 1998). The shortcomings of both linear models include inadequate differentiation between the processes from the perspective of technology and non-consideration of the feedback processes both within the given innovation chain and in the marketing and technological environment. Next, the third-generation model is known as the ‘coupling model’ (Rothwell 2002; Trott 1998). It takes into account the iterative process of successful innovation, regardless of whether it was triggered off by market or a technical idea (Ettlie 2000). A similar model is also the interactive innovation model of Rothwell and Zegveld; its further developments have been described by several authors (Trott 1998; Rothwell 2002; Mahdjoubi 1997). Such models represent technological innovation in relation to the needs of society and the development of technical and manufacturing environment. An interactive innovation model improved by the present author is presented in Figure 1. Figure 1. An interactive model of technological innovation (compiled and improved by the author from Rothwell 2002 and Mahdjoubi 1997)
New Need
Marketing&Sales Production Prototype Design&Development Applied Research Basic Research Idea
Technology&Production Capability
Needs of Society & the Marketplace
Market
New Tech
This model is characterised by reciprocal feedback between single processes and also between the processes and the environment. At the same time, it should be noted that these feedback loops not only represent the intermediary processes between an idea and a product,
5
but also with the environment where it all happens. A more differentiated innovation chain is also more consistent with the fact that many profitable improvements require no research at all and development takes place in the engineering and design phase (see shaded arrows in Fig. 1). The fourth-generation integrated innovation model is roughly 10-15 years old. It is characterised by a parallel and integrated development process, which was for the first time applied by Japanese corporations, e.g. Nissan (Rothwell 2002). Everything between a market need and a new product entering the market – R&D, product development/improvement, product design, preparation for manufacturing the product, and getting the suppliers ready – occurs in a successive row of parallel processes. The simultaneous and early involvement of all participants in development significantly increases the efficiency of the implementation process. However, it must be conceded that such acceleration of the development process is not suitable for research-intensive production, where the product cannot be implemented without knowing the final result of R&D, e.g. in pharmacy and biotech. The modern fifth-generation innovation process is based on systems integration and networking, in which the parallel development process has become an integrated process where the technology of technological changes is itself changing (Rothwell 2002). Such a process is characterised by general organisational integration, flexible and flat organisation structures and extensive use of ICT. The innovation model which is oriented towards the external environment (partnerships, investments, acquisitions) is an open one and is characterised by the following features (Chesbrough 2003): 1. Not every ‘best brain’ works for us; we need the influx of knowledge and competence from outside. 2. External R&D create important value; internal R&D is partially necessary for preserving the imported value. 3. It is not necessary to start R&D oneself in order to capitalise it. 4. A better business model is preferable for being able to enter the market first. 5. We gain from the best application of both internal and external ideas. 6. We will profit from letting others use our intellectual property (IP) and we will purchase the IP of others whenever it is advantageous to our business model. Realisation of different models of innovation is to a very great extent dependent on the business environment. A concrete business sector is characterised by its own market inherent to the field and enterprises interrelated with one another inside and beyond the regional and state boundaries. The sectoral system of innovation (SSI) includes boundaries and demand, knowledge and technology, actors and networks, and different institutions. Besides the processes described in Figure 1, sectoral aspects of innovation include the supply chain and non-firm organisations such as universities and other public and private organisations. The attributes of biotechnology are science, networks and divisions of innovative labour. Universities, venture capital and the national health system play the key role in the biotech sector of Europe. Special for European biotech is that university-industry links are less developed than in the USA (Malerba 2001, 2004). The NIS is reasonable as a means of public policy intervention in market conditions, when the market mechanism fails to achieve the formulated objectives as it builds the ability to solve or mitigate the problem (ibid.). There is no final result to decide about the success of EU 6th Framework Program as a measure of the European innovation system (EIS) in biotechnology, for example, funding in research grants secured €2 million for Cyclacel based in Scotland. R&D expenditure made up about 60% (€4,571 million) of revenues in the Biotech sector in 2003 (Endurance… 2003). In the USA this indicator is much less – 45.7%
6
at R&D expenses $17,900 million (Biotechnology…). Ernst & Young see the trends that average losses (8% of the revenues in 2002) of public companies are declining (Endurance… 2003). The regional biotech SSI is closely connected with the (local) NIS, but via supply and market chains the biotech companies extend far across the borders. That means openness of the business sector globally. Public and private actors (universities and biotech companies) seem to be partners in the Estonian NIS. Is the open innovation model inherent in both main partners of the NIS? This raises the question about the correspondence between producing new scientific knowledge at universities and the knowledge needs of the companies in Estonia as well as abroad. 3. Methodology and sample The empirical study had two main purposes: mapping biotech innovation processes (and expenditures) of the public sector and private businesses. Our interviews in SMEs permit us to draw some conclusions about their innovation models and strategies. The public sector is carrying expenses related to the NIS as a whole, incl. regulatory systems, governmental agencies, IP-policy, universities, etc. (Knowledge… 2003). There are several sources of funding the budgets related directly to the biotech sector. The public sources of information are web-pages of the following institutions funding R&D: 1. Estonian Science Foundation – ESF, 2. Estonian Ministry of Education and Research – MoE, 3. Ministry of Economic Affairs and Communications (together with the Foundation Enterprise Estonia) – EE. Where necessary, additional information was asked directly from the government agency. The general statistical indicators of the biotech sector in Estonia are rather similar to its neighbouring countries around the Baltic Sea (Table 1). Table 1. Biotech companies around the Baltic Sea (data of Scanbalt http://www.scanbalt.org/)
State Estonia Latvia Lithuania Finland Sweden Norway Poland Germany Denmark
No of Biotech Companies 25 28 26 120 183 98 60 360 100
No of Biotech Companies per 100,000 inhabit. 1.8 1.2 0.7 2.3 2 2.2 0.16 0.44 1.9
The biotechnology sector is not homogeneous inside, there are several categorisations of the sector (Bergeron & Chan 2004). Hereby we are not using a detailed division of fields by the company. Most of the selected companies are biomedical businesses. Even the biomedical field itself has different sub-sectors. The total number of Estonian biotechnology
7
companies is small enough to determine the sample for study. The foreign-owned companies performing simple production and packaging operations of pharmaceuticals in Estonia were excluded, as they are not knowledge-intensive. Also were excluded very traditional biotechnology industries, for example, yeast production, and for the same reason, other food industries. The rest of the 25 (even more – 32 at the end of 2005, but seven of them just have registered and no data about economic activities in 2004) of registered firms were SMEs, from which 2/3 were related to the biomedical field. The companies that have no sales yet and whose businesses only mediate goods of foreign companies are excluded from the research sample. After excluding Egene Foundation as an exceptional one, 18 research-based biotech SMEs remained (Annex), 1/3 of them being spin-offs of the University of Tartu (Leego 2004). These are mainly (some of them – partly) research-based companies making 42.6 % of total turnover and employing 66.3 % of labour in the biotech sector. For mapping the innovation processes in companies, the annual reports were studied. The data about sales, investments into fixed assets and export markets were available from the reports. The annual report usually does not contain data about expenditure on innovation processes according to Figure 1. Also information about new trends in the business environment and other innovation factors such as IP and knowledge transfer are missing. Therefore, a special questionnaire was designed for mapping managers’ opinion/evaluation and getting the data missing from annual reports: 1. relative share of expenses earmarked for innovation processes in their companies, 2. relations with the public innovation support system and the expediency of the support measures to the companies’ needs, 3. personnel strategy, 4. competences in the field of their own technology, product development, marketing and sales, (strategic) management etc., 5. knowledge transfer, incl. openness of the innovation processes and networking in the fields listed above, 6. IP and patent pool. The data were gathered by half-structured interviewing. This permitted us to get prompt answers to questions and specify concrete information about the company. The interviews and data collection were carried out by two master students2, both managers at biotech companies. The quite comprehensive data gathered by researchers is only partly exhibited here in the paper. 4. Results and Discussion In order to provide a better picture about R&D and other innovation processes in Estonian biotechnology the system of public and private funding was mapped according to the structure of a general model of technological innovation (Figure 1). The results are shown in Figure 1 and 2, and Table 2. The corresponding structure of innovation funding and expenditures by the public and private sectors are shown in Table 3. Besides the above-mentioned funding institutions in Estonia there are the European ones that also finance biotech sector. Three of the interviewed companies have received support from EU projects as a partner. According to the information related by the Foundation Archimedes (Estonian… 2002), the Estonian partners’ share has been less than €100,000 in a 3-year period. All Estonian biotech companies can provisionally be divided into three groups (Talpsep 2005): the first “wave” of companies was established 12-15 years ago, the second 5-
8
9 and the third 1-5 years ago. The findings about the Estonian biotech sector from the interviews with managers: 1. The companies are mostly profitable, but their own capability to invest into development is quite limited; 2. The sales of the Estonian biotech companies split between production and services almost equally; 3. The entrepreneurship and marketing experience in the companies was nearly three times lower (evaluation marks: 1.4-1.6) than research (4.7); 4. Attention to market development in biotech companies (sector) is growing; the number of marketing and sales personnel grew from 21 to 29 in the period 2002-2004; 5. The share of export in sales grew nearly 10% in the period 2002-2004; 6. Only a third of the biotech companies have adopted a growth-oriented strategy; 7. International knowledge transfer and networking is mostly related to research and practically not to commercialisation of research results; 8. Estonian partners are involved in basic and applied research (50-52% of the total R&D-expenses financed by SMEs), foreign partners less (5-7%); own participation of the companies is higher in product development (more than 75%) and product testing (54%). The survey demonstrated the growing market-orientation and moving towards the open innovation model in Estonian biotech companies. The sales of the research-based companies have been growing with the rate 15-20 % per year, reaching more than 600,000 EEK/year per employee in 2004 (Figure 2). Figure 2. Sales, value added and profit of research-based Estonian biotech SME-s, million EEK (the author’s calculations from annual reports)
Sales
Value added
Profit
90,0 80,0 70,0 60,0 50,0 40,0 30,0 20,0 10,0 0,0 2001
2002
2003
2004
The growth of total value added of sample companies has been 42 and 20 % in 2003 and 2004 (author’s calculations from annual reports). Profitability has been between 1 and 8 % of annual sales during the period 2001-2004. The total number of employees of the SMEs in the sample was 135.5 in 2003 and 134 in 2004 (from annual reports). Productivity measured as value added per person employed grew annually 31 and 21 % in the same period (Figure 3), reaching 246,100 EEK/year (appr. 15,700 EUR/year) at the average monthly salary 8,214 EEK (525 EUR) in 2004.
9
Figure 3. Value added and sales per employee in Estonian research-based biotech SMEs, thousand EEK (the author’s calculations from annual reports) 700,0
600,0
500,0
400,0
300,0
200,0
100,0
0,0 2002
2003
2004
Value added per employee Sales per employee
The preliminary evaluation of innovation expenditure structure of the Estonian biotechnology sector (Table 2) shows the prevailing role of public funding, which is about 80% of the total budget (can be even more if we take account all running EU projects). As one can see in Table 3 (Public expenditure) that 72.4 million EEK, i.e. 89% of public R&D expenditures were channelled for university research and only 2.9 million EEK had the aim to support private R&D in 2004. Table 2. Structure of innovation funding of Estonian biotechnology sector (the author’s calculations from public information and managers’ estimations) Expenditure
Public funding Funder 1000EEK Marketing & Sales EE 3206 Production&Infrastructure EE 7795 Prototype EE 0 Design & Development EE 0 Applied research EE 20001 Basic research* MoE&ESF 55205
Private funding % 29.7 72.1 0.0 0.0 84.2 96.7
1000EEK 7605 3011 1038 4475 33765 1862
% 70.3 27.9 100.0 100.0 15.8 3.3
Total 1000EEK 10811 10806 1038 4475 23631 57067
Total per year 86207 79.8 21756 20.2 107963 Note: *Allocations for doctoral studies are included in the biotech research allocation.
% 10.0 10.0 1,0 4.1 22.0 52.8 100.0
This support is not remarkable compared with Australia, Portugal, Switzerland or Hungary, where the share of government-financed business R&D exceeds 70% of the research budget (Lambert… 2003). This also demonstrates a predominance of basic research among other stages of innovation. From Table 3 one can deduce the ratio of gross funding structure of basic and applied research, and product/service development in the Estonian biotechnology sector being 11:5:1. Is this R&D-ratio the best solution for the NIS? In the business sector the ratio is approximately 1:2:2, and together with public support 1:3:2. As Estonian biotech companies are mostly profitable (see Table 2), then the budget according to the ratio 1:3:2 will provide for the existence of the firms in the short run. But is the industrial
10
R&D expenditure sufficient for the development of industry on the level of national strategic goals in the long run – this is the question about the national innovation strategy as a whole. Table. 2. Structure of innovation funding and expenditure in the public and private sectors of biotechnology in Estonia in 2004 (the author’s calculations) Expenditure type
Public fund, Public expenditure, Public to Private fund,Private expend. Private support, 1000EEK, % structure, 1000EEK, % Fund, Public Expendi- Public Support, Expendi- Expenditotal expendit. ture, % support % Fund ture ture, % Marketing & Sales 3206 1400 1.6 1806 2.1 7605 9411 35.5 Production&Infrastruct. 7795 7795 9.0 0 0.0 3011 3011 11.4 Prototype 0 0 0.0 0 0.0 1038 1038 3.9 Design & Development 0 0 0.0 0 0.0 4475 4475 16.9 Applied research 20001 17068 19.8 2933 3.4 3765 6698 25.3 Basic research 55205 55205 64.0 0 0.0 1862 1862 7.0 Total per year
86207
81468
94.5
4739
5.5
21756
26495
100.0
The gross public and private R&D expenditure (86,207,000 EEK) of the biotech sector exceeds the sales (83,144,000 EEK) of research-based SMEs in the sector. This is the first sign of the possible unbalance between the expenditure on research (financed by the Estonian tax-payer) and revenue on the society level. The growth rate of Estonian researchbased biotech companies is of the same scale as that of American companies, but the businesses are much (10-100 times) smaller in size. There are more characteristics differentiating Estonian biotechnology from the industry of Europe and USA: 1. Low level of R&D expenses in Estonian biotech companies: 15.7 % of revenues vs 60 % in Europe and 45.7 % in USA; 2. Profitability of Estonian biotech (small) companies; 3. Low level of venture capital (VC) investment in Estonian biotech; 4. Absence of own national pharmacy industry – one of the main target groups of the sector; 5. Weak connections between university research and companies’ R&D. The first four aspects are discussed here, the fifth one – in the next section. The main reasons of these differences can come from several circumstances related to Estonian economic environment, policy and development so far. Estonian government has practised a liberal economic policy since 1992 and has provided only modest support to the companies of any business sector, incl. biotech. The main survival condition of the companies has been the balance between costs and revenues. Biotechnology is mainly the sector where outcome and results are feeding other bigger industries like pharmacy and healthcare in USA. These markets are too tiny in Estonia for formation of bigger companies without international sales. Low income of Estonian biotech does not ensure enough resources for creation and protection of new IP by SMEs. The short history of Estonian market economy has no examples of own business angels and venture capitalists become experienced in the sector although some of the companies have experience of using VC money. The comparatively modest business environment of the sector does not encourage foreign investors to enter the businesses as it has happened in ICT. The negative example of the slowdown of Estonian Genome Project after an active media campaign from the year 2000 has been retained. The risk and modest business environment of the sector has established the limits on further development. All
11
described factors are creating a closed circle of obstacles, which is very hard to break by SMEs without reasonable public support. 5. Conclusions and further perspectives What might be the best way to commercialise the achievements of science? From two wellknown alternatives, establishing spinouts and sales of licences on new technologies, the former involves the threat of dispersing resources. The result “is that too many spinouts have been created […] and that a large number of them will not succeed in the long term” (Lambert… 2003, p. 60). The quality and reliability of spinouts’ business plans will grow if private risk or/and seed capital is involved at an early stage of a new venture. Here the problem of a small amount of venture capital and angel investors can arise. Successful licence sales have been achieved by universities boasting a high-level research and knowledge transfer system. Some of these universities have no (need for) own incubators and spinout system (Lambert… 2003). Some authors mention more success in knowledge commercialisation by using spin-off processes than by licensing (Rasmussen 2004; etc.). Estonian biotechnology research institutions (for example, the University of Tartu) have very rear licence sales – 2-4 deals per year, and the sums are not remarkable by comparison with the expenses. Biotech research funding by the government is not balanced with the real business needs. These records can refer to two circumstances: 1. A low scientific level of biotech research in the Estonian universities. 2. Ignorance of market demand obstructs creation of new technologies with high commercial value. The first speculation does not seem to be true as research funding and results evaluation are subject of deep quality control by various Estonian and European institutions. This statement is best justified by the fact that since 2000, several Estonian R&D institutions have been given the status of European centres of excellence. The other presumption is more probable as knowledge transfer is not a success indicator for university research. That means the structure of research expenditures in the public sector mostly reflects the success of Estonian biosciences, not the success of biotech as an economy or business sector. A simple linear forecast shows that approximately the same R&D financing structure as in the biotech sector of the U.S.A. in 2003 (45.7% of revenues) can be achieved in Estonia (together with the public sector if the sales continue to grow by 15% yearly) within seven or eight years. Taking into account the non-homogeneous structure inside the sector, as well as the lower relevance of public R&D and the Estonian biotech business, the period can be even longer. The economic efficiency of the biotech sector on society level cannot be achieved in the nearest 10-12 years. Estimated by the author, the R&D ratio 11:5:1 of the Estonian biotech sector describes the situation in even more unsatisfactory terms than the numbers in the strategy document about the national innovation processes altogether. From the previous analysis it is possible to suppose that the described R&D ratio describes clearly unbalanced situation of public R&D and education expenditures on society level. This is a quite normative approach, but it is difficult to establish the right ratio for Estonia. Obviously, the process of balancing R&D and innovation expenses, and expedient state budget is an iterative process, which needs its own strategy, policy and monitoring system on the state level. This presumes creating Estonian own competence centres for innovation and technology transfer research, and sectoral development. The conclusion drawn on the basis of the biotech sector is that there is no simple formula for the success of R&D-based businesses in a small economy.
12
The author’s opinion is that without remodelling the innovation processes and knowledge transfer (in the biotech sector as a whole), success can hardly be expected in the nearest ten years. The challenges for the NIS and SSI to increase the efficiency of spin-off and knowledge transfer processes are as follows: 1. Adapting the public R&D expenditures more to the needs of the existing highpotential businesses at home and abroad; 2. Supporting Estonian companies’ global market capabilities; 3. Promoting entrepreneurial attitude at universities and other research institutions; 4. Supporting contract and collaborative research in remarkable proportions of the R&D expenditure; 5. Creating own structures to study and support spin-off processes in universities; 6. Creating own competence centres for research, monitoring and designing sectoral development and innovation strategies and policies. The presumption for further development of the NIS is growing social capability to absorb new support measures and own sectoral monitoring and strategy research competence. Only own strategy competence of political decisions can assure well-balanced development in knowledge economy. Some steps have been taken towards improvement of the NIS. For example, the Estonian Enterprise has launched its Competence Centres Programme to develop joint R&D of business and research institutions. Some more steps are taken to raise the entrepreneurial spirit of researchers and adapt universities to business demand. For example, the innovation program SPINNO is directed towards creation of “a favourable entrepreneurial environment within the research and development institutions […] and applied higher educational establishments of Estonia” (The SPINNO… 2005). Besides the efforts on the national level, the University of Tartu has launched additional measures to support spin-off and knowledge transfer processes, partly in the field of biotechnology. First, in 2001 the University established the Institute of Technology (IoT), which is responsible for contacts with regional companies, supports the commercialisation of scientific ideas of university faculty members and facilitates technology transfer. The new building opened in August 2005 contains three floors of laboratory space specially equipped for biotech development. Secondly, in 2002 the Faculty of Economics and Business Administration launched a master’s program “Entrepreneurship and Technology Management” targeted at students with experience in business, preferably in different technologies, incl. biotech. The program is oriented to international entrepreneurship training and involves international team of lecturers. Thirdly, at the initiative of the Faculty of Economics and Business Administration, the University of Tartu established an interdisciplinary Centre for Entrepreneurship. The mission of the Centre is to turn the University of Tartu entrepreneurial. The Centre is targeted at developing entrepreneurship and innovation education in the university curricula and facilitating the process of developing an entrepreneurial mindset among its faculty members and students. It is also aimed at the integration of university competencies in the regional and national innovation system. The expectations about the outcome of different programs in the short run (three years) are very high. The results depend above all on the motivation and capability of the academic institutions (system) as a whole to change, i.e. this is the question about organisational and social innovation. Endnotes 1
We can mention, for example, success stories of MicroLink (Closing… 2005) and Skype (Kaio 2005).
13
2
Hereby the author expresses his thanks to Indrek Kask, MSc, and Tiit Talpsep, MSc, for empirical data for the paper.
References Audretsch, A., Thurik, R. and Verheul, I. 2002. Entrepreneurship: Determinants and Policy in a European-U.S. Comparison, Springer, 260 p. Athreye, S. 2004. Agglomeration and growth: A study of Cambridge high-tech cluster. In: Bresnahan, T., Gambardella, A. (Eds.): Building high-tech clusters: Silicon Valley and beyond, Cambridge University Press, pp. 121-159. Bergeron, B. and Chan, P. 2004. Biotech Industry: A Global, Economic, and Financing Overview, John Wiley and Sons. Biotechnology Industry Facts, http://www.bio.org/speeches/pubs/er/statistics.asp 15.05.05. Business. The Ultimate Resource, 2002, Bloombury Publishing Plc, London. Chesbrough, H. W. 2003. “The Era of Open Innovation”, MIT Sloan Management Review, Spring, pp. 35-41. Clark, P. 2003. Organizational Innovations, SAGE Publications, London, Thousand Oaks, New Dehli. Closing of purchase of MicroLink (press release 16.11.2005, http://www.microlink.com/ index.php?-6897285). Dundon, E. 2002. The Seeds of Innovation. Cultivating the Synergy That Fosters New Ideas, AMACOM, New York. Dynamising National Innovation Systems, 2002, OECD. Endurance. The European Biotechnology Report 2003. 10th Anniversary Edition, Ernst&Young. Estonian Enterprise Agency, http://www.eas.ee/). Estonian Participation in the European Union Fifth RDT Framework Programme (FP5), 2002, Archimedes, Tartu. Ettlie, J.E. 2000. Managing Technological Innovation, Wiley&Sons, Inc. Etzkowitz, H. 2004. “The evolution of the entrepreneurial university”, Int. J. Technology and Globalisation, Vol. 1, No. 1, pp. 64-77. Etzkowitz, H., Webster, A., Gebhardt, C. and Terra, B. R. C. 2000. “The future of university of the future: evolution of ivory tower to entrepreneurial paradigm”, Research Policy, 29, pp. 313-330. Kaio, H. 2005. Miljonisadu Eesti kohal: Internetitelefonifirma Skype müügiga teenisid neli eestlasest asutajat igaüks 500 miljonit krooni. – Eesti Ekspress, 03.11.2005. Knowledge-Based Estonia. Estonian R&D Strategy. 2002, Tallinn Knowledge Flows and Knowledge Collectives: Understanding The Role of Science and Technology Policies in Development. 2003, Rockefeller Foundation. Kurik, S., Lumiste, R., Terk, E., Heinlo, A. 2002. Innovation in Estonian Enterprises 19982000, Tallinn. Köörna, A. and Koljajeva, I. 2000. “Introduction to Innovation Theory”, EuroUniversity Series. Economics, Vol. 4/1, 101 p. (in Russian). Lambert Review of Business-University Collaboration. Final Report. 2003. www.lambertreview.org.uk. Leego, M. 2004. Role of Industrial Property in Developing of Marketing Strategy of Spin-Off Company. Master Thesis, Tartu (manuscript, in Estonian, summary in English). Lester, M. 2001. Innovation and Knowledge Management: The Long View. – Creativity and Innovation Management, Vol. 10, No. 3, pp. 165-176.
14
Lundvall, B.-Å. and Tomlinson, M. 2002. International benchmarking as a policy learning tool. In: Rodrigues, M. (Ed), The New Knowledge Economy in Europe. A Strategy for International Competitiveness and Social Cohesion, Edward Elgar, pp. 203-231. Mahdjoubi, D. 1997. The Linear Model of Technological Innovation, http://www.gslis.utexas. edu/~darius/papers.htm, 28.01.04 Malerba, F. 2001. Sectoral Systems of Innovation and Production: Concepts, Analytical Framework and Empirical Evidence, ECIS Conference. Malerba, F. (Ed) 2004. Sectoral Systems of Innovation, Cambridge University Press. Marinova, D. and Phillimore, J. 2003. Models of Innovation. In: Larissa V. Shavinina (Ed). The International Handbook on Innovation, Elsevier Science, pp. 44-53. Moore, G. and Davis, K. 2004. Learning the Silicon Valley. In: Bresnahan, T., Gambardella, A. (Eds.): Building high-tech clusters: Silicon Valley and beyond, Cambridge University Press, pp. 7-39. Raagmaa, G. and Tamm, P. 2004. “Potential Emerging Biomedicluster in a Low Capitalised Country”. European Planning Studies, 12, 7, pp. 943-60. Rasmussen, E. 2004. “The University Spin-off Process”, 13th Nordic Conference on Small Business Research, 16 p. Resilience. Americas Biotechnology Report 2003. Ernst & Young. Rodrigues, M. (Ed.). 2002. The New Knowledge Economy in Europe. A Strategy for International Competitiveness and Social Cohesion, Edward Elgar, pp. 203-231. Rothwell, R. 2002. Towards the Fifth-generation Innovation Process. In: Henry, J., Mayle, D. (Eds), Managing Innovation and Change, 2-nd ed., SAGE Publications, London, pp. 115-135. Scanbalt, http://www.scanbalt.org/ Shane, S. 2005. Academic Entrepreneurship, Edward Elgar. Sheen, M. 2002. Key issues for consideration in the spin-off process. In: Sijde, P., Wirsing, B., Cuyers, R., Ridder, A. (Eds), New concepts for academic entrepreneurship. Proceedings of the USE-it! Conference 2002, Twente University Press, pp. 13-22. Sijde, P. 2002. New Concepts for Academic Entrepreneurship. In: Sijde, P., Wirsing, B., Cuyers, R., Ridder, A. (Eds) New concepts for academic entrepreneurship. Proceedings of the USE-it! Conference 2002, Twente University Press, pp. 5-11. Smith, H. and Ho, K. 2005. “Measuring the Performance of Oxford University, Oxford Brookes University and the Government Laboratories’ Spin-Off Companies”, The Capitalization of Knowledge: cognitive, economic, social & cultural aspects, Turin, Italy, 18-21 May Study of entrepreneurs’ needs in Tartu and South-Estonia, 2003. Final report, Tartu Science Park, http://www.tris.tartu.ee/taustmaterjalid.php 30.05.05. Talpsep, T. (2005), Strategic Archetypes of Estonian Biotechnology Companies. Master Thesis, Tartu (manuscript, in Estonian, summary in English). Trott, P. 1998. Innovation Management & New Product Development, Financial Times. The SPINNO Programme, http://www.eas.ee/ 08.05.05 ANNEX: List of Companies Studied Applied Phenomics, Asper Biotech, Bestenbalt, Biodata, Bioexpert, Celecure, Iasgen, Immunotron, Inbio, Kevelt, Labas, LabExpert, Mikrotaim, Naxo, Prosyntest, Quattromed, Solis Biodyne, Torrosen, Visgenyx
15