and etched with 30 g NH4F-50 cm3 HNO3-20 cm3 Hz0 mixture. Figure 1. ...... -1 3 -08. -10.81. - 7.95. - 6-08. -11-65. - 7.81. - 7.74. 114U. 12 55. 1366. 1477.
NASA Technical Paper 1781
Creep and Residual Mecthanical .Properties,of Cast Superallpysand Oxide DispersionStrengthened Alloys
J. Daniel Whittenberger I
I
..
I
-
.
.
,
.
.
, ,
FEBRUARY 1981
-
,
,
.
. .
TECH LIBRARY KAFB, NU
NASA Technical Paper 1781
CreepandResidualMechanical Properties of Cast Superalloysand Oxide DispersionStrengthenedAlloys
J. Daniel Whittenberger Lewis Research Celrter Clevefcrrrd, Ohio
National Aeronautics and Space Administration
Scientific and Technical Information Branch
1981
Trade names or manufacturer’s names are used in this report for identification only. This usage does not constitutean official endorsement, either expressedor implied, by the National Aeronautics and Space Administration.
ii
Summary A studyofthe creep behavior and residual mechanical properties of two cast superalloys and severalwrought baroxide dispersion strengthened (ODS) alloys reveals that thetensile properties of the nickel-base superalloy B-1900 and cobalt-base superalloy MAR"509 are not degraded by prior elevated temperature creep (at least up to 1 percent) straining between1144 and 1366 K. On the other hand, theroomtemperature tensile propertiesof ODS nickel-base alloys can be reduced by prior creep strains of 0.5 percent or less between 1144 and 1477 K, with the long transverse direction being more susceptible to degradation thanthe longitudinal direction. The room temperaturetensile properties of the ODS iron-base alloyMA-956testedin the longitudinal direction are apparently not degraded by prior creep strains up to about 0.25 percent. While not subject to creep degradation, the ODS alloy MA-956 is unusual in the manner in which it appears to deform at elevated temperature. Basically, MA-956 creep strained in the longitudinal direction appears to undergo slow plastic deformation by the nucleation and slow growth of cracks. On the other hand, the creep behavior oftheODS nickel-base alloysin this study is quite similar tothat of previously studied ODS nickel alloys. In general, the longitudinal direction is strongerthanthe long transverse direction, andcreep is at least partially due to a diffusional creep mechanism as dispersoid-free zones were observed after creep-rupture testing.
Introduction Oxide dispersion strengthened (ODS) nickel- and iron-base alloys are of interest for use in gas turbine engines because of their mechanical strengthand environmental resistance at high homologous temperatures. However, recent studies (refs. 1 to 3) of mechanical properties of several nickel-base ODS alloys have indicated that in some instances prior elevated temperature creep strainingcan severely affect subsequent room temperature tensile properties, particularly ductility. Reductions in ductility areapparently dueto diffusionalcreep, whichcauses formation of dispersoid-free regions around grain boundaries. Such regions are weak in comparison to the adjacent dispersion strengthened material. Additionally,the dispersoid-free regions can act as sites for cavitation and internal oxidation during subsequent creep; these effects further weaken the alloy.
While creep degradation effects have been documented for many nickel-base ODS alloys, the behavior ofiron-base ODS alloys is not clear. A recent study (ref. 4) of mechanical properties of the ODS iron-base sheet alloy MA-956E indicated that room temperature tensile properties are not affected by very small amounts of priorcreep strain (less than 0.2 percent) at 1365 K. Attempts tointroduce greater amounts ofcreep strain were unsuccessful because of the rather unique way in which this alloy deforms under conditions designed to promote slow plastic deformation. It appears that beyond transient creep (about 0.1 percent strain), the alloy does not undergo uniform plastic deformation but rather deforms by the nucleation and slow growth of cracks which eventually lead to tensile overloadconditionsand rapid failure. current In gas turbine engines, most high temperaturepartsaremanufacturedfrom either nickel- or cobalt-base alloys. Degradation of 1033 K stress-rupture and room temperature tensile properties as a result of I-percent creep straining at 1089 to 1366 K has been reported for the wrought nickel-base alloy Udimet700 (ref. 5 ) and the cast nickel-basealloy Inco 713 (ref. 6). Unfortunately, degradationeffects dueto aging and/or creepstraining could not bewell differentiated in these studies. A study by Tien and Gamble (ref. 7) on a simple gamma-prime strengthened nickel-base alloy (Ni-16Cr-5Al-4Ta) revealed the formation of gamma-prime-free regions during creep straining at 1255 K, which are similar to the dispersoid-free regions observed in creep-strained ODS alloys. Similar results were observed by Gibbons (ref. 8) in a study of creep at 1023 to 1123 K in high-purity Ni20Cr-2.5Ti-1.5Al alloy and a commercial Nimonic 80A alloy. In these alloys, the gamma-prime-free regions are likely sites for premature failure during of creep subsequent straining. No studies degradation effects on the properties of cobalt-base superalloys have been reported. The present study was conducted to determine the effects of similar thermal/creep exposures on the residual mechanical propertiesof cast superalloys and advancedwrought ODS alloys. In additionto the required creep testing, tensile properties and, where possible, stress rupture properties were measured in order to more fully characterize the elevated temperature properties of thealloys. The superalloys studied included the cast nickel-base alloy B-1900 and the cast cobalt-base alloy MAR"509; both of these alloys are vane materials in currerit gas turbine engines. While creep degradation effects would not
be expected in MAR"509, as it is basically a solid solution-strengthened alloy, creep degradation effects are possible in the gamma-prime strengthened B-1900. The advanced ODS alloys examined included nickel-base alloys (nominally Ni-16Cr-5A1) from three manufacturers and aniron-base alloy. All ODS alloys evaluated have been under ofthe consideration for or actually used as vanes in gas turbine engines (ref. 9). The results of all the mechanical property testing are presented appendix in A, and typical microstructures of as-received and tested alloys are linear shown in appendix B. The results ofa regression analysis of the stress rupture and steady state creep rate data for thetested alloys are given in appendix C.
Experimental Procedure
percent (265). After rolling, the cans were removed and the alloys were heat treated in air.The heat treatment consisted of placing the materials in a furnace at 1475 K, raising the temperature over a 4-hour period to 1535 K, holding 1 hour at 1535 K, raising the temperature over a 2-hour period to 1590 K, holding 1 hour at 1590 K, lowering the temperatureto 1475 K, and removing fromthe furnace and aircooling. The STCA heats given only this standard heat treatmentare identified by the suffix "S". Heat numbers 265SC and 266SCwere given the standard heat treatment followed by an additional 24-hour anneal at 1115 K to precipitate carbides. In additiontothe above ODs alloys, a limited amountof testing was conductedonthe Special Metals experimental alloy YD-NiCrAl. One piece of heat treated bar stock approximately 3.8 by 1.3 cm in cross section and 28 cm long was obtained from the manufacturer; the nominal composition ofthis alloy is also listed in table I.
Materials Cast bars 16 mm in diameter by 150 mm in length of MAR-M509 and B-1900 were procured from the Metals Division of TRW. Bars of each composition were cast from a single master heat, and each bar was radiographically inspected. All bars containing defects were rejected. The compositions of these two superalloys are shown in table I. Priorto being machined into test specimens, all B-1900 cast bars were heat treated as follows: 4 hours at 1350 K, air cool to room temperature, then 10 hours at 1170 K, and air cool to room temperature. MAR-M509 bars were not heat treated. evaluated included both The ODS alloys commercial and experimentalalloys. The nickel-base alloy MA-757 and iron-base alloy MA-956 were obtained from Huntington Alloys, Inc. Four pieces of hot-finished flat bar, nominally 8 by 3 cm in cross section and 80 cm in length, of each alloy in the heattreated condition were obtained; the compositions are given in table I. Three experimental aluminum-modified Ni-l6Crtype ODS alloys developed under NASA contract (ref. 10) at theStellite Division of Cabot Corporation were also examined. These alloys are designated by STCA plus heat numbers and their compositions are given in table I. Extruded bar stock nominally 6.7 by 2.0 cm in cross section of each alloy composition was obtained from the contractor. In order to develop a low modulus texture, these alloys were thermomechanically processed and heat treated at the LewisResearch Center. The three alloys were canned inmildsteel and rolled parallel tothe extrusion direction at 1310 K in a single pass to reductions of14 percent (262/264 and 266) or 24 2
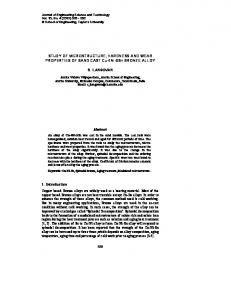
(a) Cross section (half piece) macroetched with Hz02 mixture.
70% HC1-30%
(b) Longitudinal section macroetched with 70% HC1-30% Hz02 mixture.
(c) Crack found in cross section of MA-956. Metallographically polished and etched with 30 g NH4F-50 cm3 HNO3-20 cm3 Hz0 mixture.
-
Figure 1. Structure of as-received filA-956.
The crystallographic textures and grain sizes of all alloys were determined. Both superalloys possessed a very large ascast grain structure with a basically random texture. B-1900 exhibited a minor texture where the [100] direction was parallel to thelength of the ascast bars. Additionally, it was noted that both superalloys contained very few grains with the [l 111 direction parallel to the bar length; the number found was less than expected for a truly “random” orientation. Textures and grain sizes for the ODS alloys are reported in table 11. The grain sizes are arithmetic averages; wide variation aboutthe reported sizes exists. Inparticular, MA-757 and‘ STCA-262/264 exhibited diameters in thelong transverse-short transverse plane as small as 8microns and aslarge as 500 microns. Of the nickel-baseODS alloys, only STCA-266s had a grain aspect ratio greater than 10 in the longitudinal direction. MA-956 possessed an extremely large grain structure as shown in figure 1. The “grains” are cigar-shaped, on the orderof a cm in diameter by tens of cm long in the extrusion direction. Based onthe [lo01 texture, all of the nickel-base ODS alloys have low elastic moduli in the direction parallel to the extrusion axis of the bar; unfortunately neither the long transverse nor short transverse bar directions are low modulus directions. Onthe basis of crystallography, all three bar directions for MA-956 will have high elastic moduli. In general for gas turbine applications, low modulus orientations are desirable (ref. 9) to reduce thermal stresses. Testing Procedure Specimen geometry and machining.-All machining of test bars was done by Metcut Research Associates, Inc. Threaded grip end round bartensiletype specimenswith a 0.635-cm-diameter reduced section were machined from each alloy. While it is normal practice to utilize cast test specimensfor B-1900 and MAR-M509, specimens of both alloys were machined from theascast bars. This procedure was followed so that both the superalloy and ODS alloyspecimenspossessed similar surface finishes. All superalloy specimens and many MA-956 specimens in the longitudinal direction possessed a 5.7cm-long reducedsection. All other specimens had either a 3.2- or 2.5cm-long reduced section. Since the emphasis this ofprogram was on the measurement of residual properties after small amounts of priorcreep strain, specimenswith 5.7cm reduced sections were desired in order to more accurately measure the creep strains. However, due to limitations on the size of the bar stock (particularly for the long transverse direction) and the availability of material, shorter reduced sections
had to be used for many material-test direction combinations.Thereduced sections of all test specimens possessed a 16 rms or better surface finish and were free of defects as determined by dye penetrant inspection. Generally, no difficulties were encountered in machiningthe alloys. However,a large fraction (about 60 percent) of MA-956 specimens with gage length parallel to the long transverse direction had to be discarded because of flaws (as revealed by dye penetrant techniques) in the reduced section. The source of the flaws has not been identified; however, several cracks were found in the as-recieved cross section of MA-956. These cracks start at the bar surfaces and generally follow the “grain” boundaries, as shown in figure 1. Tensile testing.-Room temperature and elevated temperature tensile testing were conducted by Metcut Research Associates, Inc. All tensile testing followed theprocedures outlined in ASTM Specifications E8-69 and E21-70. Elevated temperature tensile testing was conducted in air at 1144, 1255, 1366, and 1477 K except for the STCA alloys and YD-NiCrAI. The latter alloy was not tensile tested because only eleven specimens were available; only 1366 K tensile tests were run for the STCA alloys since the number of specimens for each composition-direction-heat treatment combination was also limited. The measured tensile properties included 0.02 and 0.2 percent yield stresses, ultimate tensile strength, elongation, and reduction in area. Creep testing.-Elevated temperature creep testing was conducted at Metcut Research Associates, Inc., following the procedures outlined in ASTM Specification E139-70. For test temperatures below 1260 K an electromechanical extensometry system (LVDT which measures differential motion of extensometer armsattached to the gage sections) was generally used to determine creep strain. For temperatures exceeding1260 K, an optical creep measuring system (creep cathetometer used in conjunction with platinum strip extensometers attached to the specimens) was used. A few 1255 K creep tests were conducted with the optical extensometry system. Tests were conducted in air at various stress levels at 1144,1255, and 1366 K. MA-757 and MA-956were also tested at 1477 K whereas the STCA alloys and YD-NiCrAl were only tested at 1366 K. Creep tests were conducted to rupture or were terminated after about 150 hours. The creep properties reported include plastic strain on loading; plastic strains after 0.1, 5, 10,25, 50, 100, and 150hours of testing; plastic strain at the end of test; minimum creep rate; and time to rupture if the specimen failed. Unfailed creep specimens were utilized in thedeterminationof residual tensile properties. 3
Residual property testing. “In this study, creep tests were designed to introduce various amounts of strain into each alloy in order to determine if slow plastic deformation at elevated temperatures affects subsequent mechanical properties. Following creep testing specimens were tensile tested at room temperature. Due to thelow ductility of MAR-M509 at room temperature, a few MAR-M509 specimens which had been creep tested at 1255 K were also tensile tested at 1144 K. In all cases, the measured residual tensile properties included 0.02 and 0.2 percent yield stresses, ultimate tensile stress, elongation,and reduction in area.The residual strength properties were calculated on the basis of the original (prior to creep testing) specimen diameter. Residual ductility measurements for specimens with less than 1 percent creep strain were based on the original gage dimensions while ductilities for specimens crept to more than 1 percent strain were based on gage dimensionsafter creep. Thelatter procedure was necessary since specimens with more than 1 percent creep strain had usually necked in the gage section. Most residual property tests were conducted at Metcut Research Associates, Inc., followingtest procedures previously outlined for room temperature and elevated temperature tensile testing. A few interruped creep specimens which possesseddamaged grip ends were tensile tested at the Lewis Research Center; only ultimate tensile strength and ductility data were obtainedfrom these residual property tests. Stress-rupture testing.-Stress-rupture testing of the superalloys and ODS alloys MA-757 and Research MA-956 was conducted at the Lewis Center. Tests weredesigned to produce rupture at times ranging from 10 to about 500 hours at 1144, 1255, and 1366 K; in addition, the two ODS alloys were tested at 1477 K. All testing was conducted in air and followed the procedures outlines in ASTM Specification E139-70. Several MA-757 and MA-956 stress-rupture specimenswhich had not IO00 hours of testing were failed after about unloaded and tensile tested at room temperature in orderto assess the effects oflong-term stresstemperature exposure on mechanical properties. Following mechanicalproperty testing, selected s p e c i m e nwse er ex a m i n ebsdyt a n d a r d metallographic and scanning electron microscopy (SEM) techniques.
0 This study 0 Ref. 11
la) 8-1900.
“T
t I
30
0 This study 0 Ref. 11
e
r
0
0 1300 Temperature, K
Results and Discussion Superalloys A complete tabular presentation of all the 4
1500
(b) MAR-M509.
Figure 2. ture.
- Tensile properties as a function of tempera-
mechanical properties for B-1900 and MAR-M509 determinedin this study isgiven inappendix A. Figure 2 showsthe ultimate tensile strength and elongation data as a function of temperature, and figure 3 shows the stress-rupture data determined at 1255 K for both alloys. In addition, typical literature data (ref. 11) are included. The literature data for B-1900 in these two figures were determinedfor specimens in the assast condition, while the B-1900 specimens in this study had been subjected to a heat treatment. According to reference 1 1 , itis usual practice to employ a heat treatment inorderto improvetherupture life and ductility at 1033 K. Unfortunately, neither the tensile nor stress-rupture data for B-1900 bar reported in reference 11 are for the heat-treated condition. The tensile data in figures 2(a) and (b) indicate that both alloys tested in this program are weaker than typical heats of material. Also, figure 3 illustrates that the rupture strength of MAR-M509 at 1255 K is lessthan thetypical strength while the rupture strength of B-1900 at 1255 K is equivalent to the typical strength levels. The exact reasons why the iested heats of B-1900 and ~
l 100 I :
"F
a:
Slope, -5.88
!
B
I
I
I
I
l l l l l
d
I
I
I
I
IIIII
100 Stress, MPa
-
Figure 3. Rupture life as a function of stress for 8-1900 and M AR-Mm at 1255 K.
1Mx)
MAR"509 are weaker than normal is not known; one possible cause is the use of testspecimens machined from cylindrical castings rather than cast specimens. Comparison of the stress-rupture data in appendix A for B-1900 and MAR-M509 at 1 1 4 4 and 1366 K to literature data reveals that the material behavior at these temperatures is also similar to thatseen at 1255 K. That is, the B-1900 alloy tested in this study possesses stress-rupture strengths equivalent to those previously reported in the literature while the MAR-M509 material isweaker than previously reported strengths. Typical photomicrographs of the as-recieved microstructures and the microstructures of selected stress-rupture specimens are presented in appendix B. Typical creep curves and minimum creep rate data as a function of applied stress for B-1900 and MAR-M509 tested at 1255 K are presented in figures 4 and 5 , respectively. Thedata in these figures demonstrate that creep in these alloys isgenerally well-behaved. The degree of scatter inminimum creep rates for MAR-M509 tested at the two lowest stresses (55.3 and 41.4 MPa) was unusually high (fig. 5 ) ; multiple testing for either alloy at other stresses and temperatures almostalways resulted in minimum creep rates within a factor of two. Creep at 1144 and 1366 K for these two alloys was also well-behaved. Typical residual tensile properties forthe two superalloys after creep testing at 1255 K are presented in figure 6. For purposes of comparison, this figure also contains tensile data from as-received specimens andfrom specimens which had been thermally exposed for 150 hours in air at 1255 K. Knowledge of the effects of thermal exposurealone is important for the superalloys because their complex chemistries can induce precipitation reactions. The residual property data for B-1900 in figure 6(a) indicate that thermal exposure alone at 1255 K slightlydecreases the ultimate tensile strength and elongation. Furthermore, it appears that creep strains up to 1.25 percent do not unduly affect the residual properties. On theotherhand,the test specimenwhichwas creep strained to 1.91 percent did exhibit much lower residual properties. In fact, this specimen failed before the 0.02 percent yield strength was reached. Examination of the fracture surface revealed a large region of oxidewhich formed during creep testing. The clean fracturesurface shown in figure 7(a) is typical for most of the B-1900 specimens;while the nodularfracturesurfacein figure 7(b) is the only example of a partially oxidized superalloy residual property fracture surface seen in this study. A review of the residual property datain appendix A for B-1900 after creep testing at either 1 1 4 4 or 1366 K indicates that creep at these temperatures also 5
I
2.0
-
0 B-1900
1.8
0 MAR-M509
1.6 1.4
Slope,
1.2 74
1.0
.8 I
.6
.4
(a) B-1900.
I 100
I
-8tI
20
40
I
I
I
111111
I
I
I IIIIII o lo 0
Figure 5. - Minimum creep rate as a function of stress for 6-1900 and MAR-MH19 at 1255 K
/ 160 60 14080120 100 Time, h
(b) MAR-M509. Figure 4 - Typical creep curves for B-1Y00and MAR-M509 at1255 K
has little influence beyond thatdueto thermal exposure alone on residual room temperature tensile properties. For example, neither prior creep strains up to about4 percent at 1144 K nor creep strains up to 0.7 percent at 1366 K affected the residual tensile properties. 6
I 1 IIIII 10
Stress,MPa
82.7 MPa
0
I
Examinationof the microstructures of selected residual property specimens did not reveal gammaprime-free regions similar to those reported by Tien and Gamble (ref. 7) or Gibbons (ref. 8). The absence of gamma-prime-free regions is probably due to the much larger grain size (greater than a factor of ten) in the present B-1900 as compared to the alloys discussed in references 7 and 8. Thus it appears that nickel-base alloys with large grain size cast microstructures will not be subject to creep degradation effects. The room temperature residual property data for ""509 after being creep tested for about 150 hours at 1255 K are presented in figure 6(b). This figure also contains tensile properties for as-received specimens and specimens which had beenexposed 150 hours in air at 1255 K. Thermal exposure alone slightly increases the strength and decreases the ductility. Creep strains up to about 1.8 percent do not appearto further reducetensile properties by any significant amount. The SEM fractograph shown in figure 7(c) is typical of both heat treated and creep strained residual property specimens. Because oftherather low roomtemperature ductility of MAR-MSB, residual tensile property tests were also conducted at 1144 K following creep testing for about 150 hours at 1255 K. The 1144 K residual tensile propertydataare shownin figure
0 As received
0 Thermally exposed 150 hours at 1255 K
5 E
0 Creep tested
6p
4
0
0 (a) 0-1900 strained 0.12 percent at 96.5 MPa before tensile testing.
(a) B-1900 tensile tested at room temperature.
0
550 3.0
r-
(b)0-1900strained1.91percentat137.9MPaheforetensile
(b) MAR-Mm tensile tested at room temperature.
350
0
0
testmg.
r
.4
.a 1.2 Prior creep strain, percent
0
1.6
2.0
(c) MAR-M509 tensile tested at 1144 K
Figure 6. - Residual tensile properties as a function of prior creep strain for B-1900 and MAR-MH19 creep tested at 1255 K for approximately 150 hours.
(c) M A R 4 5 0 9 strained 0.82 percent at 68.9 MPa before tensile testing. Figure 7. - SEM fractographs of 9-1900 andMAi”9 residual propertyspecimensstrained in creep at 1255 K forapproximately150hoursand tensile tested at roomtemperature. 7
6(c). At this temperature, prior thermalexposure alone has little effect on thetensile properties. While prior creep up to approximately 1.8 percent strain does not greatly influence the ultimate tensile strength,the tensile elongation was reducedfrom about 20 percent for as-received and thermally exposed to about 13 percent after creep straining. However, the ductility of ascrept specimens is still reasonable. A review of the room temperature residual MAR-M509 in appendix A property data for indicates that 1144 K creep straining has no effect while the effect at 1366 K is not clear. In comparison to as-received properties, thermal exposureat 1144 K increases ultimate tensile strength by 15 percent and reduces the tensile elongation from about 2 percent to about 1 percent; these changesaremaintained even after 6.83 percent creep strain at 1144 K. Compared to as-received properties, thermal exposure at 1366 K has little effect on ultimate tensile strength, while elongation is decreased to about 1 percent. Of the six possible 1366 K residual property 0.08 and 0.31 percent creep specimens,two(with strain) failed whilebeingremoved fromthe test fixtures, one (with 0.09 percent strain) failed before reaching the 0.2 percent yield stress, and the remaining three (0.17, 0.18, and 0.53 percent strain) possessed tensile properties similar to the thermally exposed specimens. Thus, while it appears that creep strains up to at least 0.53 percent can be tolerated at 1366 K, the large number of questionable failures is disquieting. Summary of superalloy behavior. "In summary prior for the superalloys B-1900 and MAR"509, creep at temperatures ranging from1144 to 1366 K to strains on the order of 1 percent generally have little effect on subsequent tensile properties beyond those changes in tensile properties ascribed to thermal exposure alone.
0 Longitudinal
Long transverse
Temperature, K Figure 8. - Tensile properties as function of temperature and test direction for MA-757.
0 Longitudinal
0 Long transverse
Oxide Dispersion Strengthened Alloys A complete tabular presentation of all the mechanical properties determined for theODS alloys is given in appendix A. For simplicity, typical mechanical properties for each ODS alloy are presented in the following sections. MA-757.-Typicalelevated temperature tensile properties are presented in figure 8 and stress-rupture properties at 1366 K in the longitudinal and long transverse bar directions are presented in figure 9. While the elevated temperature tensile strength is not dependent on testing direction, both tensile ductility and rupture strengths are directionally dependent. In rupture testing, the longitudinal direction was always stronger than the long transverse direction, A). irrespective of test temperature (appendix 8
u 10
100
Stress, MPa
- Rupture life as a function of stress for MA-757 at 1% K.
Figure 9.
Photomicrographsof representative stress-rupture specimens are presented in appendix B. Of particular importance are the presence of dispersoid-free regions, extensive grain boundary cavitation and cracking, and massive internal oxidation (which leads to extended stress-rupture life and high rupture ductilities). All of these effects reduce the usefulness of stress-rupture data for design purposes (ref. 1). Typical 1366 K creep curves and minimum creep rates as a function of stress are shown in figures 10 and 11, respectively. As is the case for most ODS bar alloys, the longitudinal direction is stronger than the long transverse direction. Also it should be noted that very small changes instress (about 3.5 MPa) can produce very large changes in creep strain. Thus it proved difficult to induce moderate amounts creep of strain (from about 0.4 to about 1.0 percent) under the testing conditions (strain after 150 h of testing) used in this study. .8
.7
. 2 MPa
.6
The creep data in appendix A for MA-757 reveals that creep behavior at 1144,1255, and 1477 K is similar to that at1366 K; the longitudinal direction is stronger than the long transverse direction and small changes in stress can result in large changes in creep strain. Residual tensile properties after prior elevated temperature creep straining are presented in figure 12. Previous residual property studies of ODS alloys (refs. 2 and3) have indicated that tensile ductility and fractography arethemost sensitive indicators of creep damage; in general, rather severe creep damage (very large scale dispersoid-free bands, cavitation, and internal oxidation) musttake place before significant changes in residual strengths are noted. The residual mechanical property data in figure 12(a) indicate that both the ultimate tensile strength and ductility in the longitudinal direction can be affected by prior creep. In general, the ultimate tensile strengths are not greatly reduced (maximum reduction observed was 25 percent) by creep strains up to about 0.55 percent. Thebehaviorofthe residual ductility shownin figure 12(a)is erratic; both increases and decreases as compared to asreceived ductility are observed. Thus, while prior
.5 .4
.3 .2
-
1
.-c'm
44.8 MPa /
41.4 MPa
10-7
t
I
(a)direction. Longitudinal
g ct L
5 1.6
1 20.7 M Pa
& 1.4
1.2
.2 *
0
l
I
160
180
- Typical creep curves for MA-757 at 1366
K.
4
20
Slope,
1
40
60
80
l
100 140120
Time, h
(bl Long transverse direction. Figure la
100
10-10
1
10 Stress,MPa
Figure 11. - Minimum creep rate as a function of stress for MA-757 at 1366 K. 9
0 As-received A 1144 K
0
16110
1255 K 1366 K 1477 K
0
0
1200
I I
w
c
al
z W
n
't
0-0
oo
0 0
OE0
0
*Am A
A
0
0 .1
OA 0 0
0
I
I
O
A
4
0
I
I
.I
.2 .3 .4 (a) Longitudinal direction.
ao
.6
.5
(a) Longitudinal specimen strained 0.32 percent at 68.9 MPa before tensile testing.
0
.2 .3 .4 Prior creep strain, percent
.5
v.75
.85
(b) Long transverse direction.
figure 12 - Residual r w m temperature tensile properties as a function of prior creep strain for MA-757 strained at 1144to 1477 K for approximately 150 hours.
creep straining apparently does not produce creep degradation every in instance, the mechanical property data illustrate that creep degradation can occur in the longitudinal direction. Fractographs of residual property specimens (fig. 13) and microstructures of stress-rupture tested specimens (appendix B) indicate that microstructural changes (refs. 2 and 3) which lead to degradation of mechanical properties are occurring during creep. In particular, pock-marked fracture surfaces are considered indicative of damage associated with the 10
(b) Long transverse specimen strained 0.25 percent at 34.5 MPa before tensile testing.
-
Figure 13. SEM fractographs of MA-757 residual property specimens strained in creep at 1255 K for approximately 150 hours and tensile tested at room temperature.
formation of weakened, dispersoid-free regions duringprior creep straining. Thus,the eventual properties in the reduction of mechanical longitudinal direction after long term elevated temperature creep straining shouId be expected.
The residual mechanical property data in figure 12(b) also indicate that creep damage has occurred for tests conducted in the long transverse direction. In general, for prior creep exposures between 1144 and 1366 K, creep damage occurs atabout 0.1 percent strain while prior creep at 1477 K to about 0.44 percent strain does not appear to affect residual properties. Fractography of residual property specimens which had previously been creep strained at 1255 K (fig. 13) and metallography of failed stressrupture specimens tested at 1 1 4 4 and 1477 K (appendix B) reveal microstructural features intimately connected with creep degradation. MA-956.-0f the alloys tested in this program, MA-956 is by far the most unusual and interesting. Because of this, the majorityof the MA-956 data on longitudinal properties will be graphically presented. In general, data for MA-956 in the long transverse direction will be only summarily presented. Only a fewtestsin the long transverse direction were conducted due to difficulties in obtainingsound specimens. All mechanical property data obtained for MA-956 are presented in appendix A. Typical elevated temperature tensile properties for MA-956 tested in the longitudinal and long transverse bar directions are shown in figure 14. In general, the longitudinal direction was stronger and more ductile than the long transverse direction. The strength data in the long transverse direction at 1 1 4 4 and 1255 K exhibited considerable scatter, possibly due to internal defects (see fig. 1). Except at room temperature, the strength and ductility results in the longitudinal direction were consistent. At room temperature the long transverse specimen and one longitudinal specimen failed by cleavage at low elongations; theother longitudinal specimen also failed by cleavage but only after considerable deformation. The stress-rupture characteristics of MA-956 testedin the longitudinal direction are shown in figure 15. These data reveal thatthe stresses to produce rupture in times ranging from 0.1 to greater than 10oO hours for temperatures ranging from 1144 to 1477 K liein a band about 30 MPa in width. Rupture life is thus highly dependent on stress. Typical creep curves for longitudinal MA-956 tested at 1255 K are shown in figure 16 and steady state creep rate data as a function of stress and temperature are presented in figure 17. Examination of the creepcurves in figure 16 illustrates an important characteristic concerning creep failure of MA-956. When failure occurs, there is almost an instantaneous transition from an apparently slowly deforming specimen to a failed specimen. The process or processeswhich control the final few moments of life must be very rapid and allow
15
-
LC, 0
10
5
0
598
1100 0 O Temperature, K L
1300
1500 ,
Figure 14 - Tensile properties as a function of temperature and test direction for MA-9%.
considerable deformation to occur as indicated by the final elongation and reduction-in-area data for the failed specimens (appendix A). Except for the short life tests (failure times less than 10 h), MA-956 does not exhibit third stage creep. This behavior was noted at all four test temperatures. A macrograph of a typical failed MA-956 specimen is shown in figure 18. As can be seen, considerable localized deformation (reduction in area) has occurred. Note, however, that theobserved deformation has apparently taken place only on one side of the testspecimenwhile the other side has remained essentially parallel to the stress axis. Typical SEM fractographs of the fracture surface of the same MA-956 specimen shown in figure 18 are presented in figure 19. Figure 19(a) shows a flat crack-like surface which is perpendicular tothe applied stress, and figure 19(b) illustrates a region, ahead of the crack-like surface, which iscomposed of small flatareasonmanydifferent levels.Similar fracture surfaces have beenseen on specimens of MA-956E after stress-rupture testing at 1365 K (ref. 4) and on MA-956 bar after slow tension testing at 1366 K (ref. 12). The latter work presents evidence that the flatregions found on thefracture surfaces of 11
...
100-
9590m
2In
Y c 2.
0 0 0 0
80CI
0
0
0
8 8
75-
0
8
0
0 0
0
0
0
7cO A A
6C-
A
A
0 1144K 0 1255K 0 1366 K
A A
I
I
I
I
I
I
Ill1
0" 0 0"
A
65-
1
0
0
55 10-2
0
0
I-
In
0"
0
85-
I
~
~
~
~ loZ
~l f 7 V
Id
I
I 1 1 1 1 1
l
ld
RUPTURE LIFE, h Figure 15. - Rupture life as a function of stress in longitudinal direction for MA-956 at 1144to 1477 K.
t
I
c al
Y a l
.4
n
I/
2 1 . 0 MPa
82.7 M P
c._ m L
-
I
Y)
-
71.6 MPa
I"~"'"'Y ~
0
40
74 1 MDa
,
80
120
70.7 MPa '
160
Time, h Figure 16. - Typical creep curves in longitudinal direction for MA-956 at 1255 K
MA-956 are indeed the result of slow growth of a crack and that the multilevelregion aheadofthe crack occurs when the running crack is undergoing the transformation from slow to fast growth. Crack growth processes apparently take place in MA-956 until the remaining load-bearing area is reduced to the point where fast ductile deformation can occur. Since the running crack starts at or near the surface of the test specimen and slowly grows until overload conditions occur, metallographic sections parallel to the stress axis should reveal a structure which has a deformed and undeformed appearance on opposite sides of the specimen. This is consistent with the structure shown in figure 18. Because of the slow crack growth mechanism by whichMA-956 apparently undergoes slow plastic 12
deformation,themeasurementand reporting of minimum creep rates may not be meaningful. However, for completeness, these data were characterized and are graphically presented in figure 17. This figure contains approximateminimum creep rate data for two tests which underwent no deformation after about 150 hours of testing (points plotted at rate = 10-lo s-l and five tests which underwent considerable deformation in a short time. The minimum creep rate data in figure 17 are very similar to the stress-rupture data in figure 15 in that both deformation rates and rupture lives are highly dependent on stress. The creep data in figure 17 also illustrate the very strongdependency of creep rateon stress, where small changes in stress produce dramatic differences in behavior. Although many attempts were made, it proved impossible to induce moderate amounts of creep strain intoMA-956 specimens. There were only 12 unfailed creep specimens out of a total 34 of creep tests; of these specimens, one had0.25 percent strain, two had about 0.15 percent strain, and the remaining had 0.1 percent or less strain. Except for the shortlife tests, very little creep deformation was observed. The maximum amount of creep strain seen in any test (prior totherapidfailure processes, if fajlure occurred) is shown in figure 16 by the test conducted at 81 MPa. Typical room temperature residual tensile properties of MA-956 in the longitudinal direction are presented in figure 20. These data indicate that for prior elevated temperature creep strains of less than 0.25 percent, MA-956is not subject to creep degradation.Attempts to introduce larger creep strains were not successful. No evidence of creep damage was seen during SEM examination of selected fracture surfaces. Only cleavage type
\
0
0 1144K 0 1255K 0 1366K A 1477 K
0
"*t
0
0
O O 0 A
65
6ok
A
A
A
A A
A
A
A
I 10-8
0
0
I
I
I
IIIJ
I
I
I
I
I
IIII
I
I
I
I
I
I l l 1
10-7
10-9
I
I
I
I
I
I l l 1
I
I
I
10-6
I
I Ill] 10-5
MINIMUM CREEPRATE, s-l Figure 17. - Minimum creep rate at a function of stress for MA-956 tested in longitudinal direction at 1144 to 1477 K.
-
Figure 18. Macrograph of failure region of MA-956 rupture tested in longitudinal direction for 143.1 hoursat72.4MPaand 1366 K.
features wereseen onthefracturesurfaceof asreceived room temperature test specimens, whereas regions of ductile failure as well as cleavage failure wereseen on the residual property test specimens. Typical examples of residual fracture surfaces are presented in figure 21. In summary, the elevated temperature deformation characteristics of MA-956 tested in the longitudinal direction are unusual. Under test conditions designed to promoteslow plastic flow, the alloy apparently deforms by the growth of cracks. This process is rather insensitive to test temperature but extremely sensitive to stress. With regard to residual properties, MA-956 is not subject to creep degradation in the longitudinal direction at least up to prior creep strains on the order of 0.25 percent.
STCA alloys.-Only room temperature and 1366 K tensile testing, 1366 K creep testing, and room temperature residual property testing were conducted on STCA alloys; all test results are tabulated in appendix A. The 1366 K tensile data (appendix A) reveal that the tensile strength of STCA alloys is independent of chemistry and test direction. While tensile elongation appears to vary with chemistry, the reduction-in-area ductility data do not indicate significant differences based on chemistry. Both ductility indicators reveal, however,thatthe longitudinal direction is more ductile than the long transverse direction at 1366 K. Typical creep curves and minimum creep rates as a function of stress, testing direction, and heat treatment are presented in figures 22 and 23, respectively, for STCA-266tested at 1366 K. This alloy contains about 1.2 weight percent Ta in addition to nominally 16Cr and 4.5A1 (table I); STCA-266SC was given a carbide precipitation heat treatment following the standardheat treatment. The creep rate data in figure 23 indicate that the alloy in the longitudinal direction is more creep resistant than in the long transverse direction; additionally, it appears that the carbide heat treatment lowers the creep strength of heat STCA-266 in the long transverse direction. Asis the case for most ODS alloys, small changes in stress canproduce large changes in creep strain. Thus, it proved difficult to inducemoderate creep strains inspecimens for residual property testing. Whereas the creep behavior in figures 22 and 23 is typical, discrepancies in behavior were observed; forexample, the carbide precipitation heat treatment lowered the creep strength of STCA-266 but did notaffect the strength of STCA-265 (appendix A). Also in the longitudinal 13
(a) Fracture surface in crack-like region.
the Ta-rich alloy. The reasons for this behavior are notknown.Photomicrographsof representative failed creep specimens are presented in appendix B. A wstahcsaefsM oerA - 7 5t7h,e s e photomicrographs reveal the presence of extensive grain boundary cavitation and cracking. Dispersoidfree regions and massive internal oxidation were also noted on some specimens. Room temperature residual tensile properties for STCA alloys after 1366 K creep straining are compared to as-received properties in figure 24. The as-received room temperature strength properties are . essentially dependentontestdirectionand independent of chemistry. The ultimate tensile strengths areabout 1300 and 1100 MPa in the longitudinal and long transverse directions, respectively, andboth testing directions and all chemistries exhibit from 5 to 6 percent elongation. In the longitudinal test direction, prior creep straining upto 0.11 percent had no effect on residual properties except for theSTCA-265SC specimen precrept 0.09 percent (fig. 24(a)); SEM examination of this specimenrevealed an internal defect onthe fracturesurface which producedthepremature failure. Prior creep exposure involving creep strains between0.13 and 0.55 percent in the longitudinal
20 L AS RECEIVED 1144 1255 1366 1477
0 0
0
0
(b) Fracture surface ahead of crack.
-
Figure 19. SEM fractrographs of MA-956 specimen ruptured tested in longitudinal direction for 943.1 hours at 72.4 MPa and 1366 K.
10
0 5
0
testing direction the Ta-free alloy (STCA-262/264S) and theTa-rich alloy (STCA-265s) are stronger than the intermediate Ta level alloy (STCA-266s); however in the long transverse direction the Ta-free and theintermediate level Ta alloys are stronger than 14
K K K K
1
1
0
I .2 PRIOR CREEP STRAIN, percent
I .4
Figure 20. - Residual r w r n temperature tensile properties as a function of prior creep strain for MA-956 strained in longitudinal direction at 1144 to 1477 K.
- 4 r 62.1 MPa 58.6 MPa
65.5 MPa
34.5 MPa /34-5MPa
/
/31.031.0 MPa
cVI
24. 1 20.7 MPa
CL
m.2
m L V
(a) Strained 0.08 percent at 74.1 MPa before tensile testing. Ductile plus cleavage fracture.
(b) STCA-266s in long transverse direction.
0
20 (C)
40
60
100 Time, h
80
120
140 180160
STCA-266SC in long transverse direction.
Figure 22 - Typical creep curves for STCA-2665 and STCA266SC at 1366 K
(b) Strained 0.15 percent at 77.6 MPa before tensile testing. Cleavage fracture.
-
Figure 21. SEM fractographs of longitudinal MA-956 residual property specimens strained in creep for approximately 150 hours at 1255 K and tensile tested at room temperature.
direction lowered the tensile strength about 15 percent to nominally lo00 MPa, whereas the tensile elongation was progressively lowered from 6 percent to about 1 percent as theprior creep strain increased.
The residual property data in figure 24(b) for the long transverse direction indicate that prior creep strain up to about0.1 percent has no effect on room temperature properties. However, at greater than 0.1 percent strain the residual tensile properties are severely degraded. In many cases tensile failure occurred before the 0.2 percent offset yield strength was reached. Two typical SEM fractographs illustrating creep-damaged areas on STCA residual property fracture surfaces are presented in figure 25. YD-NiCrAI.-As only a few YD-NiCrAl specimenswere available for testing, only 1366 K creep and residual property tests were conducted. 1s
As received Creep
exposed
0 STCA-266S, longitudinal 0 STCA-2665, long transverse A STCA-266SC, long transverse
0
0
o
I
0 A
A
1400
I
0 0
(a) Longitudinal direction.
1
10-10 1
10
Stress, MPa
100
1000
I
0
Figure 23. -Minimum creep rate as a function of stress for STCA-266s and STCA-266SC at 1356 K
Typical creep curves are shownin figure 26 and minimum creep rates as a function of stress are shown in figure 27. This alloy was reasonably ductile in creep because strains up to about0.7 percent after about 150 hours of testing could be readily induced (fig. 26). Figure 27 also indicates that creep rates in YD-NiCrAl are highly dependent on stress. Figure 28 presents residual tensile property data for YD-NiCrAI after creep straining at 1366 K. Unfortunately, as-received tensile properties are not available forcomparison;however, the residual property data indicate that YD-NiCrAl is not severely affected by prior creep straining in the longitudinal direction. In general, the ductility is good (8 percent elongation or greater) and tensile strength ishigh (about 1050 MPa) even after 0.72 percent prior creep strain. While the residual mechanical properties are excellent in terms of resistance to creep degradation, SEM fractography (fig. 29) of residual property specimens did reveal areas whichwere creep-damaged. Thus, long term application under slow strain rate conditions might 16
7
A
A
400
200
0 c
c W
O A
I
u
'r0
L
m
CL
e-
.-
0
I
m
m c
0
2
0
1
W
Prior creep strain, percent (b) Long transverse direction.
-
Figure 24. Residual rmm temperature tensile properties as a function of prior creep strain for STCA alloys strained at 1366 K for approximately 150 hours.
.7 r .6
L
.1
IV/
48.3 MPa /
44.8 MPa 41.4 hc.I nra
I
0
I 40
20
I
I 60
80
I I I 100 120 140
I 160
I 180
Time, h
-
Figure 26. Typical creep curves for YD-NiCrAI in longitudinal direction at 1366 K
(a) STCA-265SC longitudinal specimen strained 0.32 percent at 68.9 MPa before tensile testing.
(b) STCA-266s long transverse specimen strained 0.10 percent at 20.7 MPa before tensile testing.
-
Figure 25. SEM fractographs of STCA residual property specimens strained in creep for approximately 150 hours at 1366 K and tensile tested at room temperature.
lead to severe degradation of subsequent tensile properties in YD-NiCrAl as damaged regions increase in size during creep. Summary and comparison of ODs alloy behavior.-All of the nickel-base ODS alloys examined in this study revealedsigns of creep
h
1o-1ol0
100
Stress, MPa
-
Figure 27. Minimum creep rate as a function of stress for YD-NiCrAI tested in longitudinal direction at 1366 K
degradation. The longitudinal bar direction is more resistant to degradation than the long transverse bar direction. In the longitudinal direction, creep strains uptoabout 0.5 percent in 150 hoursdonot significantly reduce residual room temperature 17
0
.2 .4 .6 Prior creep strain, percent
.8
-
(a) Strained 0.07 percent at 41.4 MPa before tensile testing.
Figure 28. Residual room temperature tensile properties as a function of prior creep strain for YD-NiCrAI strained in longitudinal direction at 1366 K for approximately 150 hours.
tensile properties. However, the observation of microstructural artifacts thought to be connected to creep degradation on longitudinal test specimens indicates that severe damage is possible for very long time creep exposures even if they involve only small strains. In the long transverse direction, prior creep exposures involving as little as 0.1 percent strain can produce significant reduction in residual properties. Overall, the residual property behavior ofnickel-base ODS alloys in this study is similar to thatof MA-754 (ref. 3), where the degree of creep damage was dependent on testing direction as well as the amount of prior creep strain. Finally, on the basis of MA-757 testing and previous results for TD-NiCr (ref 2), it appears that creep degradation will occur in practically allnickel-base ODS alloys when creep strained between 1144 and 1477 K. The ODS iron-base alloy MA-956 is apparently not subject to creep degradation for prior creep strains up to 0.25 percent in the longitudinal bar direction. It should be noted, however, that it was not possible to induce larger creep strains into this alloy because oftheunusualmanner in which MA-956 deforms at elevated temperatures. With regards to long term elevated temperature creep strength of ODS alloys, the longitudinal bar the long direction was always stronger than transverse bar direction. Comparisonofthelong
(b) Strained
0.66
percent at 48.3 MPa before tensile testing.
-
Figure 29. SEM fractographs of YDNiCrAl residual property specimens strained in creep at 1366 K for approximately 150 hours and tensile tested at room temperature.
term creep strength at 1366 K in the longitudinal direction of iron-base MA-956 (fig. 17) to those of nickel-base alloys (figs. 9, 23, and 27) reveals that MA-956 is more creep resistant than the nickel-base alloys. The data in appendix A reveal that the long term creep strength of MA-757 at 1 1 4 4 K in the
longitudinal direction is greater than that of MA-956;however,between1255 and 1477 K the opposite behavior is observed, with MA-956 being the stronger alloy.
Conclusions The following conclusions are drawnfrom this study of creep and residual mechanical properties of high temperature superalloys and advanced ODS alloys: 1. The tensile properties of thelarge grain size cast superalloys B-1900 (nickel-base) and MAR-509 (cobalt-base) are notdegraded by creep at least up to about one percent strain at 1144 to 1366 K. 2. The room temperature properties of the wrought Ni-Cr-Al ODS alloys MA-757, STCA, and
YD-NiCrAl can be degraded by prior creep strains of 0.5 percent or less at 1144 to 1477 K. The
longitudinal direction is less susceptible to creep damage than the long transverse direction. 3. The residual room temperature tensile properties of the iron-base ODS alloy MA-956 are apparently not degraded by prior creep straining up to 0.25 percent at 1144 to 1477 K. However, MA-956 exhibits unusual creep behavior which apparently involves nucleation and slow growth of cracks.
Lewis Research Center National Aeronautics and Space Administration Cleveland, Ohio, August 21, 1980
19
Appendix A Mechanical Properties of Test Alloys .. .
This appendix presentsa tabular SU&~WY of dl mechanical property data generated during this study. Each alloy and its pertinent tables are listed here: B-1900 MAR-M509 MA-757 MA-956 STCA YD-NiCrAI
20
Tables III(a) to (d) Tables IV (a) to (e) Tables V (a) to (d) Tables VI (a) to (d) Tables VI1 (a) to (c) Tables VI11 (a) and (b)
Appendix B Microstructure of Several Tested Alloys The following appendix contains typical photomicrographs of the alloys which were e x t e n s i v e lsyt u d i e dW. h e rme e a n i n g f u l , photomicrographs of bothas-received and test alloys are presented. Figure 30 contains photomicrographs of asreceived and stress-rupture tested B-1900. As can be mosteasilyseenin figure 30(a), the as-received B-1900 contains porosity due to thecasting process.
(a) As-received.
Figure 30(b) shows a typicalmicrostructure for long term B-1900 stress-rupture specimens. Comparison of figures 30(a) and (b) indicates that the gammaprimephasegrowsduring rupture testing. Also figure 30(b) showsoxidepenetrationalonggrain boundaries. Both specimens were etched with a mixed acid solution containing 33 parts by volume HCl, 33 parts acetic acid, 33 parts HNO3, and 1 part HF.
As-received.
(a) s
(b) Stress rupture tested for 624.6 hours at 117.1 MPa and 1255 K.
-
Figure 30. Microstructures of E-1900.
(b) Stress rupture tested for 606.2 hours at 68.9 MPa and 1255 K.
-
Figure 31. Microstructures of MAR"509. 21
The microstructure of as-received MAR-M509 is shown in figure 31(a)where theChinese script pattern of the carbides can be easily seen. A typical microstructure of longtime stress-rupture tested MAR-M509 is presented in figure 31(b). Carbides and oxide penetration along grain boundaries are evident in this figure. All MAR-M509 specimens were etched with the mixed acid solution. Examples of the microstructure found in stressrupture tested MA-757 are shown in figure 32. Extensive intergranularcracking is evident in specimens tested at 1144 K, while intergranular void formation isseen in specimens tested at 1477 K.
(a) Longitudinal specimen stress rupture tested 130.9 MPa and 1144 K.
for 160.8 hours at
(c) Longitudinal specimen stress rupture tested 200.6 hours at 31.0 MPa and 1477 K.
-
Dispersoid-free zones are also visible after testing at both temperatures. These microstructures are similar to those observed in other nickel-base ODS alloys (refs. 1 to 3). All specimens were electrolytically stain etched with a chromic acid mixture (100 ml H 2 0 , 10 ml H2SO4, and 2 g chromic acid). Finally, typical examples of the microstructure of failed STCA creep test specimens are shown infigure 33. The microstructures shown are similar to those presented for MA-757, and contain dispersoid-free bands, grain boundary cracking and cavitation, and massive internal oxide. All alloys were electrolytically etched with a buffered aquaregia solution containing 33 percent glywrine by volume.
(D) Long transverse specimen stress rupture tested for 110.4 hours at 82.1 MPa and 1144 K.
(d) Long transverse specimen stress rupture tested tor 124.1 hours at 3.4 MPa and 1411 K.
Figure 32. Microstructures of MA-757.
22
(a) Longitudinal specimen of STCA-265SC creep rupture tested fol 116.2 hours at 72.4 MPa and 1366 K.
(c) Long transverse specimen of STCA-265s creep rupture tested 165.4 hours at 19.0 MPa and 1366 K. Figure 33.
(b) Longitudinal specimen of STCA-266s creep rupture tested for
146.6 hours at 58.6 MPa and 1366 K.
for
(d) Long transverse specimen of STCA 262/264S creep tested for 166.5 hours at. 31.0 MPa and 1366 K.
- Microstructures of STCA alloys.
Appendix C Regression Analysis of Stress Rupture and Creep Data As part of this study, a considerable amount of creep and stress-rupture data were generated.In order to develop equations which could be used for prediction and comparisonto theoretical models, the time to rupture and steady statecreep rate data from appendix A were fitted to thestandard semiempirical stress-temperature equationsby means of a computerized linear regression program. The equations used in this work are:
instances, particularly for the ODS alloys, editing of the data was necessary to develop reasonable equations. The pertinent regression equations as well as the regression coefficient,R**2,for each alloy system are presented in tables IX to XIX. Applicability of equations (C-2) to determine a meaningfulactivation energy(s) was based on 95 percent confidencelimitsonthestressexponents calculated from equations (C-1). In this work only stress-temperature fitsof the data obtained at 1144 K and progressively higher temperatures were determined. Each alloy and its pertinent tables are listed here:
B-1900 In t r )
=B+
Q +n(lns) RT
where tr is the time to rupture in hours, eis the steady state creep rate in reciprocal seconds, A and B are constants, n is astressexponent, s is theapplied stress in MPa, Q is an activation energy in joules/gmol-K, R is the gas constant(8.314 joules/g-mol-K), and Tis the absolute temperature in Kelvin. Whereas equations (C-1) and (C-2) can be independently applied to the experimental data, the activation energy(s) determined by equation (C-2) is (are) only theoretically meaningful when the stress exponentscalculatedat.differenttemperatures via equation (C-1) are equal. Due to the limited testing at each temperature, it would be fortuitous if the stress exponents each at temperature were determined to be exactly equal. However confidence limits for the stress exponents canbe calculated and examined to see if a common overlap region exists. When anoverlap exists andthe stress exponents determinedfromequation (C-2) fall within this overlap, a statistically meaningful activation energy has been calculated, and it can be used in theoretical models of deformation. If these two conditions are not met, the “activation energy” and “stress exponent” data reported in table IX to XIX are simply coefficients which best describe the behavior of the material in question. Where possible all the experimentaldata were used in the regression analysis; however, in some 24
MAR-M509 MA-757 MA-956 STCA YD-NiCrAl
Table IX Table X Tables XI to XIV Tables XV and XVI Tables XVII and XVIII Table XIX
B-1900 Thedata presented in table XI indicatesthat equations (C-1) well describe the rupture and creep dataat eachtesttemperature. While the stresstemperaturefitsaregood forthe 1144-1255 K interval, fits based on equations (C-2) for the larger temperatureintervals are notasgood. Only the activation energies calculatedforthe 1144-1255 K interval satisfy thepreviously stated requirementson stress exponents, and both the activation energy for creep and activation energy for rupture are higher thanthatfor diffusion in nickel or nickel-base superalloys (Q =280kJ/g-mol-K, ref. 13). Since the stress exponents calculated from common overlap regions equations (C-1) have (-5.24 to -6.00 for rupture data and-4.63 to 6.28 for creep data), is it possible that the stress dependency is independent of temperature. Thus, it appearsthattheinabilityofequations (C-2) to successfully predict behavior the atlarger temperatureintervals is due to changes in the thermally activated processes. For example the amount,distribution, size ana shape of gammaprime are functions of time at temperature, andsuch changes in gamma-prime will most certainly affect deformation processes. While such reasoningis appealing, it cannot be proven because ofthe statistical correlation between stress and
temperature. Thisgorrelation is the result ofthe decreasing strength with increasing temperature and the limitations placed on testing (e.g., time to rupture less than 500 and measureable creep strain after150 h of testing). For B-1900 the following equations relate the stresses for creep testing se and the stresses for rupture testing sr to the absolute temperature:
lnse= -5.24+In se= - 5.52-
12 427 T 13 106
T
(R**2=0.92)
(R* ‘2 =0.92)
Because ofthe high correlation, itis difficult to separate effects due solely to temperature orstress. MAR-M509 Only the activation energy for rupture in table X calculated from the 1144-1255 K temperature interval is statistically sound. This activation energy (510.6 kJ) compares unfavorably with the activation energy measured for diffusion in Co-Ni alloys containing 10 to 25 percent nickel (Q = 250 kJ/g-molK, ref. 14). MA-757 Some editing ofthe raw data was required to produce reasonable fits. The results for both the unedited and edited data are shown in tables IX to XIV. Only the activation energies for rupture and creep for testing in the longitudinal direction (590 kJ/g-mol-K) and the activation energy for rupture in the long transverse direction (518 kJ/g-mol-K) calculated from the 1144-1255 K interval are statistically significant for theoretical purposes. These activation energies are higher than that for diffusion in nickel or nickel-base alloys (280 kJ/gmol-K). Both high activation energies and high stress exponentshave been observedduring creep and rupture (ref 15). MA-956 As can be seen from the regression coefficients in tables XV and XVI, editing of the MA-956 data was required. In addition to deletion, data was added: for example, ultimate tensile strength data from tableVI wasused as 0.1 hourrupture life strength and ultimate tensile strength-strain rate data at 1366 K from slowtensile testing (ref. 12)wasused in the editing 1366 K creep rate regression fit.While significantly improved the fits of the stress rupture data, the fitsof the creep data at1366 and 1477 K are poor.
Although the stress exponents in tables XV and XVI are quite high, they were not unexpected since similar high values wereobserved duringslow tensile testing (ref. 12). None of the activation energies calculated for rupture aremeaningful for theoretical work, whereas all the activation energies for creep satisfy the stress exponent criteria. The latter is true because the permissible confidence interval is large extending from 29 to 67 due to the poorness of fit. Hence the activation energies for creep are of questionable value other than for best description of material behavior. STCA Alloys While editing ofthe creep dataforthe STCA alloys was not necessary for the longitudinal direction (table XVII), minor editing was required forthe long transverse direction (table XVIII). Application of “F” tests to the longitudinal data in table XVII permitted comparisonsofthe various alloy chemistries (table I) and heat treatments (see the section Materials underExperimental Procedures). Such testing indicated that (1) the carbide heat treatment hadno effect onthe creep strength of STCA-265, (2) the creep strengths of heats STCA-262/264S and -2658 are similar, and (3) there is a strength difference between STCA-262/264S (-26%)and-2663 where heat STCA-266s weaker. is Because of these observations, thedatafrom STCA-262/264S and -2658 and STCA-265s and -265SC were pooled and fitted; theresults of this procedure are also given in table XVII. In a like manner, theedited data fitsin table XVIII for the long transverse direction can be tested for differences in chemistry and heat treatment.The results of the “F” tests are as follows: (1) The creep strengths of STCA-26% and -265SC are similar, butSTCA-266s is stronger than STCA-266SC. (2)STCA-262/264S and-2663 possess similar strength whileSTCA-262/264Sis stronger than STCA-265s. (3) The strengths of STCA-265s and -266SC are similar. “F” tests conducted on unedited data yielded thesame behavior. For completenessthe results of regression fits of the pooled data from heats of similar strength are also presented in table XVIII. Examination of the results for both test directions with regard tothe effects ofchemistry and heat treatment revealsseveral discrepancies. A carbide heat treatment has no effect onthestrength‘of STCA-265 but apparently reduces the strength of the low tantalum alloy STCA-266.While the Ta-free 25
alloy (STCA-262/264S) and the Ta-rich alloy (STCA-265s) are stronger than the intermediate Ta alloy (STCA-266s) in the longitudinal direction, for the long transverse testing direction the Ta-free and intermediate Ta level alloys are stronger than the Ta-
26
rich alloy. Thisparadox with reswct tothe chemistry cannot be explained on the basis of grain size or grain aspect ratio (table 11) as one would expect the largest grain size, highest grain aspect ratio alloy to possess the best strength.
References 1. Whittenberger. John D.:DiffusionalCreepandCreepDegradation in Dispersion-Strengthened Ni-Cr Base Alloys. Metall. Trans., vol. 4 no. 6, June 1973, pp. 1475-1483. 2. Whittenberger, John D.: Observations on the Relationship of Structure to the MechanicalProperties of Thin TD-NiCr Sheet.Metall.Trans. A.; vol.7A, no. 5 , May1976,pp. 611-619. 3. Whittenberger. J. Daniel: Effect of Prior Creep a t 1365 K on the Room Temperature Tensile Properties of Several Oxide Dispersion Strengthened Alloys. Metall. Trans. A; vol. 8A, no. 12, Dec. 1977, pp. 1863-1870. 4. Whittenberger, J. Daniel: Tensile and Creep Properties of the Experimental Oxide Dispersion Strengthened Iron-Base Sheet Alloy MA-956E at 1365 K. Maall. Trans A; vol. 9A, no. 1, Jan. 1978, pp. 101-110. 5 . Smith,W.E.;Donachie,M.J..Jr.;andJohnson, J. L.: Relationship ofPriorCreepExposuretoStrengthof Wrought Udimet 700 Nickel-Base Alloy. J. Basic Eng., vol. 88, no. 1, Mar. 1966. pp. 4-6. 6. Jensen, D. E.; Pinkowish, A. A.; and Donachie, M. J., Jr.: Effects of Prior Creep Exposureon 1400' F Strength of Inco 713 CastNickel-BaseAlloy.JBasicEng.,vol. 88, no. 1 , March 1966, pp. 109-110. 7. Tien, J. K.; and Gamble, R. P.: The Influence of Applied Stress and StressSense on GrainBoundaryPrecipitate a Nickel-BaseSuperalloyDuringCreep. Morphologyin Metall. Trans., vol. 2, no. 6, June 1971, pp. 1663-1667. 8. Gibbons,T. B.: The Influence of DiffusionCreep on Precipitate-Free Zone Formation in Ni-20% Cr-Base Alloys. Met. Sci. J., Vol. 6, no. 1, Jan. 1972, pp. 13-16. 9. Bailey. P. G.:ManufactureandEngineTestofAdvanced
Oxide Dispersion Strengthened Alloy Turbine Vanes. Co.; NASA Contract (R77AEG569, General Electric NAS3-18915) NASA CR-135269, 1977. 10. Klarstrom, D. L. and Grierson, R.: Optimization of an Oxide DispersionStrengthenedNi-Cr-AlAlloyforGasTurbine Engine Vanes. (Cabot Corp.; NASA Contract NAS3-17806) NASA CR-134901, 1975. 11.Manson, S. S.: Nonferrous Alloys.AerospaceStructural Metals Handbook Vol. 5 , D. J. Maykuth. ed., Mechanical PropertiesDataCenter, BattelleMemorialLabs., 1980. Sections 4213 and 4311. 12.Whittenberger, J. Daniel:Effect of Strain Rate on the FractureBehavior at 1366Kof the bcc Iron Base Oxide DispersionStrengthenedAlloyMA956.Metall.Trans.A, vol. lOA, no. 9, Sep. 1979, pp. 1285-1295. 13.Feller-Kniepmeier, M.; Gruendler,M.;andHelfmeier.H.: Selfdiffusion in High Purity Nickel and Nickel4.02 at.% Gold Single Crystals. Z. Metallkd., vol. 67, no. 8. 1976, pp. 533-537; or Pruthi, D. D.; Anand, M. S.; and Agarwala, R. P.: Diffusion of Chromium in Inconel 600. J. Nucl. Mater., vol. 6 4 , no. 1-2 1977, pp. 206-210. 14. Kucera, J.; Ciha. K.; and Stransky, K.: Interdiffusion in CoNi System. I-Concentration Penetration Curves and Interdiffusion Coefficients. 11-Kirkendall Effect. IIIIntrinsic Diffusion-Coefficient. Czech. J. Phys., vol. 27, no. 7, 1977, pp. 758-768, 935-942, 1049-1059. 15. Wilcox, B. A.; and Clauer, A. H.: Creep of Thoriatcd Nickel Above and Below 0.5 T,. Trans. AIME, vol. 236, no. 4, Apr. 1966, pp. 570-580; and Wilcox, B. A.; Clauer, A. H.; and McCain, W. S.: Creep and Creep Fracture of Ni-2OCr2Th02 Alloy. Trans. AIME,vol. 239, no. 11, Nov. 1967, pp. 1791-17%.
27
- COMPOSITION OF EXPERIMENTAL MATERIAIS AS PROVIDED BY VENDORS
T A B L E 1.
ALLOY
C O M P O S I T I O N P WT F C T
HEAT NUMBER
E
AL
C CR
CO
MO
HF FE
NI
0
S
S I
TA
T I
4.22
1.09
w
Y
SUPERALLOYS
E-1900
FP9255
6.15
MAR-M509
CJ5098
-
, 0 1*60 9180 171+ 7r42 1 *e005
t62
B A L 23.6
1.2 5.98
e26
-
BAL
-
10.5
-
e006 * e 0 5
to07
e18
O X I D ED I S P E R S I O NS T R E N G T H E N E DA L L O Y S
HA-757
DTOlABD
4.04
HA-956
DH0001F3
st09
-
**262/264
4.61
-
STCA
265
.05 4.69
STCA
266
4.77
-
to5
YU-NiCrA1
173
4.
-
-
STCA
Y L E S ST H A NA M O U N TI N D I C A T E D .
b t AVERAGE OF TWO HEATS.
e06
e02 e05
-
+40
-
e7 15.8
e24
-
-
e4 15.9
e23
-
-
15.7
e91
20t7
BAL
1t1 15.7
-
16.
-
-
BAL
.-
-
"
e63
,005
-
,017
BAL
*54
*too2
BAL
.52
t.002
BAL
,53
6,002
BAL
-
-
-
3.41
t.05
t 2 3 6.90
-
Y203
ZR
TABLE 11. ALLOY
-
CHARACTERISTIC LENGTHY HICRONS
MICRONS
LONG EXTRUSION TRANSVERSE A X I STRANSVERSE TRANSVERSE
L l
L2
HA-757
265
130
HA-956
*
*
810
STCA 265
SHORT
L3
0.85 3-'
L1/JLZL3
LONG
EXTRUSION LONG A X ITRANSVERSE S TRANSVERSE
.95
[io01
10111
[Oiil
-
[i131
ill01
15321
-
-
330
145
290
3.7
e96
X * [loo]
1500
440
160
400
5.7
e90
*r(l[io01
STCA 266
>6500
660
275
>900
YD-NiCrA1
2500
520
310
630
S t WIRETEXTURE.
>15 6.2
SHORT
L 2 / G
*
1 CH.
70
LONGITUDINAL
2.8
GREATER THAN
W
AVERAGE GRAIN SIZE, GRAIN ASPECT RATIO CRYSTALLOGRAPHIC ORIENTATION
110
STCA 2621264
N
GRAIN SIZE PARAMETERS AND CRYSTALLOGRAPHICORIENTATIONSFOR ODs ALLOYS