the automotive industry worries about the misuse potentials of this barrier ..... The project was independently funded by the Institute of Automotive Technology at ...
CRITICAL REVIEW OF THE CURRENT ASSESSMENT APPROACHES FOR FRONTAL CRASH COMPATIBILITY REGARDING THE EVALUATION OF STRUCTURAL INTERACTION Emad Sadeghipour Morris Fischer Fabian Duddeck Markus Lienkamp Technische Universität München Germany Raffaele Ciardiello Politecnico di Torino Italy Paper Number 15-0096 ABSTRACT The assessment of structural interaction has been identified as the main challenge of the unresolved problem of frontal crash compatibility. With this background, two questions are raised: Does a better structural interaction correspond with higher safety and crash compatibility? Are current test approaches able to evaluate structural properties? Considering the structural mechanics of collisions, it is hypothesized that a poor structural interaction does not necessarily result in lower safety and should be considered together with compartment strength and restraint systems. This hypothesis is confirmed by reviewing some crash results from other studies. A spring-mass vehicle model is also used to verify the hypothesis. Finally, a comprehensive simulation study is conducted to find the answers to the two questions. For this study three different variations of a vehicle model are created, which represent different structural properties of the passenger car fleet. The crash performance of these models is analyzed in different car-to-car and car-to-barrier tests. Results of the car-to-car tests show that better structural interaction often makes the vehicle more aggressive. Generally, better structural interaction increases crash pulse and reduces intrusions. Depending on vehicle design and crash configuration, the intrusions or the crash pulse become more important as to why good or poor structural interaction cannot be overall related to more crash compatibility or occupant safety. Our criticism of the current assessment approaches for frontal crash compatibility is the establishment of a direct link between good structural interaction and higher safety. These approaches do not consider the effect of higher crash pulses due to the better structural interaction. Our recommendation is to assess the partner protection through metrics about intrusions and crash pulse of the partner, without direct assessment of the structural interaction. Instead, the test configuration should be able to reflect structural properties in intrusions or crash pulse. Results of the car-to-barrier tests show that the Progressive Deformable Barrier can reflect structural issues correctly. However, the developed metrics for this barrier result in incomprehensive interpretations. Results of the tests with other barriers are inconsistent with the structural properties of the vehicles. Finally, an exemplary test concept with the Advanced European Mobile Deformable Barrier is presented as an alternative assessment approach. Simulation results of the proposed assessment approach show good consistency with the crash performance of the vehicles in the car-to-car tests. Combination of this test concept with the Full-Width Rigid Barrier test can be used to assess the safety and crash compatibility of passenger cars.
1. INTRODUCTION Crash compatibility is known as a key component in improving vehicle safety and will become even more important in Europe’s future road safety. This is due to the increasing market share of mini cars and sport utility vehicles in relation to other car segments [19], which increases the potential of incompatible collisions. Although many studies [4, 15, 16] have been conducted in Europe to develop a proper assessment approach for crash compatibility, no assessment approach has been implemented yet. Important issues involving frontal crash compatibility for normal passenger cars have been identified as compartment strength, restraint systems, force levels and structural interaction (SI). Whereas restraint systems and compartment strength can be evaluated from dummy measurements and intrusion values, the assessment of SI is still an unresolved problem. The issue of force levels consist of deformation forces of frontal structures and energy absorption management [4]. According to the matched pair analysis from the FIMCAR project, the deformation forces does not have a high
Sadeghipour, 1
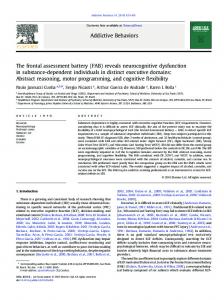
priority. Since the energy absorption management will also be considered in the assessment of SI, the focus of this study is on the issue of structural interaction. Recently, two assessment approaches have been proposed from the FIMCAR project [1, 4]. The first approach is a combination of an offset test with the Offset Deformable Barrier (ODB) at 56 km/h and a full-width test with a Deformable Barrier and a load-cell wall (FWDB) at 50 km/h. A metric was developed in the FIMCAR project to establish a common interaction zone for the vertical SI; however, FIMCAR has not succeeded in developing a metric for horizontal SI in this approach. The second approach is a test with a Progressive Deformable Barrier (PDB) or its mobile version. The developers see this barrier as the only configuration that can potentially assess horizontal load spreading. However, PDB still has validation and repeatability issues that must be resolved before its implementation. Furthermore, the association of the automotive industry worries about the misuse potentials of this barrier [17]. 2. HYPOTHESIS: IMPACT OF STRUCTURAL INTERACTION ON OCCUPANT SAFETY SI describes how the structures of a vehicle deform at the local level when interacting with a collision partner [14]. This definition includes two issues. First, with a poor load spreading, the energy absorption of the frontal structures is lower than its designed goal. The second issue is the structural stability, which prefers a homogeneous and robust reaction of the vehicle structures over different loading conditions. Neither of these aspects have a direct impact on occupants’ injuries. The indirect impact has a dual meaning. On the one hand, poor SI can lead to intrusions by which occupants are exposed to contact injuries. On the other hand, poor SI can result in a higher deformation stroke that reduces the crash pulse in favor of restraint loadings on the occupants. Thus, poor SI does not necessarily correlate with lower safety and should be considered together with compartment strength and restraint systems. Current assessment approaches define some requirements for good SI. In these approaches, the evaluation of separate metrics for SI, intrusions and dummy measurements determines the compatibility of the vehicle. This does not consider the influence of structural properties on crash pulse and intrusions. Review of Some Crash Test Results It has been observed in some real crash tests from different studies that poor SI could result in better occupant safety. In the test series 1b from the FIMCAR project [11], some supermini cars were tested in aligned and misaligned configurations. It is obtained that if the vehicle has a strong passenger compartment and front-end design, then the misalignment does not necessarily result in higher intrusions. In this case, the misaligned configuration results in less intrusion for the firewall. Most dummy criteria were also better by the test series 1b with misalignment. Similar results have been observed in the test series 2 (small family car vs. sport utility vehicle) of the FIMCAR project and the test series 3 (supermini car vs. small family car) of the VC-COMPAT project [2]. This confirms that poor SI does not necessarily result in lower safety. The impact of SI on occupant safety depends on the compartment strength and restraint systems of the vehicle and also the crash configuration. Spring-Mass Vehicle Model A spring-mass vehicle model from [7] has been further developed for this study. The model consists of two nonlinear springs as the main load paths and an elastic beam element as the bumper of the vehicle. The bumper represents load spreading on front structures; i.e. higher stiffness for the bumper corresponds with better SI for the vehicle. This model is calibrated to represent the Finite-Element-Model of the Toyota Yaris from [6]. The consistency between the kinematic of the spring-mass model and the Finite-Element-Model is verified in two tests against a rigid wall at 56 km/h with 50% overlap and full-width. The metrics of the Roadside Safety Verification and Validation Program from [8] are used for this verification. Six variations of the spring model with different bumper stiffnesses are tested against a rigid wall at different speeds and with different overlap values. Figure 1 illustrates the results. The z-axis shows the maximum crash pulse in g. Colors indicate the value of the crash pulse, by which dashed red stands for high. The stiffness increases by a factor of two from SI-1 to SI-6. SI-2 represents the original Finite-Element-Model. The results show that lower SI reduces the crash pulse by high overlaps. It is due to the extended deformation stroke. Higher SI is more desirable for low overlaps since the whole kinetic energy will be absorbed in crash structures, which prevents an impact of stiff compartment on the rigid wall. Hence, the ideal SI is a design parameter, which does not have an overall best case.
Sadeghipour, 2
100
56 5.6
10
56
10
100 10
SI-4
56
100 5.6
10
SI-3
a [g]
a [g] 56
100 5.6
SI-2
SI-1
5.6
100
a [g]
5.6
47 38 30 21 12 0
a [g]
a [g]
a [g] 56
10
SI-5
56
100 5.6
10
SI-6
Figure 1. Crash pulses for different structural interactions (prioritized from poor to good SI). 3. SIMULATION STUDY The previous section explained a hypothesis about the impact of SI on occupant safety. In this section, we are looking for answers to the following two questions: 1. Does a better SI correspond with higher safety and crash compatibility? 2. Are current test approaches able to evaluate structural properties? To find the answers, a simulation study is conducted. Reliability of the Simulation Study In this part, the question of reliability of the simulation results is addressed. The different aspects are categorized into simulation models, evaluation criteria and the test catalog. Simulation Models The Toyota Yaris Finite-Element-Model from [6] is used as the basic simulation model1. This model is validated with crash tests against a Full-Width Rigid Barrier (FWRB) at 56 km/h and at 40 km/h and also against an ODB at 64 km/h with 40% overlap. The overall vehicle deformation and pulse were similar between tests and simulations [6]. This simulation model has also passed some additional tests with higher crash severity that confirmed the model robustness. Thus, this simulation model is considered a proper input for our qualitative simulation study. The basic simulation model is changed to represent different structural properties of vehicles. Three variations are created from the basic model with considering the variations’ feasibility. Each model represents a real car category with well-known SI characteristics. The models are ordered by their structural properties in Table 1. To confirm the SI characteristics of the vehicle models, two simulation studies are conducted: The vehicles strike against the RCAR bumper from [18] at 56 km/h. This barrier can be used to evaluate the vertical homogeneity [9]. It is expected that vehicles with better structural properties have more homogeneity in the vertical deformations. The vehicles collide against the original Yaris model at 50 km/h with 50% overlap. This is the car-to-car baseline situation for the test ECE-R94, which is for the approval of vehicles in Europe with regard to the protection of the occupants in the event of a frontal collision. It is expected that vehicles with better structural properties have more homogeneity in the horizontal deformations.
1
This model has been developed by The National Crash Analysis Center (NCAC) of The George Washington University under a contract with the FHWA and NHTSA of the US DOT.
Sadeghipour, 3
Table 1. Simulation models and their variations, ordered by SI characteristics. # 1
Model Name Mini Electric Car (Mini E-Car)
SI characteristics poor horizontal SI poor vertical SI
2
Electric car (E-Car)
poor horizontal SI
3 4
Basic-Model Strong-Car
Normal good horizontal SI good vertical SI
Changes of the model in relation to the original Yaris model 1- Represents an electric mini car without motor block and radiator, which eliminates a load path in the middle of the vehicle. This reduces the horizontal load spreading. 2- The height of the vehicle is reduced by 50 mm due to the configuration of the suspension systems. This increases the occurrence possibility of vertical SI problems (e.g. over-/underride). 3- A battery pack is added to the luggage compartment to balance the mass of this variation with the basic model. 1- The same as No. 1 for the Mini E-Car 2- The height of the vehicle is the same as for the basic model 3- The same as No. 3 for the Mini E-Car Original Toyota Yaris model without any changes. 1- The material of the front structure components (e.g. radiator frame) is changed to the highest-grade steel. 2- The thickness of the front structure components (e.g. radiator frame) is increased up to 100% (depending on the component). 3- The density of the changed components is scaled to maintain the same mass as the basic model.
Figure 2 illustrates the results of these simulation studies. The results are comprehensive and confirm the ordering of the structural properties. For better visibility, the plastic bumper and the hood are hidden. The main load path and the front structure are colored in red and the wheels are colored in black. To highlight the structures’ performance, a triangle is created for each vehicle that exhibits the homogeneity of the deformations. A triangle with a greater base shows more inhomogeneity. E-Car
Basic-Model
Strong-Car
Horizontal SI
Vertical SI
Mini E-Car
Figure 2. Validation of SI characteristics for the vehicle models. Evaluation Criteria In this study, occupant safety is evaluated by intrusions and restraint loads. Points of vehicle crash metrics from [12] are used to measure the intrusions. This includes average intrusions in the toe-pan, maximum intrusion in the left and right knee-bolster for the driver, maximum displacement of the steering wheel and maximum displacement of the A-pillars. The Occupant Load Criterion (OLC) is used to evaluate the restraint loads on the driver. OLC considers the principle physical behavior of restraint forces applied to the occupant’s chest. At the beginning, the occupant has a free flight
Sadeghipour, 4
phase of about 65 mm and then it will be ideally restrained with a constant deceleration over 235 mm. This constant deceleration defined the OLC value, which corresponds with head and chest injury criteria [5]. Use of intrusion values and OLC, instead of the implementation of a dummy in the vehicle model, removes the dependency of results on the specific configuration of the restraint systems of the test vehicle. Test Catalog To answer the questions from the beginning of this section, two series of car-to-car and car-tobarrier tests are analyzed. The most important types of frontal collisions are considered in the car-to-car test series, with the original Yaris model as the bullet vehicle. These configurations are: Baseline test of ECE-R94 with 50% overlap and 100 km/h collision speed (50 km/h for each vehicle). This test represents a collision with a high risk of intrusions in the passenger compartment. Car-to-car collision with 75% overlap and 100 km/h collision speed (50 km/h for each vehicle). This test represents a collision with a high crash pulse for the restraint systems. It been observed in [13] that there is a high proportion of fatal and severe injuries in accidents with high overlap. Baseline test of small overlap and oblique test from [12] with 15° and 17% overlap and 112 km/h for the bullet vehicle. This test represents a collision with highly misaligned loads and high crash severity. The most important test configurations for safety and crash compatibility are included in the car-to-barrier test series. Aside from ODB (from Euro-NCAP) and FWRB (from US-NCAP), the studied cases are PDB and FWDB from the FIMCAR project [1, 4]. 4. RESULTS Car-to-Car Tests Simulation results are presented in Table 2. This section answers the first question: Does a better SI correspond with higher safety and crash compatibility? Self-Protection Whereas vehicles with better structural properties have lower intrusions, better SI cause generally higher crash pulses and OLC values. Thus, there is no ideal structural property for all crash configurations. There are two exceptions in the test results. By the high overlap test, the Mini E-Car with poor vertical SI has a higher OLC than the E-Car. This is due to a better coupling of wheels with the main load path because of the lower height of the vehicle, which causes a stiffer deformation zone. The other exception is that the Strong-Car with good SI has lower OLC values than the Basic-Model by the small overlap and oblique test. This is due to an impact on the stiff passenger compartment in the Basic-Model test, while the higher stiffness of the deformation zone by the Strong-Car avoids such an impact that reduces the crash pulse and the OLC value. Partner-Protection Generally, the bullet vehicles have more intrusions and OLC values as they collide with vehicles with better structural properties. Hence, better SI makes the vehicles more aggressive. There are two exceptions, by which the intrusion values of the bullet vehicle is less against the Strong-Car with good SI comparing to the test with the Basic-Model. By the small overlap and oblique test, better structural properties of the Strong-Car made it friendlier for the bullet vehicle regarding the intrusion values. The other exception is by the high overlap test, in which better structural properties resulted in less intrusion in the toe-pan and knee-bolster for the Strong-Car compared to the Basic-Model. The results confirm the hypothesis that good or poor SI does not influence occupant safety directly. Structural issues, such as over-/underride, affect intrusion values and crash pulses. Depending on vehicle design and crash configuration, intrusion values or the crash pulse become more important as to why good or poor SI cannot be overall correlated to more or less occupant safety. It is also a design decision, if the passenger compartment should be stronger or the restraint systems should save occupants better. E.g., a supermini car could have a very short and stiff deformation zone, but a high-strength passenger compartment and good restraint systems. Therefore, an assessment of SI through some specific metrics that are independent from crash pulse and intrusions restricts the design’s freedom.
Sadeghipour, 5
Table 2. Results of the car-to-car test series.
Crash configuration
Baseline test of ECER94 vs. Yaris (bullet vehicle) 50% offset 50 km/h for each
High Overlap test vs. Yaris (bullet vehicle) 75% offset 50 km/h for each
Small overlap and oblique test vs. Yaris (bullet vehicle) 15°, 17% offset 112 km/h for the bullet vehicle
Car
OLC [g]
Mini E-Car Bullet E-Car Bullet Basic-Model Bullet Strong-Car Bullet Mini E-Car Bullet E-Car Bullet Basic-Model Bullet Strong-Car Bullet Mini E-Car Bullet E-Car Bullet Basic-Model Bullet Strong-Car Bullet
24.8 20.3 26.4 21.9 25.3 25.5 27.0 27.2 28.0 27.0 26.8 26.8 28.4 28.6 29.7 28.9 22.6 27.5 27.5 28.0 30.2 34.5 29.2 37.4
Intrusion / Displacement [mm] ToeKneeSteering Apan bolster wheel Pillar 162 105 137 40 61 17 27 19 122 69 64 15 91 29 42 24 99 32 26 18 99 34 42 24 93 20 22 20 113 40 42 32 213 101 136 31 42 14 0 10 182 86 114 23 63 40 2 26 141 77 95 23 128 58 77 23 81 22 27 20 112 56 81 27 317 267 420 287 76 7 11 17 251 207 251 75 132 26 38 24 174 92 111 54 171 73 84 31 158 82 128 46 159 54 57 67
Car-to-Barrier Tests It is obtained in previous parts that good or poor SI cannot be overall correlated to more or less occupant safety. To consider the structural properties in the assessment of crash compatibility, either some metrics should predict the structural performance in real collisions, or the test configuration should reflect the structural issues in crash pulse and intrusions. This has been analyzed in this section for different barriers to answer the second question: Are current test approaches able to evaluate structural properties? Simulation results are presented in Table 3. Full-Width Rigid Barrier Vehicles with better SI had higher crash pulses and, consequently, higher OLC values. However, in this test configuration, better SI is penalized with more intrusions. It is due to the nature of the rigid wall that exerts forces to components, which are not designed as load paths. Displacement on these components results in intrusions in the compartment. Thus, this test configuration does not reflect structural properties correctly. There is also no metric for this barrier to predict the structural performance in real collisions. Offset Deformable Barrier Generally, vehicles with lower SI had lower OLC values. However, the intrusions do not correspond with structural properties. The Strong-Car with good SI has more intrusions in the toe-pan and less in other zones. Intrusions of the Mini E-car with poor vertical SI do not reflect any over-/underride problem. On the contrary, the intrusion values in its toe-pan are higher than in other vehicle models. Although the E-Car has a poor horizontal SI, its intrusion values are slightly less than for the Basic-Model. There is also no metric for this barrier to predict the structural performance in real collisions.
Sadeghipour, 6
Full-Width Deformable Barrier A metric has been developed in the FIMCAR project for the FWDB to assess the vertical structural alignment. The loads are measured in eight rows on a load cell wall behind the deformable block. The vehicle must achieve minimum load requirements in rows 3 and 4 and can use loads in row 2 to help fulfilling this requirement under certain conditions. The minimum load requirement promotes structural alignment and the credit of loads from row 2 encourages vertical load spreading [4]. FIMCAR did not succeed in developing a metric for horizontal SI, whereas the E-Car with poor horizontal SI has passed this test; it got even better results than the BasicModel for both OLC and intrusions. The developed metric rejected the Mini E-Car due to its poor vertical SI. However, the Strong-Car with good SI is also failed. The most controversial part of these results is that the Mini E-Car failed due to only 6.4% lower loads than the limit of the metric, whereas the Strong-Car with good SI failed due to 28.1% lower loads. Therefore, it is doubtful that the developed metric could predict the structural performance in real collisions. It is obtained that vehicles with better SI had higher OLC values. As it is mentioned in [10], the intrusion values in this test configuration are generally low and similar for different SI characteristics. A clear trend for different structural properties does not exist and this barrier cannot reflect structural properties correctly. Progressive Deformable Barrier Deformations on the barrier can be used to evaluate SI of the vehicle. There is also a concept for a Fail/Pass metric, which is based on the measurements of the loads in different heights. The criterion 99%ile of Digital Derivative in Y (DDY) in common interaction zone from [1] has been estimated for each vehicle. Lower values correspond to more homogenous vehicle deformation, which is in contrast with the structural priorities of the vehicles. Criterion (d) is another developed metric from [1], which might detect the load path of the vehicles. This metric could generally detect SI problems. However, the (d) scores are similar and since limits are not yet adjusted, the evaluation of the simulation results with Fail/Pass is not possible. Generally, vehicles with lower SI had lower OLC values and higher intrusions. The over-/underride issue is also observed in the results of the Mini E-Car with poor vertical SI relative to the E-Car. Hereby, the steering wheel’s displacement is higher, while other intrusion values for the toe-pan and knee-bolster are lower. This barrier can reflect structural properties in intrusions and crash pulse of the test vehicle. However, the metrics for the partner-protection are ineffective. Table 3. Results of the car-to-barrier test series. Crash configuration US-NCAP vs. FWRB 100% overlap 35 mph EU-NCAP vs. ODB 40% overlap 64 km/h vs. FWDB 100% overlap 50 km/h
vs. PDB 50% overlap 60 km/h
Car
OLC [g]
Mini E-Car E-Car Basic-Model Strong-Car Mini E-Car E-Car Basic-Model Strong-Car Mini E-Car E-Car Basic-Model Strong-Car
28.7 27.7 37.2 37 21 21.9 27.2 27.4 24.1 23.8 30.2 28.8
Intrusion / Displacement [mm] ToeKneeSteering Apan bolster wheel Pillar 110 42 67 33 93 36 38 31 179 65 98 68 180 78 114 80 176 115 97 22 123 75 87 15 125 73 95 33 132 42 71 28 90 26 36 19 87 23 40 18 88 39 12 26 78 27 5 22
Mini E-Car
23.0
168
83
120
23
E-Car
21.8
193
86
80
24
Basic-Model
28.0
106
37
38
25
Strong-Car
27.4
89
27
23
22
Metrics for SI (if any) Failed Passed Passed Failed 99%ile DDY=1.4 (d) score = 3.4 99%ile DDY=1.7 (d) score = 3.2 99%ile DDY=2.8 (d) score = 3.6 99%ile DDY=2.8 (d) score = 3.5
Sadeghipour, 7
5. ALTERNATIVE ASSESSMENT APPROACH Our recommendation is to assess the partner protection through metrics about intrusions and crash pulse of the partner, without direct assessment of the structural interaction. Instead, the test configuration should be able to reflect structural properties in intrusions or crash pulse. An exemplary concept of such a test approach is presented in [10]. The vehicle strikes against the Advanced European Mobile Deformable Barrier (AE-MDB), the geometry and stiffness of which may represent the front-end of today’s passenger car fleet [3]. Since the objective is the proof of this concept, the test configuration is not finalized in this study. The test vehicle collides at 50 km/h with 50% offset against the AE-MDB at 35 km/h. This results in an energy equivalent speed of about 56 km/h for both sides. Besides the criteria for the crash pulse and intrusions of the test vehicle, acceleration pulse and forces behind the deformable blocks will be measured on the mobile barrier. Acceleration pulses will be converted to OLC and forces on the AE-MDB represent the risk of intrusions for the partner. Simulation results of the car-to-AE-MDB tests are presented in Table 4. Table 4. Results of the test vs. AE-MDB. Crash configuration
vs. AE-MDB 50% overlap AE-MDB 35 km/h Car 50 km/h
Car
OLC [g]
Intrusion / Displacement [mm] ToeKneeSteering Apan bolster wheel Pillar
Mini E-Car
19.3
139
80
68
21
E-Car
19.2
142
85
79
17
Basic-Model
26.5
91
38
31
22
Strong-Car
25.5
71
33
22
19
Other Criteria OLCAE-MDB=16g max. F=73.2kN OLCAE-MDB=16.7g max. F=97.2kN OLCAE-MDB=25.1g max. F=222.8kN OLCAE-MDB=25.1g max. F=354.2kN
The simulation results are consistent with the results of the car-to-car tests; i.e. vehicles with better SI result in higher crash pulses for both sides, while intrusions of the vehicles with better SI are smaller. Better SI makes the vehicle more aggressive and causes higher OLC values and forces on the barrier, which is in agreement with the car-to-car tests results. The override issue is also reflected in the Mini E-Car case where the intrusion values in the toe-pan and knee-bolster are less comparing to those of the E-Car. It is noteworthy that the test severity is too low for the displacement of the A-pillar and all values are quite similar. 6. CONCLUSIONS AND RECOMMENDATIONS Better SI increases crash pulse and reduces intrusions. Depending on the vehicle design and crash configuration, intrusion values or the crash pulse become more important as to why good SI cannot be overall related to more crash compatibility. It is obtained that better SI makes the vehicle more aggressive. Current assessment approaches for the frontal crash compatibility establish a direct link between good SI and higher safety. These approaches do not consider the effect of higher crash pulses due to better SI and limit the design’s freedom. Among the current assessment approaches, the PDB is found as the only barrier that can reflect SI issues correctly. However, the developed metrics for this barrier resulted in incomprehensive interpretations. Our recommendation is to assess the partner protection through metrics involving intrusion and the crash pulse of the partner without direct assessment of the structural interaction. Instead, the test configuration should reflect the structural properties in intrusions or crash pulse values. An exemplary test concept is presented and proved by simulations. The combination of this test concept with FWRB test can assess the safety and crash compatibility of the vehicles.
Sadeghipour, 8
ACKNOWLEDGMENT The project was independently funded by the Institute of Automotive Technology at the Technische Universität München. REFERENCES [1] Del Pozo de Dios, E., Lázaro, I., Delannoy, P., Thomson, R., Versmissen, T. & van Nunen, E. (2013). Development of a Structural Interaction Assessment Criterion Using Progressive Deformable Barrier Data. 23rd ESV Conference Proceedings, Seoul [2] Edwards, M.J., de Coo, P., van der Zweep, C., Thomson, R., Damm, R., Martin, T., Delannoy, P., Davies, H., Wrige, A., Malczyk, A., Jongerius, C., Stubenböck, H., Knight, I., Sjöberg, M., Ait-Salem Duque, O. & Hashemi., R. (2007). Improvement of Vehicle Crash Compatibility through the Development of Crash Test Procedures. Final Technical Report of VC-COMPAT [3] Ellway, J.D., van Ratingen, M., Versmissen, T., van Montfort, S., Langner, T., Dobberstein, J., Goutas, P., Gay, P., Malak, A., Denker, C., Hallack, J., Odanaka, K. & Ogihara, T. (2013). The Advanced European Mobile Deformable Barrier Specification for Use in Euro NCAP Side Impact Testing. 23rd ESV Conference Proceedings, Seoul [4] Johannsen, H., Adolph, T., Edwards, M., Lazaro, I., Versmissen, T., & Thomson, R. (2013). Proposal for a Frontal Impact and Compatibility Assessment Approach Based on the European FIMCAR Project . Traffic Injury Prevention, S105-S115, DOI: 10.1080/15389588.2013.790538. [5] Kübler, L., Gargallo, S. & Elsäßer, K. (2009). Frontal crash pulse assessment with application to occupant safety. ATZ worldwide, Volume 111, Issue 6, pp 12-17. [6] Marzoughi, D., Samaha, R.R., Cui, C. & Kan, C. (2012). Extended Validation of the Finite Element Model for the 2010 Toyota Yaris Passenger Sedan. Working paper of NCAC, 2012-W-005 [7] Huang, M. (2002). Vehicle crash mechanics. Boca Raton, Fla.: CRC Press. [8] Mongiardini, M. & Ray, M.H. (2009). Roadside Safety Verification and Validation Program (RSVVP). User’s Manual of RVSSP 1.7 [9] O’Brien, S. (2011). Priorities for the Assessment of Frontal Impact Compatibility. 22 nd ESV Conference Proceedings, Washington, D.C. [10] Sadeghipour, E., Duddeck, F. & Lienkamp, M. (2014). Crash Compatibility of Microcars: A Study on Current Test Approaches. Crash.tech 2014, Munich (also published in Researchgate) [11] Sandqyist, P., Thomson, R., Kling, A., Wågström, L., Delannoy, P., Vie, N., Lázaro, I., Candellero, S., Nicaise, J.L. & Duboc, F. (2012). Report on Car-to-Car Test Results. Deliverable 6.1 from FIMCAR project (FP7) [12] Saunders, J., Craig, M.J. & Suway, J. (2011). NHTSA’s Test Procedure Evaluations for Small Overlap/Oblique Crashes. 22 nd ESV Conference Proceedings, Washington, D.C. [13] Thompson, A., Edwards, M., Wisch, M., Adolph, T., Krusper, A. & Thomson, R. (2011). Report detailing the analysis of national accident databases. Deliverable 1.1 from FIMCAR project (FP7) [14] Thomson, R., Johannsen, H., Edwards, M., Adolph, T., Lázaro, I. & Versmissen, T. (2012). Documentation for a frontal impact and compatibility assessment approach: Part I. Deliverable 6.3 from FIMCAR project (FP7) [15] N.N. (2006). Improvement of vehicle crash compatibility through the development of crash test procedures. Final technical report of project VC-COMPAT [16] N.N. (2007). Car crash compatibility and frontal impact. Final report of EEVC-WG 15 to steering committee [17] N.N. (2008). Detailed discussion of the VDA position on the proposal for draft amendments to UN -ECE R94. Retrieved February 21, 2015, from http://www.unece.org/fileadmin/DAM/trans/doc/2008/wp29grsp/FI -0309e.pdf [18] N.N. (2010). RCAR Bumper Test. Issue 2.0 from Research Council for Automobile Repairs (RCAR) [19] N.N. (2013). European Vehicle Market Statistics. Pocketbook 2013, the International Council on Clean Transportation (ICCT)
Sadeghipour, 9