Cross-correlation procedures for measuring noise and distortion in AGC hearing aids James M. Katesa) AudioLogic, 4870 Sterling Drive, Boulder, Colorado 80301
共Received 16 November 1999; revised 31 January 2000; accepted 13 March 2000兲 The magnitude-squared coherence function 共MSC兲 has been used to measure noise and distortion in linear and compression hearing aids. However, the MSC will overestimate the distortion in a linear time-varying system such as a compression amplifier. The reduction in coherence caused by varying the gain in an otherwise linear system can be substantial, and can lead to large errors in estimating the distortion present in a compression hearing aid. The effects of gain changes in a linear system can be reduced by measuring the normalized system input–output cross correlation, which emphasizes the variance in the system phase response and deemphasizes the system gain fluctuations. Estimates of the total noise and distortion produced using the MSC, phase variance, and notched-noise measurement techniques are compared for additive noise, clipping distortion, and compression amplification. The MSC is found to give the most accurate results for estimating the noise and distortion in a linear time-invariant system, and the notched noise measurements are the most accurate for a compression system. The phase variance is found to give reasonable measurements for a time-varying gain as long as the system variations are slow relative to the length of the analysis data segments. © 2000 Acoustical Society of America. 关S0001-4966共00兲04706-8兴 PACS numbers: 43.66.Ts, 43.58.Ry 关RVS兴
INTRODUCTION
Cross-correlation procedures compare the system output with the system input to determine the system behavior. The coherence function 共Carter et al., 1973兲, for example, is a normalized cross-correlation measurement that determines the degree to which the system output is linearly related to the system input. The signal-to-distortion ratio 共SDR兲, where the distortion term includes all nonlinear effects and noise in the system, can be computed from the coherence. The coherence can be computed for an arbitrary input signal, and is independent of the linear system response once the bias in the estimation procedure has been removed 共Kates, 1992兲. Coherence measurements are becoming important in evaluating hearing aids. Coherence measurement procedures using a broadband noise input signal have been developed for hearing aids 共Preves et al., 1989; Dyrlund, 1989; Preves, 1990; Kates, 1992; Fortune and Preves, 1992; Schneider and Jamieson, 1995兲; and a standard has evolved from this work 共ANSI, 1992兲. The use of a broadband stimulus is essential for determining the response of an automatic gain control 共AGC兲 hearing aid where the system gain as a function of frequency depends on both the signal amplitude and spectral distribution. The coherence is attractive for determining the nonlinear behavior of such a system because it measures all forms of distortion and not just the harmonic distortion traditionally measured 共ANSI, 1996兲. But there is a problem with using coherence to measure the properties of a linear time-varying system such as a compression amplifier. A linear time-varying system is one that varies over time, but in which no nonlinear distortion mechanism such as clipping or amplifier saturation is present. Olofa兲
Electronic mail:
[email protected]
3407
J. Acoust. Soc. Am. 107 (6), June 2000
sson 共1992兲 has shown that the cross correlation of the output with the input of a linear time-varying system must always be less than the result for a system having constant gain. Thus an AGC hearing aid will have lower measured coherence than a linear time-invariant 共non-AGC兲 instrument by virtue of the dynamic gain changes present even if no additional distortion, such as amplifier saturation, occurs. Studies using the magnitude-squared coherence 共MSC兲 to indicate distortion levels in compression hearing aids 共Dyrlund, 1989; Kates, 1993; Schneider and Jamieson, 1995兲 are therefore suspect because the dynamics of the compressor will reduce the measured coherence. Coherence measurements have also been used to quantify the perceived sound quality of devices such as hearing aids. Kates and Kozma-Spytek 共1994兲 were able to model sound quality judgments made by normal-hearing subjects listening to peak-clipped speech by using frequencyweighted coherence measurements relating the output to the input of the distortion system. An extension of that work 共Kozma-Spytek et al., 1996兲 to speech quality judgments by hearing-impaired subjects was inconclusive, however, because the frequency weights used to model the quality judgments by different subjects with similar degrees of hearing loss showed large intersubject variation. Coherence measures the envelope and phase fluctuations of the output signal in comparison with the input. The envelope and phase fluctuations are assumed to be caused exclusively by noise and distortion. However, the envelope fluctuations may also be caused by the gain changes due to the compression amplifier in an AGC hearing aid. Thus a procedure that predominantly measures the phase fluctuations will be much less sensitive to the effects of the compression amplifier as long as the dynamic-range compression affects the gain and not the phase response of the hearing aid. An ex-
0001-4966/2000/107(6)/3407/8/$17.00
© 2000 Acoustical Society of America
3407
ample of such a system would be a linear-phase digital compression hearing aid. If both the phase and gain of the hearing aid are varying in response to the incoming signal, then a noise and distortion estimation procedure using a notchednoise test signal may be the best solution. Such a procedure positions one or more notches in the excitation spectrum and then estimates the noise and distortion from the signal power that falls in each notch in comparison to the power in the surrounding peaks 共Burnett, 1967; Kates, 1990兲. This paper begins with a review of the procedure used to calculate the magnitude-squared coherence. The effect on the MSC of varying the system gain is then documented. The phase variance, a new distortion measure that reduces the effects of gain changes, is then introduced, and the notchednoise measurement technique is also described. The performance of the phase variance is then compared to that of the MSC and notched-noise technique for additive noise, clipping distortion, and compression amplification. The SDR computed from the phase variance is shown to be much less affected by AGC operation in a dynamic-range compressor than the SDR computed from the coherence, but neither cross-correlation procedure is as robust as the notched-noise technique in the presence of system gain fluctuations.
FIG. 1. Block diagram of a linear processing system with additive noise.
and are then averaged across segments, and the MSC is computed from the averages. For M data segments, the estimated MSC is given by 兩 ␥ˆ 共 兲 兩 2 ⫽
M ⫺1 *共 兲兩 2 兩 兺 m⫽0 X m共 兲 Y m M ⫺1 M ⫺1 兺 m⫽0 兩 X m 共 兲 兩 2 兺 m⫽0 兩 Y m共 兲兩 2
,
共4兲
where the asterisk denotes the complex conjugate, and X m ( ) and Y m ( ) are the spectra of the mth windowed data segments of x(n) and y(n), respectively, computed using the FFT algorithm. Typically, a Hanning 共von Hann兲 or Hamming data window and 50% overlap are used for the data segments. The estimated MSC is subject to bias effects due to the finite segment length and finite number of segments, and unbiasing techniques have been developed by Kates 共1992兲.
I. MAGNITUDE-SQUARED COHERENCE
B. Time-varying system
A. Definition
The MSC definition assumes that the input and output signals are stationary, that is, the signal statistics do not change over time. If the system is time varying, as occurs in a compression amplifier, then the underlying stationarity assumptions are violated and the MSC is no longer valid. A simple signal processing system is shown in Fig. 1. If the transfer function H( ) is time varying, even for a stationary input x(n), the estimated MSC will be misleading. As an example, let the system transfer function switch between two gain values a and b with a duty cycle of 50%. The input signal is white Gaussian noise and there is no additive noise. The auto- and cross-spectra are then given by
The coherence function 共Carter et al., 1973兲 is the normalized cross-spectral density given by
␥ 共 兲 ⫽S xy 共 兲 / 关 S xx 共 兲 S y y 共 兲兴 1/2,
共1兲
where S xy ( ) is the cross-spectral density between the two stationary random processes x(n) and y(n) having autospectral densities S xx ( ) and S y y ( ), respectively. The magnitude-squared coherence function 共MSC兲 is then given by 兩 ␥ 共 兲 兩 2 ⫽ 兩 S xy 共 兲 兩 2 /S xx 共 兲 S y y 共 兲 ,
共2兲
with 0⭐ 兩 ␥ ( ) 兩 2 ⭐1. When x(n) is the input to a system and y(n) is the output, the MSC represents the fraction of the output signal power that is linearly dependent on the input at each analysis frequency. The complementary fraction 1⫺ 兩 ␥ ( ) 兩 2 gives the output power at each frequency that is unrelated to the input at that frequency and thus represents the nonlinear distortion and noise. The SDR is therefore given by 共Carter et al., 1973兲 SDR共 兲 ⫽ 兩 ␥ 共 兲 兩 2 / 关 1⫺ 兩 ␥ 共 兲 兩 2 兴 .
共3兲
When 兩 ␥ ( ) 兩 2 ⫽1, all of the output is linearly related to the input and the SDR approaches infinity. When 兩 ␥ ( ) 兩 2 ⫽0, there is no relationship between the output and the input and the SDR is zero as well. The MSC is typically estimated using fast Fourier transform 共FFT兲 techniques 共Carter et al., 1973兲. The data sequences x(n) and y(n) are divided into a number M of overlapping windowed data segments. The cross-spectrum and autospectra are computed for each segment using the FFT 3408
J. Acoust. Soc. Am., Vol. 107, No. 6, June 2000
S xx 共 兲 ⫽E 关 兩 X 共 兲 兩 2 兴 , S y y 共 兲 12 共 a 2 ⫹b 2 兲 E 关 兩 X 共 兲 兩 2 兴 ,
共5兲
S xy 共 兲 ⫽ 21 共 a⫹b 兲 E 关 兩 X 共 兲 兩 2 兴 . The MSC for this system is then given by 兩 ␥共 兲兩 2⫽
1 共 a⫹b 兲 2 . 2 共 a 2 ⫹b 2 兲
共6兲
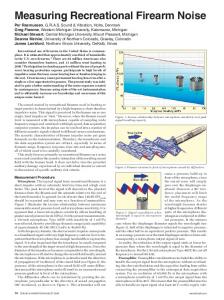
If the gain is constant, as given by b⫽a, then the MSC ⫽1. However, any fluctuations in the gain reduce the MSC. The SDR, computed from the MSC using Eq. 共3兲 and converted to dB, is plotted in Fig. 2 as a function of the ratio b/a. Reducing the ratio b/a reduces the SDR despite the fact that there is no distortion mechanism such as clipping or amplifier saturation nor any additive noise in this example. When b⫽0 the MSC from Eq. 共6兲 becomes 0.5, which gives a SDR of 0 dB. Thus gain variations, as occur in a compression amplifier, will reduce the MSC and associated SDR estimated for a hearing aid. It is important to note that the rate James M. Kates: Cross-correlation procedures
3408
The SDR of a linear time-varying system can be estimated using the normalized cross correlation as the starting point. The phase variance describes the fluctuations in P m ( ) and is given by
冉
1 共 兲⫽ M 2
M ⫺1
兺
m⫽0
兵 Re2 关 P m 共 兲兴 ⫹Im2 关 P m 共 兲兴 其
冊
⫺ 共 Re2 关 共 兲兴 ⫹Im2 关 共 兲兴 兲 .
共10兲
As shown in Appendix A, the SDR is approximately SDR共 兲 ⫽2/ 2 共 兲 .
FIG. 2. Signal-to-共distortion plus noise兲 ratio 共SDR兲 in dB for a linear time-varying processing system switching between gains of a and b with a 50% duty cycle.
of the gain fluctuations is immaterial in this example; slow or rapid changes in gain will give the same reduction in coherence as long as the ratio b/a is the same. In a compression hearing aid, however, the amount of distortion will depend on the interaction of the compressor attack and release times and the rate of the signal envelope fluctuations.
II. PHASE VARIANCE
For a linear system, the phase of the system transfer function can be extracted from the input–output cross correlation, with the phase given by
共 兲 ⫽tan⫺1 兵 Im 关 S xy 共 兲兴 /Re 关 S xy 共 兲兴 其 .
共7兲
The phase of the system transfer function can be estimated using the short-time FFT much like the procedure used to estimate the coherence. If the cross-correlation FFTs are averaged across the entire data record before the phase is computed, then the same stationarity assumptions apply for the estimated phase as applied for the estimated coherence. Normalizing the cross correlation on a segment-by-segment basis, however, gives the short-time estimates of cos 关m()兴 ⫹j⫻sin 关m()兴 for data block m. The average of these real and imaginary components will be much less sensitive to compression amplifier gain fluctuations because of the segment-by-segment normalization, and the variance of the normalized signal can be used to indicate the undesired phase fluctuations caused by noise and distortion. Define the normalized cross correlation for data segment m: P m共 兲 ⫽
*共 兲 X m共 兲 Y m *共 兲兩 兩 X m共 兲 Y m
.
共8兲
The estimate of the normalized cross correlation then becomes 1 共 兲⫽ M 3409
M ⫺1
兺
m⫽0
P m共 兲 .
J. Acoust. Soc. Am., Vol. 107, No. 6, June 2000
共9兲
共11兲
The SDR computed using Eqs. 共10兲 and 共11兲 assumes that the linear time-varying system has a constant phase response even though the gain may be changing, and that the gain changes occur slowly relative to the analysis block size. These assumptions would apply, for example, to a linearphase digital compression system having time constants long relative to the analysis window. However, compressor gain changes occurring on the same time scale as the analysis window, as discussed in Appendix B, will reduce the SDR. The SDR computed using the phase variance is then interpreted in the same way as the SDR computed using the coherence, that is, it assumes that all of the measured phase fluctuations are due to noise and distortion. III. NOTCHED-NOISE MEASUREMENTS
The notched-noise distortion measurement uses the procedure developed by Kates 共1990兲. The noise test signal is speech-shaped Gaussian noise which is then convolved with a comb filter to create a series of interleaved peaks and valleys. White Gaussian noise is first passed through a threepole Butterworth high-pass filter with a cutoff frequency of 200 Hz and a three-pole Butterworth low-pass filter with a cutoff frequency of 5000 Hz. The band-limited noise signal is then passed through a one-pole low-pass filter having a cutoff frequency of 900 Hz to approximate the long-term spectrum of speech. The comb filter has 0-dB pass-band gain and 62-dB stop-band attenuation, with valleys at 625 Hz and multiples of 625 Hz and pass-band peaks occurring between each adjacent pair of valleys. The assumed system sampling rate is 20 kHz. The distortion measurement procedure is based on determining how much energy from the peaks of the combfiltered noise signal spills over into the valleys. The power spectrum of the output signal is computed using the method of modified periodigrams 共Welch, 1967兲, with the data processed in blocks of 2048 samples using a Hamming window and 50% overlap. The distortion energy is computed as the mean-squared energy in the center of the valley, and the signal energy is computed as the mean-squared energy in the peaks to either side of the valley with the bias equal to the distortion energy subtracted out. The transition regions between the peaks and the valley are not used. A modification to the notched-noise technique is to replace the speech-shaped noise with a segment of speech. The speech segment is passed through the comb filter to generate a notched speech excitation signal, and the distortion is then measured using the same procedure as for the notched-noise James M. Kates: Cross-correlation procedures
3409
FIG. 3. The SDR in dB as a function of frequency computed from the MSC and phase variance. The input signal is white Gaussian noise, and the interference is independent white Gaussian noise at a SNR of 30 dB.
test signal. The notched speech signal preserves the envelope fluctuations of the original speech, and is thus a useful signal for testing a compression hearing aid. To compute the AI-weighted SDR, the peak-to-valley ratios are first converted to dB. The SDR is then given by a weighted sum of the dB values corresponding to the valleys at 625–5000 Hz. The weights are derived from the Articulation-Index weights of Kryter 共1962兲, and are tabulated by Kates 共1990兲. IV. SIMULATION RESULTS
The MSC, phase variance, and notched-noise test procedures were implemented to estimate the SDR of a corrupted signal. The simulation sampling rate was 16 kHz for the MSC and phase variance, and 20 kHz for the notched noise. The analysis procedures for the MSC and phase variance used a block size of 128 samples 共8 ms兲 weighted with a Hamming window and a 128-point FFT for the frequency analysis unless otherwise stated. The segments had a overlap of 64 samples. The notched-noise measurements used a FFT block size of 2048 samples 共102.4 ms兲 with an overlap of 1024 samples. Five seconds of data were processed for each measurement condition. An example of the SDR computed from the MSC and phase variance as a function of frequency is shown in Fig. 3. The input signal is white Gaussian noise with additive uncorrelated white Gaussian noise interference at a SNR of 30 dB. The system had a flat unity gain. The SDR derived from the MSC is very well behaved under these measurement conditions, giving an accurate result at all frequencies. The SDR derived from the phase variance shows much more variance across frequency and underestimates the SNR. The greater variance in the SDR computed from the phase variance is probably due to the fact that the phase fluctuations are the only part of the signal variation being used, whereas the SDR computed from the MSC is based on both the phase and amplitude fluctuations and thus has more information available about the signal. 3410
J. Acoust. Soc. Am., Vol. 107, No. 6, June 2000
FIG. 4. The AI-weighted SDR in dB computed from the MSC, phase variance, and notched-noise techniques. The input signal for the MSC and phase variance is white Gaussian noise, and the input for the notched-noise test is comb-filtered speech-shaped Gaussian noise. The interference is independent white Gaussian noise at the indicated SNR.
The SDRs derived from the three measurement procedures are shown in Fig. 4 for additive noise. The system input for the MSC and phase variance was white Gaussian noise, while the comb-filtered speech-shaped noise was used for the notched-noise measurements. Uncorrelated white Gaussian noise interference was added at the indicated SNR. The system had flat unity gain. The logarithmic SDR values for the MSC and phase variance were averaged across frequency using the Kryter Articulation Index 共AI兲 weights 共Kryter, 1962; Kates and Kozma-Spytek, 1994兲 to give the AI-weighted SDR values shown in the figure. The MSC yields an essentially perfect mapping of the input SNR into the estimated SDR. The phase variance overestimates the SDR at input SNR values of less than 10 dB, and then underestimates the higher SNR values by an average of about 2 dB. The deviations of the SDR computed from the phase variance are primarily the result of the approximation used to compute the SDR from the phase variance. The notchednoise measurements give SDR estimates approximately 6 dB greater than those computed using the MSC at the lower SNR values, and then start to approach the asymptotic level determined by the comb-filter and windowed FFT sidelobes as the input SNR increases. The SDRs computed from the three measurement procedures are shown in Fig. 5 for symmetric peak clipping distortion. The system input for the MSC and phase variance was white Gaussian noise with unit variance, and the input for the notched-noise measurements was the comb-filtered speech-shaped noise. The clipping threshold is expressed in units of the signal standard deviation; a clipping threshold of 1 corresponds to clipping the signal at its rms level. The clipping threshold was then varied over the indicated range, giving infinite clipping near the threshold of zero and essentially no clipping at the threshold of 3.5. The system had flat unity gain, and the logarithmic SDR values for the MSC and phase variance were again averaged across frequency using James M. Kates: Cross-correlation procedures
3410
TABLE II. The AI-weighted averages of the SDR in dB calculated using the notched-noise technique. The simulated broadband compression hearing aid had a compression ratio of 1.5:1 with an ANSI attack time of 5 ms and an ANSI release time of 50 ms. The compression threshold was set to 40 dB below the rms signal level. The analysis block length was 2048 samples. SDR dB
FIG. 5. The AI-weighted SDR in dB computed from the MSC, phase variance, and notched-noise techniques. The input signal for the MSC and phase variance is white Gaussian noise having a variance of 1, and the input for the notched-noise test is comb-filtered speech-shaped Gaussian noise having a variance of 1. The signal is symmetrically peak clipped at the indicated clipping threshold re: the signal rms level.
the Kryter Articulation Index 共AI兲 weights to give the AIweighted SDR values shown in the figure. The SDR computed from the MSC is monotonically increasing with clipping threshold, and is assumed to be an accurate representation of the distortion level. The SDR computed from the phase variance overestimates the SDR for the higher amounts of distortion generated by the lower clipping thresholds, but the SDR values above 10 dB match those of the MSC curve quite closely. The SDR computed from the notched-noise measurements again lies about 6 dB above that estimated from the MSC at low input SNR values, and then approaches the asymptotic value at high input SNR values. Note that the SDR computed from any of the three procedures is monotonic with clipping level, so rankings of the amount of distortion based on any of the SDR estimates will be accurate. Both the additive noise and the clipping distortion experiments are measurement conditions where the MSC is expected to be accurate because the underlying signal processing system has constant gain. Results for a simulated broadband compression hearing aid for several different input signals are presented in Table I. The broadband compresTABLE I. The AI-weighted averages of the SDR calculated from the magnitude-squared coherence 共MSC兲 and phase variance. The simulated broadband compression hearing aid had a compression ratio of 1.5:1 with an ANSI attack time of 5 ms and an ANSI release time of 50 ms. The compression threshold was set to 40 dB below the rms signal level. The analysis block length was 128 samples.
Test signal
MSC SDR 共dB兲
Phase variance SDR 共dB兲
White Gaussian noise Speech-shaped noise Amplitude-modulated speech-shaped noise Speech segment
35.3 31.2 18.9 16.3
40.7 36.7 35.3 28.2
3411
J. Acoust. Soc. Am., Vol. 107, No. 6, June 2000
Test signal
No compression
Compression
Notched noise Notched speech
38.6 38.8
37.3 36.0
sion amplifier had a compression ratio of 1.5:1 with an ANSI attack time of 5 ms and an ANSI release time of 50 ms 共ANSI, 1996兲. The compression threshold was set to 40 dB below the rms signal level. There was no additive noise or clipping distortion in the compression system. The amplitude modulation applied to the speech-shaped noise had a modulation index of 0.6, which gave a modulation envelope peakto-valley ratio of 12 dB, and the modulation frequency was 6 Hz. The tabulated results indicate that as the envelope fluctuations of the input signal increase, causing greater gain variations in the compression amplifier, the SDR computed from the MSC decreases. This illustrates the problem of using the MSC to compute the performance statistics of a linear time-varying system. Even with no external source of noise or clipping distortion, the gain fluctuations of the compression system cause a substantial reduction in the computed MSC and SDR. This would lead one to conclude that the compression system had large amounts of distortion when in fact what is present is only artifacts of the measurement procedure. The SDR computed from the phase variance, on the other hand, shows much less sensitivity to the gain fluctuations, although some sensitivity is still present, and would be a more accurate indicator of the residual distortion resulting from the compression amplification. Compression results for the SDR computed using the notched-noise technique are presented in Table II. The simulated compression hearing aid is the same as used for the results of Table I. The two test signals are the notched-noise test signal defined by Kates 共1990兲 and the speech segment passed through the comb filter to give a notched speech signal. The SDR computed from the notched-noise technique is much less affected by the compressor than that computed from the MSC or the phase variance. The SDR estimated using the notched speech signal is 36.0 dB, as compared to 28.2 dB for the phase variance and 16.3 dB for the MSC using the speech signal. The SDR computed from the notched-noise technique appears to be much more robust in the presence of gain fluctuations than that computed from the correlation-based procedures. The SDR computed from the phase variance is sensitive to the analysis block size. The phase variance computation assumes that the system gain is relatively constant over the block duration. If the gain changes more rapidly than the block rate, the SDR computed from the phase variance will be reduced. This effect is illustrated in Fig. 6 for the speech segment as the MSC and phase variance analysis block size is increased from 32 samples 共2 ms兲 to 4096 samples 共256 James M. Kates: Cross-correlation procedures
3411
FIG. 6. The AI-weighted SDR in dB computed from the MSC, phase variance, and the notched-noise techniques for a simulated broadband compression hearing aid having a compression ratio of 1.5:1 with an ANSI attack time of 5 ms and an ANSI release time of 50 ms. The compression threshold was 40 dB below the rms signal level. The input signal for the MSC and phase variance is the speech segment, and the input for the notched-noise test is the speech segment passed through the notched-noise comb filter.
ms兲 at the 16-kHz sampling rate. The attack time of the compressor is 5 ms, which is comparable to the analysis block size used in the SDR calculations. The SDR computed from the MSC remains constant at about 16.2 dB independent of the block size. However, the SDR computed from the phase variance is inversely proportional to the block size, decreasing approximately 3 dB for each doubling of the block length. Thus one should use the shortest block size that is compatible with the required frequency resolution when computing the SDR from the phase variance. The SDR computed using the notched speech approach, however, is essentially immune to the analysis block size. A minimum block size of 512 samples is needed to give adequate frequency resolution for estimating the power in the signal valleys. As the block size increases, the SDR computed from the notched speech signal increases due to reduced interference between the FFT sidelobes and the residual power level estimated in the valleys.
For those situations where the input and output signals are known to be stationary, the MSC is the preferred estimation procedure. The SDR derived from the MSC accurately measures noise and distortion levels in linear time-invariant systems. However, there are many situations, such as a compression amplifier in a hearing aid, where the system gain is varying with time. For these situations the phase variance is preferable to the MSC because it is much less sensitive to the effects of gain fluctuations. Even though the phase variance is somewhat less accurate in estimating the noise and distortion, the net error will be much smaller than for the MSC in a compression system. However, the phase variance will also be sensitive to the changes in a linear time-varying system if the phase varies in addition to the gain or if substantial gain variation occurs within the analysis data segments. The notched-noise technique has the best immunity to the effects of compressor gain fluctuations. The SDR estimated using the notched-noise technique shows an approximate 6-dB bias in comparison with that estimated using the MSC for stationary test conditions. However, the notchednoise measurements were essentially unaffected by the compressor gain changes induced by the speech signal. One could therefore calibrate the notched-noise measurements under stationary conditions using the MSC as a reference, and then proceed to use the notched-noise approach for systems suspected of having gain fluctuations. The detection of noise and distortion for an arbitrary test signal is based on measuring amplitude and phase perturbations in the system output that were not present in the input. The MSC measurement is based on the assumption that all perturbations in the output are due to noise and distortion, while the phase variance is based on the assumption that the phase perturbations are due to noise and distortion and ignores slow amplitude fluctuations. The notched-noise measurement works on a different principle; it is based on the assumption that the power that appears in the spectral notches is due to noise and distortion, and it ignores both amplitude and phase perturbations in the bands carrying the input signal power. Thus one needs to choose the measurement procedure based on knowledge of the underlying system behavior to ensure that the measurements are meaningful rather than corrupted by artifacts. ACKNOWLEDGMENTS
V. CONCLUSIONS
There are many techniques that can be used to estimate the noise and distortion in a hearing aid. The unbiased MSC has the advantages of providing an accurate noise and distortion estimate for an arbitrary test signal, but the results are invalid for a compression instrument because of the system gain fluctuations. On the other hand, notched noise measurements can give a valid noise and distortion estimate for any system, but require the use of a special test signal or notchfiltered input. The phase variance thus occupies a useful middle position, giving reasonable measurements for a timevarying gain and an arbitrary test signal as long as the system variations are slow relative to the length of the analysis data segments. For rapid gain variations, however, the phase variance will lead to erroneous results. 3412
J. Acoust. Soc. Am., Vol. 107, No. 6, June 2000
The work presented in this article was supported in part by GN ReSound. The author would like to thank Dave Preves for comments on a draft version of this paper. APPENDIX A: COMPUTING THE SDR FROM THE PHASE VARIANCE
Consider the linear system of Fig. 1 with additive noise. The normalized cross correlation estimated for this system using Eq. 共9兲 is
共 兲⫽
1 M
M ⫺1
兺
m⫽0
H * 共 兲 兩 X 共 兲 兩 2 ⫹D * 共 兲 X 共 兲 , 兩 H * 共 兲 兩 X 共 兲 兩 2 ⫹D * 共 兲 X 共 兲 兩
共A1兲
where D( ) is the Fourier transform of the noise signal shown in Fig. 1. Because the normalization is performed for James M. Kates: Cross-correlation procedures
3412
ach data segment, Eq. 共A1兲 can be rewritten as 1 共 兲⫽ M
M ⫺1
兺
兵 cos 关 m 共 兲兴 ⫹ j⫻sin 关 m 共 兲兴 其 . 共A2兲
m⫽0
If the phase response of the system transfer function remains constant, as would occur in a linear-phase digital system, then the system phase for each data segment can be represented as
m共 兲 ⫽ 共 兲 ⫹ ␦ m共 兲 ,
共A3兲
where ( ) is the constant linear system phase shift and ␦ m ( ) is the phase fluctuation caused by the additive noise. The normalized cross correlation of Eq. 共A2兲 then becomes
共 兲⫽
1 M
M ⫺1
兺
兵 cos 关 共 兲 ⫹ ␦ m 共 兲兴 ⫹ j⫻sin 关 共 兲
m⫽0
⫹ ␦ m 共 兲兴 其 .
共A4兲
The variance of the normalized cross correlation given in Eq. 共10兲 then becomes
cos 关 ␦ m 共 兲兴 ⫽
1 M
M ⫺1
兺
m⫽0
再 冋
2 Re2
册 冏
D *共 兲 1 D *共 兲 ⫹ X *共 兲 2 X *共 兲
冏冎 2
. 共A8兲
Assuming that half of the noise power is in the real part and half of the power in the imaginary part then yields SDR共 兲 ⫽2/ 2 共 兲 .
共A9兲
Equation 共A9兲 gives the approximate solution for the SDR computed from the phase variance.
APPENDIX B: EFFECTS OF GAIN CHANGES ON THE PHASE VARIANCE
The phase variance can be affected by changes in the system gain. The nature of these effects can be quite complicated due to the interaction of the compressor attack and release time constants and the rate of the signal envelope modulations. A general explanation of the effect of gain fluctuations on the phase variance is given in this appendix. Assume that the phase variance is being measured using data segments of length L. Further assume that the compressor gain goes from 1 to 1⫹g and back to 1 over the duration of the segment, with the short-term gain function given by g g 共 n 兲 ⫽1⫹ 关 1⫺cos 共 2 n/L 兲兴 . 2
共B1兲
The L-point FFT of the gain, G( ), consists of a peak at ⫽0 having magnitude 1⫹g/2 flanked by sidelobes having 3413
M ⫺1
兺
m⫽0
关 兵 cos 关 共 兲 ⫹ ␦ m 共 兲兴 ⫺cos 关 共 兲兴 其 2
⫹ 兵 sin 关 共 兲 ⫹ ␦ m 共 兲兴 ⫺sin 关 共 兲兴 其 2 兴 . 共A5兲 Evaluating the summation and simplifying the trigonometric terms leads to
2共 兲 ⫽
1 M
M ⫺1
兺
m⫽0
2 兵 1⫺cos 关 ␦ m 共 兲兴 其 .
J. Acoust. Soc. Am., Vol. 107, No. 6, June 2000
共A6兲
The variance of the normalized cross correlation thus depends only on the phase shift from segment to segment and is independent of the linear time-invariant system transfer function or of the gain fluctuations in a linear time-varying system having a constant phase response. The variance of the normalized cross-correlation depends on the amplitudes of the signal and additive noise. Since the linear system transfer function is immaterial as long as it has constant phase with respect to time, it can be replaced by 1. This substitution yields
Re 关 1⫹D * 共 兲 /X * 共 兲兴 . 兵 Re2 关 1⫹D * 共 兲 /X * 共 兲兴 ⫹Im2 关 1⫹D * 共 兲 /X * 共 兲兴 其 1/2
Substituting Eq. 共A7兲 into Eq. 共A6兲 and approximating (1 ⫹x) ⫺1/2 as 1⫺x/2 leads to
2共 兲 ⫽
1 共 兲⫽ M 2
共A7兲
magnitude g/2. The system output spectrum is then given by the frequency-domain convolution of the input spectrum with the gain spectrum: Y 共 兲 ⫽X 共 兲 * G 共 兲 .
共B2兲
The effect of the variation in the gain function is thus a smoothing in the spectral domain. Changes in the amplitude of the gain function will change the amount of spectral smoothing, and changes in the rate of the gain increase or decrease will change the width of the spectral smoothing function. The spectral smoothing caused by the short-term gain changes will change both the amplitude and phase of the output signal. The phase variance calculation of Eq. 共9兲 compensates for the amplitude changes but not for the phase changes. Thus the system phase shift will change from analysis block to analysis block as the spectral smoothing adjusts to the changes in the short-term compressor gain. The net result is an increase in the phase variance due to shortterm gain changes.
ANSI S3.42-1992. 共1992兲. ‘‘American National Standard Testing Hearing Aids with a Broad-Band Noise Signal’’ 共American National Standards Institute, New York兲. ANSI S3.22-1996. 共1996兲. ‘‘American National Standard Specification of Hearing Aid Characteristics’’ 共American National Standards Institute, New York兲. Burnett, E. D. 共1967兲. ‘‘A new method for the measurement of nonlinear distortion using a random noise test signal,’’ Bull. Prosthet. Res. 10, 76– 92. Carter, G. C., Knapp, C. H., and Nuttall, A. H. 共1973兲. ‘‘Estimation of the James M. Kates: Cross-correlation procedures
3413
magnitude-squared coherence function via overlapped fast Fourier transform processing,’’ IEEE Trans. Audio Electroacoust. 21, 337–344. Dyrlund, O. 共1989兲. ‘‘Characterization of non-linear distortion in hearing aids using coherence: A pilot study,’’ Scand. Audiol. 18, 143–148. Fortune, T. W., and Preves, D. A. 共1992兲. ‘‘Hearing aid saturation and aided loudness discomfort,’’ J. Speech Hear. Res. 35, 175–185. Kates, J. M. 共1990兲. ‘‘A test suite for hearing aid evaluation,’’ J. Rehabil. Res. Dev. 27, 255–278. Kates, J. M. 共1992兲. ‘‘On using coherence to measure distortion in hearing aids,’’ J. Acoust. Soc. Am. 91, 2236–2244. Kates, J. M. 共1993兲. ‘‘Hearing aid design criteria,’’ J. Speech-Lang. Path. and Audiology Monograph Supplement 1, 15–23. Kates, J. M., and Kozma-Spytek, L. 共1994兲. ‘‘Quality ratings for frequencyshaped peak-clipped speech,’’ J. Acoust. Soc. Am. 95, 3586–3594. Kozma-Spytek, L., Kates, J. M., and Revoile, S. 共1996兲. ‘‘Quality ratings for frequency-shaped peak-clipped speech: Results for listeners with hearing loss,’’ J. Speech Hear. Res. 39, 1115–1123.
3414
J. Acoust. Soc. Am., Vol. 107, No. 6, June 2000
Kryter, K. D. 共1962兲. ‘‘Methods for the calculation and use of the articulation index,’’ J. Acoust. Soc. Am. 34, 1689–1697. Olofsson, A. 共1992兲. ‘‘Measurements on AGC hearing instruments by use of broad-band test signals and a psychoacoustical model,’’ Karolinska Institutet, Teknisk Audiologi, Report TA126. Preves, D. A. 共1990兲. ‘‘Expressing hearing aid noise and distortion with coherence measurements,’’ ASHA 32, 56–59. Preves, D. A., Beck, L. B., Burnett, E. D., and Teder, H. 共1989兲. ‘‘Input stimuli for obtaining frequency responses of automatic gain control hearing aids,’’ J. Speech Hear. Res. 32, 189–194. Schneider, T., and Jamieson, D. G. 共1995兲. ‘‘Using maximum length sequence coherence for broadband distortion measurements in hearing aids,’’ J. Acoust. Soc. Am. 97, 2282–2292. Welch, P. D. 共1967兲. ‘‘The use of the fast Fourier transform for the estimation of power spectra: A method based on short, modified periodigrams,’’ IEEE Trans. Audio Electroacoust. AU-15, 70–73.
James M. Kates: Cross-correlation procedures
3414