Cross-Relational Clustering with User’s Guidance Xiaoxin Yin UIUC
[email protected]
Jiawei Han UIUC
[email protected]
ABSTRACT Clustering is an essential data mining task with numerous applications. However, data in most real-life applications are high-dimensional in nature, and the related information often spreads across multiple relations. To ensure effective and efficient high-dimensional, cross-relational clustering, we propose a new approach, called CrossClus, which performs cross-relational clustering with user’s guidance. We believe that user’s guidance, even likely in very simple forms, could be essential for effective high-dimensional clustering since a user knows well the application requirements and data semantics. CrossClus is carried out as follows: a user specifies a clustering task and selects one or a small set of features pertinent to the task. CrossClus extracts the set of highly relevant features in multiple relations connected via linkages defined in the database schema, evaluates their effectiveness based on user’s guidance, and identifies interesting clusters that fit user’s needs. This method takes care of both quality in feature extraction and efficiency in clustering. Our comprehensive experiments demonstrate the effectiveness and scalability of this approach.
1. INTRODUCTION Clustering is a process of partitioning data objects into groups according to some similarity measure [11, 16, 17, 19]. Most existing methods perform clustering within a single table, and many handle only a small number of dimensions. Recent studies on high-dimensional clustering have developed methods for subspace or projected clustering [1, 2, 6] that aim at finding clusters on subsets of dimensions in a high-dimensional space. However, many of such methods ignore user’s expectation but only examine the dissimilarities among data objects. The clusters so generated could be lack of semantic meaning and poor in quality. ∗ The work was supported in part by the U.S. National Science Foundation NSF IIS-02-09199, and an IBM Faculty Award. Any opinions, findings, and conclusions or recommendations expressed in this paper are those of the authors and do not necessarily reflect views of the funding agencies.
Permission to make digital or hard copies of all or part of this work for personal or classroom use is granted without fee provided that copies are not made or distributed for profit or commercial advantage and that copies bear this notice and the full citation on the first page. To copy otherwise, to republish, to post on servers or to redistribute to lists, requires prior specific permission and/or a fee. KDD’05, August 21–24, 2005, Chicago, Illinois, USA. Copyright 2005 ACM 1-59593-135-X/05/0008 ...$5.00.
∗
Philip S. Yu IBM T. J. Watson Res. Center
[email protected]
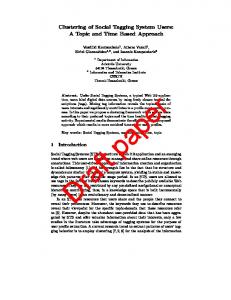
Real-life applications often pose additional challenges since data can be not only high-dimensional but also with related information spread across multiple relations. Few studies handle clustering across multiple relations. Consider a task of clustering students in a relational database based on their academic performance (as in the database shown in Figure 1). It may not be meaningful to cluster students based on the attributes like phone number, ssn, and residence address, even if they reside in the same relation. However, some crucial information, such as student’s registration, courses taken, and research publications, can be stored across multiple relations. Thus it is necessary to explore clustering across multiple relations. Based on the above observations, we introduce two new concepts: (1) user-guided clustering, and (2) cross-relational clustering. The necessity to introduce these two notions is obvious. First, a user often knows well the application requirements and data semantics. Thus a user’s guidance, even in a simple form such as clustering students based on their research areas, could be essential for effective highdimensional clustering. Second, crucial information is often stored across multiple relations, and it is difficult for a user to specify all pertinent information. For example, to cluster students according to their research areas (see Figure 1), most crucial information may be stored in several relations, such as Group, Advise, Course, and P ublication. To handle such a clustering task, we propose a new methodology, called cross-relational clustering with user’s guidance, or simply, CrossClus. This methodology explores how to specify and utilize user’s guidance in clustering and how to perform cross-relational clustering, i.e., partition the data objects into a set of clusters based on their similarity, utilizing information in multiple relations. Clustering in multi-relational environments has been studied in [7, 14, 15], in which the similarity between two objects are defined based on tuples joinable with them. However, there are two problems with such approaches. First, although they provide similarity definitions in multi-relational environments, it is usually very expensive to compute such similarities because an object is often joinable with hundreds or thousands of tuples. Second, there are usually a large number of candidate features in a database (such as in Figure 1), generated from different attributes with different join paths. They cover different aspects of information (e.g., research, grades, address), but only a small portion of them are pertinent to the user’s goal. However, all features are used indiscriminately in above approaches, which is unlikely to generate desirable clustering results.
Group name area
User Hint
Work-In person group
Target Relation
Professor name office position
Open-course course semester instructor
Advise professor student degree
Publish author title
Student netid name address phone
year
Publication name year conf
Course cid name area
Each candidate attribute may lead to tens of candidate features, with different join paths
Registration student course semester unit grade
Figure 1: Schema of the CS Dept database The above problem can be solved by semi-supervised clustering [12, 13, 21], in which a set of similar (or dissimilar) pairs of instances are provided by user. However, this requires a user to have good knowledge about the data and the clustering goal. Moreover, since different users have different clustering goals that can only be expressed by training data, and the complex information in multiple relations may overwhelm the user, it is very burdensome for a user to provide a high quality training set, which is critical to the clustering results. In this paper we propose a different approach. First, we remove the user’s burden of providing training data. In order to express her clustering goal, a user poses a clustering query that consists of a target relation and one or a small set of pertinent attribute(s). The target relation may join with each relation via different join paths, which leads to the generation of a huge number of “connected” features with diverse semantic meaning (see Figure 1). Our clustering task is to perform comprehensive analysis across multiple relations to select the set of pertinent features and derive high quality clustering that meets user’s expectation. Example 1. In the CS Dept database in Figure 1, the target relation is Student, and the goal is to cluster students according to their research areas. A user query for this goal could be “CLUSTER Student WITH Group.area”. Such a user guidance shows her preference in clustering. However, this guidance should not be treated as the specification of class label attribute as in classification or semisupervised clustering for the following reasons. First, a student may belong to multiple groups or may not be in any group if the student is new or prefers to work alone. Second, “group” may represent only one factor of “research area”. There are many other important factors, such as research publications, advisors, projects, and courses taken. Third, the guidance may serve only as a loose hint to the system since a nonexpert user may only have partial knowledge about the data, and thus may not even select the most important attributes in the query. Nevertheless, such a guidance plays a key role in our system since it will help the analyzer find other strongly correlated attributes across multiple relations. The crucial challenge in cross-relational clustering is how to select pertinent features for clustering in the huge feature space. In a database with nontrivial schema, there are usually a large number of candidate features. Since only a small number of them are pertinent to the clustering goal, a powerful technique for feature search is needed to select good features for clustering. There have been many approaches
for feature selection [4, 8, 18]. But they are mainly designed for classification or trend analysis instead of clustering. For example, two features with very different trends may actually cluster objects in similar ways (details in Section 2). To successfully perform user-guided clustering in multiple relations, CrossClus developed two new techniques: (1) effective feature selection according to how features cluster tuples, and (2) efficient search for pertinent features across interconnected relations. In cross-relational clustering each feature clusters target tuples by indicating similarities between them. Thus we introduce similarity vector, a new notion for representing a feature. For a feature f , its similarity vector V f contains the similarity between each pair of target tuples indicated by f . Vf is a vector of N 2 dimensions if there are N target tuples. The similarity vector of a feature indicates how it clusters target tuples, and the similarity between two such vectors indicates whether they cluster tuples in a similar way. It is a good measure for feature selection because it captures the essential information for clustering and provides a coherent way to compare different types of features (categorical and numerical). However, it is very expensive to materialize the similarity vectors and compute feature similarity based on them. Thus we propose new methods that compute similarity between different types of features in linear time, without materializing the similarity vectors. With a good measure for selecting features, CrossClus needs to search for pertinent features across many interconnected relations. Because of the huge feature space, it is impossible to perform exhaustive search, and heuristic algorithms must be used. Two principles are followed by CrossClus in feature search: (1) start from the userspecified attribute and gradually expand the search scope to other relations, and (2) the search must be confined in promising directions to avoid fruitless search. CrossClus finally selects a set of highly pertinent and non-redundant features for clustering. The k-medoids algorithm is selected for clustering target tuples due to its high scalability and applicability in non-Euclidean space. Our experiments on both real and synthetic data sets show that CrossClus successfully identifies pertinent features for each clustering task, which validates the effectiveness of our approach for searching and selecting features. It also shows the high efficiency and scalability of CrossClus even for databases with complex schemas. The remaining of the paper is organized as follows. The problem definition is introduced in Section 3. Section 4 describes the approach for feature search, and Section 5 presents the approach for clustering tuples. Experimental results are presented in Section 6. We discuss the future extensions in Section 7 and conclude the study in Section 8.
2.
RELATED WORK
Clustering has been extensively studied for decades in different disciplines including statistics, pattern recognition, database, and data mining. There are mainly two categories of clustering approaches: (1) probability-based approaches [3], and (2) distance-based approaches [16, 11]. Many other approaches have been proposed recently that focus on the efficiency and scalability issues (e.g., [19]). Traditional clustering approaches may not generate good clusters in high dimensional space. Subspace clustering [1, 2, 6] was proposed to address this problem, in which each
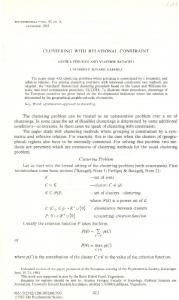
cluster is defined based on a subset of dimensions. However, when there are a large number of features with very different semantic meanings, subspace clustering may generate many clusters with different semantic meanings, and only a small set of them fit the user’s goal. In contrast, CrossClus explores the concept of user-guided clustering: It selects a set of pertinent features according to user guidance and then performs clustering with them, which leads to more meaningful clustering results. Clustering in multi-relational environments has been studied in [7, 14, 15]. When computing similarity between two tuples, they consider not only the attributes of the two tuples, but also those of the tuples related to them (joinable via a few joins) [5, 7]. However, these approaches suffer from poor efficiency and scalability, because in a large database an object is often joinable with thousands of tuples via a few joins, which makes it very expensive to compute similarity between each pair of objects. Moreover, they use all features indiscriminately and may not generate good clustering results that fit the user’s goal. Semi-supervised clustering [12, 13, 21] also performs clustering under user’s guidance. The user guidance is provided either as a set of similar (or dissimilar) pairs of instances [12, 21] or by relevance feedback [13]. Such guidance is either used to reassign tuples [12] to clusters or to wrap the space to generate better models [21]. However, it is burdensome for each user to provide such training data, and it is often difficult to judge whether two tuples belong to same cluster since all relevant information in many relations needs to be shown to user. In contrast, CrossClus allows the user to express the clustering goal with a simple query containing a pertinent attribute, and will search for more pertinent features across multiple relations. Selecting the right features is crucial for cross-relational clustering. Although feature selection has been extensively studied for both supervised learning [8] and unsupervised learning [4, 18], the existing approaches may not be appropriate for cross-relational clustering. The widely used criteria for selecting numerical features include Pearson Correlation [9] and least square error [18]. However, such criteria focus more on trends of features, instead on how they cluster tuples. For example, consider the 80 tuples shown in Figure 2, with their values on two features. According to the above criteria, the two features have correlation of zero. If we cluster the tuples into 8 clusters according to each feature, feature 1 will create clusters {t1 , . . . , t10 }, . . ., {t71 , . . . , t80 }, feature 2 will create {t1 , . . . , t5 , t76 , . . . , t80 }, . . ., {t36 , . . . , t40 , t41 , . . . , t45 }. If two tuples belong to same cluster according to feature 1, they have half chance to belong to same cluster according to feature 2, and vice versa. One can see that feature 1 and feature 2 actually cluster tuples in rather similar ways, although they are “uncorrelated” according to some correlation measures. For categorical features, the most popular criteria include information gain [17] or mutual information [8]. However, it is difficult to define information gain or mutual information for multi-relational features, because a tuple has multiple values on a feature.
3. PROBLEM DEFINITION 3.1 User Queries CrossClus accepts user queries that contain a target relation, and one or a small set of pertinent attribute(s). Con-
feature value
feature 1 feature 2
t1
t20
t40
t60
t80 tuple
index
Figure 2: Two “uncorrelated” features sider the query “CLUSTER Student WITH Group.area” in Example 1 that aims to cluster students according to their research areas. Student is the target relation Rt , and Group.area is the pertinent attribute. Since the pertinent attribute provides crucial but very limited information for clustering, CrossClus searches for other pertinent features, and groups the target tuples based on those features. Different relations are linked by joins. As in some other systems on relational databases (such as DISCOVER [10]), only joins between keys and foreign-keys are considered by CrossClus. Other joins are ignored because they do not represent strong semantic relationships between objects. Due to the nature of relational data, CrossClus uses a new definition for objects and features, as described below.
3.2
Multi-Relational Features
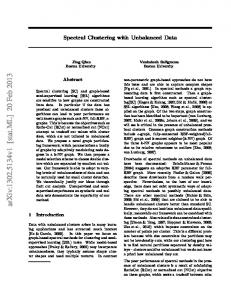
A multi-relational feature f is defined by a join path Rt ./ R1 ./ · · · ./ Rk , an attribute Rk .A of Rk , and possibly an aggregation operator (e.g., average, count, max). f is formally represented by [f.joinpath, f.attr, f.aggr]. A feature f is either a categorical feature or a numerical one, depending on whether Rk .A is categorical or numerical. For a target tuple t, we use f (t) to represent t’s value on f . We use Tf (t) to represent the set of tuples in Rk that are joinable with t, via f.joinpath. Courses taken by students Student
#Courses in each area DB
AI
TH
t1
4
4
0
t2
0
3
7
t3
1
5
4
t4
5
0
5
t5
3
3
4
Values of Feature f
f(t1) f(t2)
DB
f(t3)
AI
f(t4)
TH
f(t5)
Figure 3: A feature of areas of courses taken by students If f is a categorical feature, f (t) represents the distribution of values among Tf (t). Suppose f.attr has l values v1 , . . . , vl . f (t) is an l-dimensional vector (f (t).p1 , . . . , f (t).pl ), with f (t).pi representing the proportion of tuples in Tf (t) having value vi . For example, suppose Student is the target relation in the CS Dept database. Consider a feature f = [Student ./ Register ./ OpenCourse ./ Course, area, null1 ] (where area represents the areas of the courses taken by a student). An example is shown in Figure 3. A student t1 takes four courses in database and four in AI, thus f (t1 ) = (database:0.5, AI:0.5). In general, f (t) represents t’s relationship with each value of f.attr. The higher f (t).pi is, the stronger the relationship between t and vi is. This vector is usually sparse and only non-zero values are stored. t1 t2 t3 t4 t5 Values of h(t) 3.1 3.3 3.5 3.7 3.9 feature h Figure 4: A feature of students’ average grades
If f is numerical, then f has a certain aggregation operator (average, count, max, . . . ), and f (t) is the aggregated value of tuples in the set Tf (t), as shown in Figure 4. 1
which means no aggregation operator is used in this feature.
When searching for pertinent features during clustering, both categorical and numerical features need to be represented in a coherent way, so that they can be compared and pertinent features can be found. In clustering, the most important information carried by a feature f is how f clusters tuples, which is conveyed by the similarity between tuples indicated by f . Thus in CrossClus a feature is mainly represented by the similarity vector, as defined below. Definition 1. (Similarity Vector) Suppose there are N target tuples t1 , . . . , tN . The similarity vector of feature f , f Vf , is an N 2 dimensional vector. ViN +j represents the similarity between ti and tj indicated by f . The similarity vector of feature f in Figure 3 is shown in Figure 5. The two horizontal axes are tuple indices, and the vertical axis is similarity. The similarity vector of a feature represents how it clusters target tuples. It contains the most important information for feature selection in clustering, and is used for identifying pertinent features according to user guidance. Similarity vector Vf
1 0.9
0.5-0.6
0.8
0.4-0.5
0.7
0.3-0.4
0.6 0.5
5
0.4 0.3 0.2 0.1 0
4
0.2-0.3 0.1-0.2 0-0.1
3 5
2
4 3 1
2 1
Figure 5: Similarity vector of a feature
4. FINDING PERTINENT FEATURES In this section we first describe the similarity measure between features, then introduce our approach for feature searching based on user’s guidance.
4.1 Similarity between Features Given the user guidance, CrossClus selects pertinent features based on their relationships to the feature specified by user. To achieve this goal, we should compare features to find pertinent features but avoid redundant ones. Features should be compared based on how they cluster target tuples. If two features cluster tuples in a similar way, they should be considered to be related to each other; and vice versa. Similarity between two features are measured based on their similarity vectors, which represent the ways they cluster tuples. If two features cluster tuples very differently, their similarity vectors are very different, and their similarity is low. If they cluster tuples in almost the same way, their similarity is very high, which indicates that they contain redundant information. In general, the similarity between features gives us good hints about the relationship between them. Moreover, although different types of features contain different formats of information that is hard to compare directly, we can define similarity between them in a coherent way as long as we know their similarity vectors.
4.1.1
Tuple Similarity for Categorical Features
In CrossClus a categorical feature does not simply partition the target tuples into disjoint groups. Instead, a target tuple may have multiple values on a feature, as defined in Section 3.2. Consider a categorical feature f that has
l values v1 , . . . , vl . A target tuple t’s value on f is a vector (f (t).p1 , . . . , f (t).pl ). f (t).pi is the proportion of tuples joinable with t (via f.joinpath) that have value vi on f.attr, which represents the probability that t is related to vi . The similarity between two tuples t1 and t2 w.r.t. f is defined as the probability that ti and tj is related to the same value on f . An example is shown in Figure 6. Definition 2. The similarity between two tuples t1 and t2 w.r.t. f is defined as l X f (t1 ).pk · f (t2 ).pk (1) simf (t1 , t2 ) = k=1
f(t1)
f(t5) simf(t1,t5) = 0.5·0.3+0.5·0.3 = 0.3
Figure 6: Tuple similarity of categorical features There are other measures for defining similarity between two probabilistic distributions, such as KL-distance (or relative entropy), or cosine similarity between the two distribution vectors. However, such measures focus on the similarity of the two distributions, instead of the properties of the two objects. For example, suppose we are clustering students according to their research areas. If students t1 and t2 both have probability of 0.5 to take courses in DB area and 0.5 in AI area, then their similarity is 1 according to KL-distance or cosine similarity. But actually it is quite possible that one is in DB area and the other is in AI area. If t1 has probability 1.0 in DB, and t2 has 0.7 in DB and 0.3 in AI, then it is more likely they are in the same area although their similarity is not high according to KL-distance or cosine similarity. We choose a simple but appropriate measure—the probability that t1 and t2 take courses in same area, which better represents the relationship between tuples w.r.t. a feature.
4.1.2
Tuple Similarity for Numerical Features
Different numerical features have very different ranges and variances, and we need to normalize them so that they have equal influences in clustering. For a feature h, similarity between two tuples t1 and t2 w.r.t. h is defined as follows. Definition 3. Suppose σh is the standard deviation of tuple values of numerical feature h. The similarity between two tuples t1 and t2 w.r.t. h is defined as |h(t1 ) − h(t2 )| , if |h(t1 ) − h(t2 )| < σh ; simh (t1 , t2 ) = 1 − σh 0, otherwise. (2) That is, we first use Z score to normalize values of h, so that they have mean zero and variance one. Then the similarity between tuples are calculated based on the Z scores. If the difference between two values is greater than σh , their similarity is considered to be zero.
4.1.3
Similarity between Features
When clustering tuples, a feature is used to indicate the relationship between each pair of tuples. CrossClus represents a feature f by the similarities between tuples indicated by f . Suppose there are N target tuples t1 , . . . , tN . f is f represented by its similarity vector Vf (in which ViN +j = simf (ti , tj )). When measuring the similarity between two features f and g, we compare their similarity vectors V f and Vg , which
represent how they cluster tuples. The similarity between two features is defined as the cosine similarity between their similarity vectors. This definition can be applied on both categorical and numerical features. Definition 4. The similarity between two features f and g is defined as2 Vf · Vg sim(f, g) = (3) |Vf | · |Vg | √ in which |Vf | = Vf · Vf .
sim(f, g) = 1 if and only if Vf and Vg differ by a constant ratio, and sim(f, g) is small when most pairs of tuples that are similar according to f are dissimilar according to g. Figure 7 shows the values of two features f = [Student ./ Register ./ OpenCourse ./ Course, area, null] (areas of courses taken by each student) and g = [Student ./ W orkIn, group, null] (research group of each student). Their similarity vectors Vf and Vg are shown in Figure 8. To compute sim(f, g), one needs to compute the inner product of Vf and Vg , as shown in Figure 8. t ID 1 2 3 4 5
Feature f DB AI 0.5 0.5 0 0.3 0.1 0.5 0.5 0 0.3 0.3
TH 0 0.7 0.4 0.5 0.4
Feature g Info sys Cog sci 1 0 0 0 0 0.5 0.5 0 0.5 0.5
t ID 1 2 3 4 5
Theory 0 1 0.5 0.5 0
Figure 7: The values on two features f and g Vg
Vf 1 0.9
1 0.9 0.8 0.7 0.6 0.5
5
0.4 0.3 0.2 0.1 0
4 3 5
2
4 3
0.8 0.5-0.6 0.7 0.4-0.5 0.6 0.3-0.4 0.5 0.2-0.3 0.4 0.1-0.2 0.3 0-0.1 0.2
0.5-0.6 0.4-0.5 0.3-0.4 0.2-0.3 1
0.1-0.2 0-0.1
2
0.1 3
0 1
4
2 3
1
2 1
5
4 5
Figure 8: Inner product of Vf and Vg
4.1.4
Efficient Computation of Feature Similarity
The similarity between features is expensive to compute, if directly following the definition. We cannot even afford storing N 2 dimensional vectors for many applications. An efficient algorithm is needed to compute sim(f, g) without materializing Vf and Vg . We first describe the approach for computing similarities between categorical features. The main idea is to convert the hard problem of computing inner product of two similarity vectors of N 2 dimensions, into an easier problem of computing similarities between feature values, which can be solved in linear time. Figure 9 shows an example, in which seven tuples are connected to different feature values. Similarities between tuples are defined according to their relationships with the feature values, as in Definition 2. The similarities between feature values can be defined similarly according to their relationships with tuples. Definition 5. The similarity between value vk of feature f and value vq of feature g is defined as 2
Most clustering algorithms group tuples that are relatively similar, instead of considering absolute similarity values. Thus we use cosine similarity to ignore magnitude of similarity values.
sim(f.vk , g.vq ) =
N X i=1
Feature f
f (ti ).pk · g(ti ).pq
Tuples
(4)
Feature g
DB
Info sys
AI
Cog sci
TH
Theory
Figure 9: An example of tuples and feature values The definitions of tuple similarity and feature value similarity are similar and symmetric to each other. Because of the symmetric definitions, we can convert the inner product of Vf and Vg from summation of tuple similarities into that of feature value similarities. Lemma 1. Vf · Vg
N X N X
=
i=1 j=1
l X m X
=
simf (ti , tj ) · simg (ti , tj ) sim(f.vk , g.vq )2
(5)
k=1 q=1
With Lemma 1, to compute the similarity between f and g, we only need to compute sim(f.vk , g.vq ) for each value vk of f and vq of g. We can compute them by scanning the tuples just once. For each tuple t, we get f (t) and g(t). For each value vk so that f (t).vk > 0, and each vq so that g(t).vq > 0, we update sim(f.vk , g.vq ) by adding f (t).vk · g(t).vq . In this way sim(f.vk , g.vq ) (1 ≤ k ≤ l, 1 ≤ q ≤ m) can be computed in one scan. This requires an entry in memory for each sim(f.vk , g.vq ). In reality most categorical features have only several or tens of values. If f has too many values, CrossClus will make an indexed scan on f (scanning tuples having each value of f ), and it only needs to maintain an entry for each value of g. In general, V f ·Vg can be computed in linear time, with very limited extra space. A different approach is needed for computing similarities involving numerical features, because of the different definitions of tuple similarities. Consider the numerical feature h in Figure 4, whose similarity vector Vh is shown in Figure 10. For simplicity we assume that t1 , . . . , tN are sorted according to h. Vh
2 1.8 1.6 1.4 1.2
0.8-1 0.6-0.8
1
0.4-0.6
0.8
0.2-0.4 0-0.2
0.6 0.4 5
0.2 0 5
3 4
3
1
2 1
Figure 10: Similarity vector of feature h As mentioned above, it is expensive to directly compute the inner product of two N 2 dimensional vectors Vh and Vf . Again we try to convert this problem into a problem that can be solved in linear time. From Section 4.1.2 one can see that only tuples whose values differ by at most σ (standard deviation) have non-zero similarity with each other. When we scan tuples in order of h, only a subset of tuples need to be considered when scanning each tuple. The main idea of our algorithm is to decompose Vh · Vf into two parts, so that one part only depends on each tuple, and the other part
contains some statistics of the previously scanned tuples, which can be maintained incrementally. In this way V h · Vf can be computed by one scan. Because of the symmetric definition of tuple similarity, sim(ti , tj ) = sim(tj , ti ) for any feature. Let η(i) represent the minimum index j so that h(ti ) − h(tj ) ≤ σ. As i increases when scanning tuples, η(i) either increases or stays the same. Thus we can find all tuples with h(ti ) − h(tj ) ≤ σ by maintaining two pointers on ti and tη(i) . We have i−1 N X X Vh · Vf = 2 simh (ti , tj ) · simf (ti , tj ), (6) i=1 j=η(i)
which can be efficiently computed with Lemma 2. Lemma 2. Vh · Vf can be computed as follows V ⋅V h
f
= 2∑ N
i =1
l f (ti ). p k ⋅ f (t j ). p k ∑ 1 − (h(ti ) − h(t j )) ∑ k =1 j =η (i ) i −1
[
]
l N l N i −1 i −1 = 2 ∑ ∑ f (t i ). p k (1 − h (t i )) ∑ f (t j ). p k + 2 ∑ ∑ f (t i ). p k ∑ h (t j )⋅ f (t j ). p k = = = = i =1 k =1 j i k i j i η ( ) 1 1 η ( )
Only depend on ti
Statistics of tj with j