curacy prediction system could act as a filter to select pages for manual keying, effectively bypassing the OCR process with a post-editing process, and thus.
J. Gonzalez, J. Kanai, and T.A. Nartker, \Prediction of OCR Accuracy Using a Neural Network," accepted to appear in Document Analysis Systems II, (J.J. Hull and S.L. Taylor, editors), copyright 1997 World Scienti c Publishing Co. Pte Ltd.
PREDICTION OF OCR ACCURACY USING A NEURAL NETWORK J. GONZALEZ, J. KANAI, T. A. NARTKER Information Science Research Institute University of Nevada, Las Vegas Las Vegas, NV, 89154-4021, USA
A method for predicting the accuracy achieved by an OCR system on an input image is presented. It is assumed that there is an ideal prediction function. A neural network is trained to estimate the unknown ideal function. In this project, multilayer perceptrons were trained to predict the character accuracy performance of two OCR systems using the backpropagation training method. The results show that this approach is sound. The feasibility of using an accuracy prediction system as a lter to discriminate good quality images (for OCR) from poor quality images (for manual keying) was also examined using a cost model of a large-scale document conversion process. Results show that a prediction system can reduce the total cost of converting a set of documents.
1 Introduction In general, the character accuracy on a given page image processed by an OCR system is determined by comparing the OCR output with the groundtruth data. In the real world, however, the corresponding ground truth data are not available. Thus, other ways to predict the potential OCR accuracy on a given page image are needed. The performance of OCR systems is a�ected by a combination of image degradation, typographical di�culties, and linguistic di�culties. Studies have shown that OCR systems can achieve character accuracy rates better than 99% for high quality page-images; however, the rates vary widely for low quality page images.1 The most important sources of OCR problems appear to be touching and broken characters.2 3 These results suggest that the character accuracy of a page image might be predicted by measuring features associated with its image quality. Typographical di�culties include unusual typefaces and artistic typesetting, such as mixed fonts in a paragraph, e.g. a ransom note. To detect these kinds of OCR di�culties, typeface recognition algorithms 4 must be utilized. Some di�culties are caused by problems of linguistics rather than by distorted images. For example, a list of proper names, a list of part numbers, a numerical table, and computer source code listings make the use of lexicons di�cult. It is not clear how these drawbacks can be measured from a given text image alone. ;
1
Accuracy prediction systems would be useful in a variety of ways. One study showed that keying documents is more cost e�ective than editing the corresponding OCR-generated text unless, on average, a minimum character accuracy of 95-98%, depending on document complexity, is achieved.5 An accuracy prediction system could act as a lter to select pages for manual keying, e�ectively bypassing the OCR process with a post-editing process, and thus achieving substantial cost savings. Algorithms for estimating OCR accuracy using features associated with image degradation would also be bene cial for other applications. Such algorithms could be used to automatically select candidates for the image restoration and to determine the improvement (or degradation) made by an image restoration algorithm. Moreover, automated identi cation of the types of image defects in images would also be essential to select appropriate models for the image restoration processes. Predicting OCR accuracy and estimating image quality would also be essential to the operation of adaptive OCR systems. The OCR accuracy information would be used to avoid egregious errors, such as replacing proper names and abbreviations by words from a lexicon. Similarly, estimated image quality information could be used to choose an appropriate classi er or weights for combining the results obtained from a set of classi ers. In this paper, we develop a new prediction method to overcome the shortcomings of the previously developed method.6 The de ciencies will be discussed in the next section. The new approach uses a perceptron with two hidden layers and seven features associated with the degradation of English text images. Neither typographical nor linguistic di�culties are measured. In order to limit the scope of the research, the following assumptions are made:
� Pages are printed in black and white (no color). � Page images have been segmented, and text regions have been correctly identi ed. Features are extracted from text regions only.
A cost model of a large-scale document conversion process is introduced and utilized to study the e�ectiveness of the proposed method.
2 Previous Work and New Design Goals Blando introduced a rule-based accuracy prediction system.6 This system predicts whether the OCR accuracy of a page image achieved by a given OCR system will exceed a predetermined accuracy threshold value. Three features associated with image defects and three heuristic rules were used. A page 2
image is classi ed as good if its predicted accuracy exceeds 90%. Otherwise, the image is classi ed as bad. The heuristic rules were designed to minimize misclassi cation of degraded images as good. Some shortcomings of this approach were identi ed, and new design goals have been established. The rst problem was that the features used in the system are sensitive to font size. They were able to detect broken characters and thick characters, but no feature for directly detecting touching characters was provided. Thus, new features are needed to overcome these de ciencies. Image degradation and some typographical e�ects, such as a colored background, are often not uniform over an entire page. It is necessary to extract information from each zone rather than from the entire image. A new classi er is designed to predict the OCR accuracy of a given zone image, and the OCR accuracy of a page is estimated by combining the accuracy of zones on the page. The prediction system was trained to make a binary decision, which is either good or bad, according to an accuracy threshold value. To make a new system more exible, it is designed to output a numerical value between 0.0 and 1.0 corresponding to the estimated OCR accuracy of a given zone. The previous results show that the image-based approach does not work well with pages containing numerical tables and/or fewer than 200 connected components. Therefore, the new classi er is also designed to reject these types of zones.
3 Prediction Method 3.1 Neural Network-Based Prediction Let's assume there is an ideal predictor f () that correctly predicts the OCR accuracy of a given zone achieved by an OCR system X, OCR X, using the ideal feature vector x obtained from the zone and the knowledge of OCR X.
(1) OCR Accuracy = f (x; OCR X ) The goal is to approximate this unknown function f () using a neural network. Since a set of ideal features is unknown, features associated with image defects, which are probably a subset of the ideal features, are used to form a feature vector x . Let the i-th labeled training sample be (x ; y ) where y is a label that is the OCR accuracy achieved by OCR X. Thus, the knowledge of a particular OCR system is captured by the labels, and a neural network is trained to predict 3 0
0 i
i
i
Height
I
X
t i
x
Broken Characters ,
_
0
Width
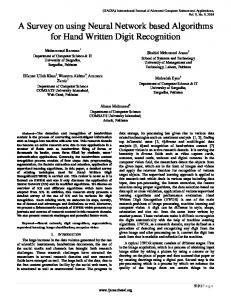
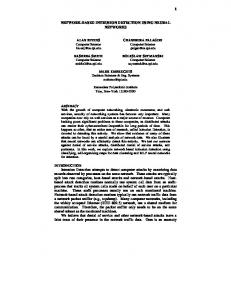
Figure 1: Distribution of connected components. The X-zone contains upper case letters, characters with descenders, etc. The x-zone contains x-height characters. The hyphen-zone consists of hyphens, underlines, fragments of mathematical symbols. The I-zone is composed of narrow tall symbols. The t-zone contains \t"s. The i-zone contains the stems of \i"s, and the comma-zone contains punctuation marks.
the performance of an OCR system. This is a modeling problem, a perceptron with the backpropagation training method is used in this project.7 8 ;
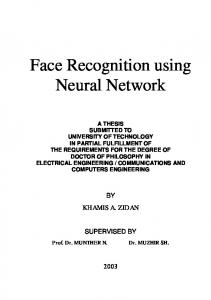
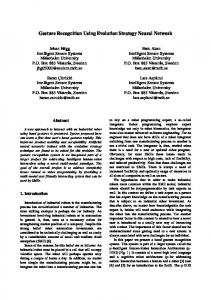
3.2 New Features Seven features associated with image defects are selected to overcome the de ciencies of the old feature set. Some features are revised versions of old ones, and others are newly selected. To measure the number of broken characters in a text zone, the Broken Character Factor (BCF ) was de ned. In general, the sizes and shapes of character fragments vary widely, and their bounding rectangles have many di�erent widths and heights. In a 2-D feature space of both width and height, the bounding rectangles corresponding to broken characters tend to cluster near the origin. Thus, this region was de ned as the broken character zone as shown in Figure 1. To eliminate the e�ect of font sizes, the mean height and the mean width of bounding rectangles are used as a reference point as shown in Figure 2. Since small symbols and symbol parts, such as a comma and the dot on the \i", also fall in the broken character zone as shown in Figure 1, a densitybased measurement, which is sensitive to the distribution of characters in a zone image, cannot be used to determine the degree of brokenness. Thus, the BCF measures the area coverage rather than the density.
4
Height Reference Point 100% 75%
Broken Character Zone
75% 100% Width
Figure 2: Normalized Broken Character Zone.
The broken character zone is divided into cells, at a rate of one per square pixel. The bounding rectangles of connected components are assigned to these cells according to their height and width. The BCF is calculated as BCF = #CellsOccupied (2) #Cells The minimum BCF value required to detect a high degree of brokenness is proportional to the number of characters in the zone image. Thus, the number of black connected components (#BlackCCs) is also selected as a feature to estimate the number of characters in a zone. Poor photocopying or digitization often causes vertical fragmentation of characters as shown in Figure 3. Since the height of such a fragment is equal to the height of the original character, such fragments do not fall in the Broken Character Zone. The vertical brokenness also causes broken loops in letters, such as a broken \e" or \D" shown in Figure 3, so the number of white CCs also decreases. Based on this observation, the Vertical Brokenness Factor (VBF) is de ned as WhiteCCs V BF = # (3) #BlackCCs Another feature attempts to capture the thickness of character strokes. As shown in Figure 4, the median horizontal black run-length is used as the stroke width of a character. Since the de nition of thick is relative to a given font size, the value is normalized by the height of the character. The Stroke Thickness Factor (STF) is de ned as 5
Figure 3: Example of text zone with vertical fragmentation (linearly magni ed). Black Run-Lnegth 7 2 2 6
Median = 2
2 2 7
Figure 4: Procedure for calculating the thickness of character strokes.
STF =
P #NormalizedStrokeWidth
(4) #BlackCCs Thick strokes caused by image degradation often close the loops in letters, such as \a" and \e", completely or partially. Such deformation often causes OCR errors. Partially closed loops can be detected by identifying small white connected components. Since the de nition of small is relative to a given font size, the height of the character (black CC) is used in a normalization process. Based on the results obtained from training data, a white connected component is classi ed as small if its height is less than one tenth of the height of the surrounding black connected component. The White Speckle Factor (WSF) is de ned as
WSF = #SmallWhiteCCs #WhiteCCs
(5)
Since WSF cannot detect extremely thick strokes that completely close loops, another feature was de ned. The black density of a character is calculated as the ratio of the number of black pixels to the total number of pixels in its bounding rectangle. Based on results obtained from the training data, 6
BOOK
Figure 5: A black connected component formed by a set of touching characters. This example has four holes.
a character (black connected component) is classi ed as fat (FatCC) if its density exceeds 0.75. The Black Density Factor (BDF) is de ned as FatCCs BDF = ##BlackCCs (6) Since thick strokes may not cause touching characters, another feature for detecting touching characters is needed. As shown in Figure 5, a set of touching characters often has two or more holes (loops). This phenomenon is easily detected by counting the number of white connected components in a black connected component. Since very few characters in the English alphabet normally have two inside holes, such as \8" and \B", any black connected component containing more than two white connected components is a candidate for a set of touching characters. Based on this observation, the Touching Character Factor (TCF) is de ned as TCF = #TouchingCharacterCandidates (7) #BlackCCs 3.3 Implementation Two sets of page images were used to prepare training data. The rst set of images is called Set-1 and consists of 396 text zones obtained from a collection of scienti c and technical document pages. Almost all images are of good quality. The second set of images is called Set-2 and contains a total of 466 zones, 396 zones from the Set-1 images and 70 zones hand-picked from a collection of signi cantly degraded page images. This set is used to study if additional bad quality images will improve the performance of a prediction system. For each zone, the seven feature values, described in Section 3.2, were measured by programs written in C++, and the OCR accuracy achieved by two OCR systems, identi ed as OCR-A and OCR-B, was calculated. (The OCR systems used but not identi ed with the results are ExperVision RTK and Xerox OCR Engine.) Therefore, a total of four sets of labeled training samples were prepared.
7
In this project, a multilayer perceptron with two hidden layers containing seven neurons each was used to build a prediction engine. Matlab and Neural Network Toolkit were used to implement a neural network. Seven feature values, de ned in Section 3.2, obtained from the input text-zone, form an input feature vector x for this neural network. The output y, 0 � y � 1, is a predicted accuracy for the input text-zone. The backpropagation learning method was used to train the neural net. After training a neural net, the trained weights were used to de ne a single weighted prediction function. Epoch is de ned as an entire pass throughout all of the input training vectors.9 The number of epochs required to train a neural network depended on the OCR system. A convergence was obtained at 12,000 epochs for OCR-A and 5,000 epochs for OCR-B. To predict the OCR accuracy on a given page, the number of black connected components in a zone is used to approximate the number of characters it contains. (For clean pages, this method usually overestimates the number of characters.) The following procedure combines predicted OCR accuracy for each zone and estimates the OCR accuracy of the page.
f
for each zone in the input page total += #BlackCCs * EstimatedAccuracyValue; sum += #BlackCCs;
g
PageAccuracy = total / sum;
4 Cost Model To evaluate the performance of new prediction systems, a simple cost model of a large-scale document conversion process was developed. A printed document can be converted into a text le by manual keying or by using an OCR system. The average cost of keying a character is determined by a typist's skills, the cost of spell checking, and the cost of proofreading. Similarly, an average cost of correcting an OCR error is determined by the cost of correcting zoning errors, the cost of correcting marked errors, and the cost of correcting unmarked errors (proofreading). The total cost, C , of converting a set of documents by the keying method can be approximated by k
C =��N 8 k
c
(8)
where � is the average cost of keying a character and N is the total number of characters in a set of documents. Although correcting unmarked errors is more expensive than correcting marked errors, it is assumed that correcting any error is equally expensive. The total cost, C , of converting a set of documents using an OCR system with post processing can be approximated by c
o
C = �N (9) where is the average cost of correcting an OCR error and N is the total number of errors produced by the OCR system. An accuracy prediction system can be used to automatically select an appropriate data entry method for a given document, and the total cost of converting a set of documents can be reduced. Images classi ed as good will be processed by an OCR system while images classi ed as poor will be keyed. The total cost, C , of converting a set of documents using this approach can be approximated by o
e
e
p
C =��P + �G (10) where � is the average cost of keying a character, P is the total number of characters in images classi ed as poor, is the average cost of correcting an OCR error, and G is the total number of OCR errors in images classi ed as good. Dickey showed that the manual keying method is more cost e�ective unless an OCR system achieves an average of 95 to 98% accuracy, depending on layout complexities.5 This study suggests that is 20 to 50 times more expensive than �. Therefore, in this project, � is xed to 1, and is treated as a variable taking values between 10 and 100, in increments of 10. An accuracy threshold value T for classifying an image as either good quality or poor quality depends on a given value of . Compared to entering 100 characters by hand, the OCR approach is more cost e�ective as long as the total number of OCR errors is fewer than 100 � �= . Therefore, the lowest average accuracy percentage that makes this approach cost e�ective is calculated as LowestAveAccuracy = 100 ? 100 � � (11) Since a method for choosing an optimal accuracy threshold value T that minimizes the total cost of converting a given set of documents has not been developed, the lowest average accuracy required by a given will be used as 9 p
the accuracy threshold value. If C is cheaper than both C and C for a given , then using an accuracy prediction system is the most cost e�ective way to convert a given set of documents. p
k
o
5 Results and Analysis The test data set consists of 502 pages extracted from a collection of scienti c and technical documents. Since it is assumed that zones containing numerical tables and/or fewer than 200 connected components will be rejected by a prediction system, these test pages do not contain such zones. Almost all images in the test set are of good quality. The test set was used to evaluate the performance of the following ve systems.
� System-1A: a prediction system trained using the Set-1 images processed � � � �
by OCR-A. System-1B: a prediction system trained using the Set-1 images processed by OCR-B. System-2A: a prediction system trained using the Set-2 images processed by OCR-A. System-2B: a prediction system trained using the Set-2 images processed by OCR-B. System-H: the old heuristic-based classi er.
Tables 1 and 2 summarize errors made by the systems in predicting the performance of OCR-A and OCR-B, respectively. Since System-H was designed to classify pages using an accuracy threshold value of 90(%), the same threshold value was used by other systems to classify a given image as either good or poor. As shown in Tables 1 and 2, the additional training samples helped the neural networks to predict OCR accuracy below 90% for both OCR systems. At the same time, the networks underestimated the accuracy of some images. The results indicate that the neural networks need additional training samples to model the ideal classi er more accurately. Since the Set-2 training set consists of good quality images and signi cantly degraded images, adding mediocre quality images to the training set is expected to be the most e�ective way of re-training the neural networks. It is also necessary to experiment with di�erent neural network architectures, i.e., the number of layers and the number of neurons per layer, to develop a better prediction system. 10
Table 1: Predictions of the performance of OCR-A.
System-1A System-2A System-H Prediction Prediction Prediction poor good poor good poor good poor 6 10 9 14 10 60 good 5 481 2 477 1 431 True
Table 2: Predictions of the performance of OCR-B.
System-1B System-2B System-H Prediction Prediction Prediction poor good poor good poor good poor 2 3 5 19 5 65 good 3 494 0 478 0 432 True
Total Conversion Cost
1200000 Fixed
1000000
Variable 800000 600000 400000 200000
100
60 70 80 90
30 40 50
0 10 20
0
Cost of Correcting an OCR Error
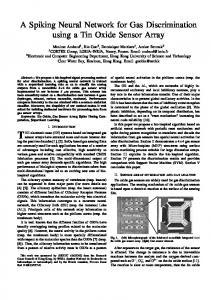
Figure 6: The total conversion costs using System-1A with a xed threshold method (T = 90) and a variable threshold method.
11
Table 3: The total costs, Cp , of converting the test data set using the following methods: keying only, OCR only, selecting pages for OCR using System-1A, System-2A, System-H, and the ideal prediction system, respectively. ( is an average cost of correcting an OCR error, and T is an accuracy threshold for using the OCR-A.)
10 20 30 40 50 60 70 80 90 100
T 90 95 97 98 98 99 99 99 99 99
Keying 1174376 1174376 1174376 1174376 1174376 1174376 1174376 1174376 1174376 1174376
OCR 154439 308878 463318 617757 772197 926636 1081076 1235515 1389955 1544394
Cost C Sys-1A Sys-2A 147665 153923 239632 242541 309198 312366 375986 385246 427246 437306 503171 500735 541811 538065 580451 575395 619091 612725 657731 650055 p
Sys-H 233914 286094 338274 390454 442634 494814 546994 599174 651354 703534
Ideal 134544 277204 341725 380204 409394 446686 473586 500486 527386 554286
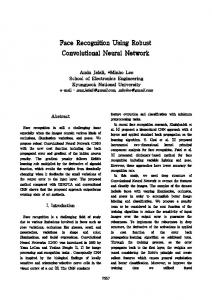
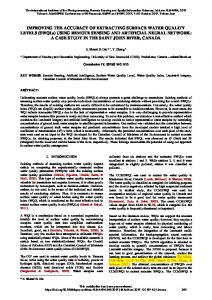
The confusion matrices of System-H show that the system minimized the number of poor quality images misclassi ed as good. Although the system misclassi ed over 60 pages of good quality images as bad, it met its speci cation. The page classi cation performance of the System-H is clearly worse than that of System-2B. Based on the overall accuracy, System-1A and System-1B are the best among their groups. The total conversion costs of the test images using the prediction systems were calculated based on the cost model presented in Section 4. Figure 6 shows the performance of System-1A using a xed threshold value of 90 and a variable threshold based on the value of . For large values of , adjusting the accuracy threshold value provides signi cant savings. Table 3 summarizes the total conversion costs for OCR-A. To calculate these costs, the prediction systems, except System-H, adjusted the accuracy threshold value according to a given value of . The OCR approach is the same as classifying all images as good, and the keying approach is the same as classifying all images as bad. The performance of the ideal prediction system was simulated by classifying the test images using the real accuracy values achieved by the OCR systems. Table 3 shows that using the prediction systems was more cost e�ective than using the keying approach and using the OCR approach for the given range of . The best system among the prediction systems depends on the 12
350000 Total Conversion Cost
300000 250000 200000 150000 100000 β=20
50000 0
90 91 92 93 94 95 96 97 98 99 Threshold Value
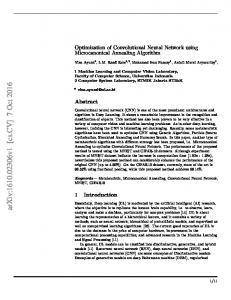
Figure 7: The total costs of converting the test set using the ideal prediction system for =20.
value of . Table 3 also shows that System-1A outperformed the ideal system for =20. Adding a few poor quality images to a large set of good quality images slightly reduces the average accuracy. If a new average accuracy is still better than the lowest acceptable average accuracy by the prediction approach, the total cost can be reduced. In other words, misclassifying a few poor quality pages as good could reduce the total conversion cost. Similarly, selecting a smaller threshold value could reduce a total conversion cost. In this case, choosing a threshold value of 91 rather than 95 minimizes the total conversion cost using the ideal prediction system as shown in Figure 7. Therefore, a more sophisticated method for selecting an accuracy threshold value must be developed. Table 4 shows that the OCR approach outperformed the prediction methods, except the ideal prediction method. Table 2 shows that these prediction systems misclassi ed some good quality pages as bad. Since the characters in the misclassi ed pages were keyed, the total costs increased. As the average cost of correcting an OCR error becomes cheaper, misclassifying good quality pages as bad becomes more costly. Using either System-1B or System-2B was 13
Table 4: The total costs, Cp , of converting the test data set using the following methods: keying only, OCR only, selecting pages for OCR using System-1B, System-2B, System-H, and the ideal prediction system, respectively. ( is an average cost of correcting an OCR error, and T is an accuracy threshold for using the OCR-B.)
10 20 30 40 50 60 70 80 90 100
T 90 95 97 98 98 99 99 99 99 99
Keying 1174376 1174376 1174376 1174376 1174376 1174376 1174376 1174376 1174376 1174376
OCR 145648 291297 436946 582594 728243 873892 1019540 1165189 1310838 1456486
Cost C Sys-1B Sys-2B 146462 166427 275591 271697 376984 372565 461892 457285 555082 524125 593521 610183 650371 661213 707221 712243 764071 763273 820921 814303 p
Sys-H 254304 326874 399444 472014 544584 617154 689724 762294 834864 907434
Ideal 143460 326807 426942 482736 515276 561093 589833 618573 647313 676053
cheaper than using the OCR approach and the keying approach for >= 20.
6 Conclusions and Future Work A new method for predicting the character accuracy of a page image processed by a given OCR system was presented. The task was de ned as a function approximation problem, and neural networks were trained to estimate accuracy from a given feature vector. Seven features associated with image defects were presented. In this project, multilayer perceptrons consisting of two hidden layers with seven neurons per layer were trained by the backpropagation method. Results showed that the trained neural networks were able to predict the character accuracy of a given page fairly accurately. However, their performance could be improved by:
� adding more training data, especially mediocre quality images, � experimenting with the number of layers and the number of neurons per layer,
� experimenting with new features. 14
The feasibility of using an accuracy prediction system as a lter to discriminate good quality images for OCR from poor quality images for manual keying was also examined using a cost model of a large-scale document conversion process. Results suggest that an accuracy system can act as a lter and reduce the total cost of converting a set of documents. Based on the cost model, misclassifying good quality pages as poor is more expensive than misclassifying poor quality pages as good. Selecting an appropriate accuracy threshold value for classifying the quality of page images is an open problem.
References 1. S.V. Rice, F.R. Jenkins, and T.A. Nartker, The Fourth Annual Test of OCR Accuracy, ISRI TR 95-04, University of Nevada, Las Vegas, April, 1995. 2. M. Bokser, \Omnidocument Technologies," Proceedings of the IEEE, Vol. 80, No. 7, pp. 1066-1078, 1992. 3. T.A. Nartker, et. al., A Preliminary Report on OCR Problems in LSS Document Conversion, ISRI TR 92-04, University of Nevada, Las Vegas, April, 1992. 4. A. Zramdini and R. Ingold, \A priori font recognition using a Bayesian classi er," TR 1994-04, Institute of Informatics, University of Fribourg, 1994. 5. L.A. Dickey, \Operational Factors in the Creation of Large Full-Text Databases," DOE INFOTECH Conference, Oak Ridge, TN, May 1991. 6. L.A. Blando, J. Kanai, and T.A. Nartker, \Prediction of OCR Accuracy Using Simple Image Features," Proc. ICDAR'95, pp. 319-322, 1995. 7. K. Hornik, M. Stinchcombe, and H. White, \Multilayer Feedforward Networks are Universal Approximators," Neural Networks, Vol. 2, pp. 359366, 1989. 8. J. Schurmann Pattern Classi cation A Uni ed View of Statistical and Neural Approaches, John-Wiley & Sons, Inc., 1996. 9. H. Demuth and M. Beale, Neural Network Toolbox For Use With Matlab, The Math Works, Inc., 1992.
15