intercept (t), rate (r), and asymptote (a). The equation is d' =a [1 - e-r(RT - 0] for values of RT greater than t; d' == 0 otherwise. The computation of the equation is.
Behavior Research Methods & Instrumentation 1981, Vo/.13 (6),753-754
PROGRAM ABSTRACTS/ALGORITHMS Curve fitting by estimation and iteration
I~ 2~
Je
LARRY HOCHHAUS
4~
5~ 6~ 7~
Oklahoma State University, Stillwater, Oklahoma 74078 and University of Oklahoma Health Science Center Oklahoma City, Oklahoma 73190
8~ 9~ 1~~
Il~
Finding the best-fitting equation for a set of data points is a common operation in evaluating scientific experiments. Straight lines are frequently established by estimating the position of the best-fitting line by eye. Using the method of linear regression, an exact function can be obtained that minimizes the vertical (dependent variable) squared deviations between the actual data points and their corresponding theoretical estimates. Often, these two techniques for fitting straight lines show close agreement. Curvilinear functions present a more difficult problem, but at times these may be converted to the linear case by choice of a suitable transformation on the dependent variable. This may not always be an easy operation. The widespread availability of small computer systems that include options for graphics presentation provides an added method for obtaining solutions to problems involving complex curves. The two BASIC programs developed to meet these needs were created using an Apple microprocessor with 48K RAM, but the programs can be adapted to work on other systems. The GRAPH program uses video graphics to display raw scores and the curve produced by an equation assumed to represent the data. Parameter values in the underlying equation may be changed to allow selection of the best-fitting curve by visual inspection. The ITERATION program may be used to find the equation that minimizes the sum of squared deviations between raw scores and estimates generated by the equation. A speed-accuracy tradeoff curve is used to illustrate the programs. The raw data in this example are six pairs of accuracy (d') and response speed (RT) scores for a single subject. While other mathematical models of the function relating speed and accuracy are available (e.g., McClelland, 1979), Wickelgren's (1977) equation was selected for use as a first approximation. This equation requires the estimation of three parameters, X· intercept (t), rate (r), and asymptote (a). The equation is d' =a [1 - e-r(RT - 0] for values of RT greater than t; d' == 0 otherwise. The computation of the equation is
Reprint requests should be mailed to Larry Hochhaus, Department of Psychology, Oklahoma State University, Stillwater, Oklahoma 74078.
Copyright 1981 Psychonomic Society, Inc.
12~
REM ESTIMATION PROGRAM DIM D(6), RT(6) REM D' & sr VALUES FOR I - I TO 6: READ D(1): NEXT I DATA .3,.~8,.l,.35,.72,1.76 FOR I - 1 TO 6: READ RT(I): NEXT I DATA 169,2~9,258,3~4,41~,1229 ITC - .177:ASY - 2.98:RTE - 3.4:E· 2.7183 HOME' VTAll 1~ PRINT "DO YOU WANT TO SEE THE AXES?" POKE - 16368,~: GET A$ HGR' HCOLOR-3
13\1 IF AS 14~ 15~ 16~
1 7~ 180 19~
200 210 220 230 24~ 25~
26~ 27~
28~
290 30~
310 320 33~
34~ 35~
360 370 380 390 40~
410 420 430 440 450 460 470 480 490 500 510 520 530 540 550 560 570 580 590 600 610 620
630 640 650 660 670 680
69" 700 710
"Y" THEN 310
HPLOT 3,3: HPLOT TO 3,157 HPLOT TO 257,157: HPLOT TO 257,3 HPLOT TO 3,3 FOR X • 3 TO 257: T = X - 3 IF T I 1~ c INT (T I 1~) THEN 24~ HPLOT X,158 IF T I 2~ c INT (T I 2~) THEN 24~ HPLOT x, 159: HPLOT X, 156: HPLOT X,155 IF T I 2~0 " INT (T I 2~~) THEN 240 HPLOT x, 150: HPLOT TO X,I45 NEXT x FOR Y • 3 TO 157:T • Y - 7 IF T I 15 c !NT (T I 15) THEN 3~0 HPLOT 2, Y IF T I 30 c , INT (T I 30) THEN 3~0 HPLOT 1.Y: HPLOT TO 5,Y NEXT Y FOR x • 1 TO 6 X - !NT (RT(K) I 5) + 3 Y. 157 - D(K) 3~ HPLOT X, Y: NEXTK HOME: VTAll 21 PRINT" STUDY TIME-----> "
*
GOTO 500 REM PLOTTING SUBROUTINE FOR T • 0 TO 12~~ STEP 20 IF T . , ITC • 1~00 THEN HPLOT ( INT (T I 5) + 3), 156 IF T • = ITC 1000 THEN 480 " . T I 1000 pow = - RTE * (M - IrC) D "" ASY * (1 - E t POW) x= T I 5 + 3 Y = 157 - D • 30 HPLot X,Y NEXT T RETURN REM GOSUB 380 PRINT "ASYMPTOTE·" ;ASY;" INTERCEPT-"; ITC;" RATE-"; RTE PRINT "CHANGE A PARAMETER? (YIN)" POKE - 16368,0' GET A$ I F AS "" "Nil THEN 6 70 HCOLOR = 2 GOSUB 380 HCOLOR = 1 PRINT "WHICH' (A, I, OR R)" POKE - 16368,0: GET A$ PRINT "ASYMPTOTE-";ASY;" INTERCEPT-";ITC;" RATE-";RTE IF AS .,. "A" THEN INPUT "ENTER NEW ASYMPTOTE:":ASY IF A$ '= "I" THEN INPUT "ENTER NEW INTERCEPT:"; ITC IF A$ = HR" THEN INPUT "ENTER NEW RATE:"jRTE GOSUB 3B0 GOTO 520 HOME: VTAB 21 PRINT "ASYMPTOTE .. " ;ASY;" INTERCEPT""; ITC; II RATE-" JRTE PRINT "PRESS < SPACE BAR:> TO CLEAR GRJ\PHICS." POKE - 1636B,0: GET A$: TEXT: HOME: VTAll 3 PRINT "A"''';ASY;'' r"";ITC;" R=";RTE
*
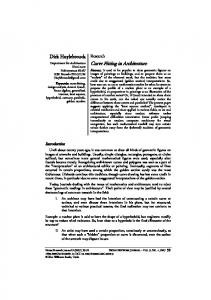
Figure I. Program listing of the GRAPH routine.
embodied in Lines 420-440 of the GRAPH program listed in Figure 1. Once the three parameters are approximated using the GRAPH program, these values are recorded and used as the starting point for the ITERATION program listed in Figure 2. The ITERATION program then adds six parameter values by successively adding and subtracting a small amount to each of the original three parameters. The resulting 27 equations are then evaluated to determine the equation that provides the minimum sum of
753
0005- 7878/81/060753-02$00.45/0
754
HOCHHAUS 10 20 30 40 50 60 70 80 90 100 11141 120 130 140 150 160 170
REM ITERATION PROGRAM DIM D (6), RT(6) , DEST(6) REM VECTORS FOR VALUES OF D'. RT, AND D' ESTIMATES E - 2.7183: SM = 100 FOR I = I TO 6: READ D(I): NEXT I DATA .3,.08,.1,.35,.72,1.76 FOR I • I TO 6: READ RT (I): NEXT I DATA 169,209,258,304,410,1229 INPUT "ASYMPTOTE ESTlMATE?";P2 INPUT "INTERCEPT ESTIMATE?" ;Pl INPUT "RATE ESTlMATE?" jP3 REM TRY PI-.24: P2-1.85: P3=3.8 INPUT "ASYMPTOTE INCREMENT? (,01 OR .1)"; AI INPUT "INTERCEPT INCREMENT? (,001 OR .01)";Ii INPUT "RATE INCREMENT? (. I OR 1)"; RI AI - AI • 100:Il = II • 1000:RI = RI • 10 HOME: VTAB 12: PRINT, Il COMPUTING"
180
REM ENTRY POINT FOR RE-CYCLE
190 200 210· 220 230 240 250 260 270 280 290 300 310 320 330 340 350 360 370 330 390 400 410 420 430
FOR A • (P2 • 1~0 - AI) TO (P2 • 100 + AI) STEP AI FOR I = (PI' 1000 - II) TO (Pl' 1000 + II) STEP Ii FOR R = (P3 • 10 - RI) TO (P3 • 10 + RI) STEP Rl FOR J = 1 TO 6 IF RT(J) < PI • 1000 THEN DEST (J) • 0 IF RT(J) ,'PI • ieee THEN 270 POW = -R / 10 • (RT(J) / 1000 - I / 1000) DEST (J) • A / 100 • (l - E ,POW) SS· SS + (D(J) - DEST (J», 2 NEXT J IF SS .> SM THEN 340 IF SS < SM THEN AM = A IF SS -c SM THEN 1M = 1 IF SS 'SH THEN R.~ = R IF SS 'SM THEN SM = SS SS· 0 NEXT R,I,A IF AM • 01 AND 1M = 02 AND RM = 03 THEN 410 01 -AM:02 = IM:03 = RM PRINT "A=";AM / 100; spec 5);"1=";1>1 / 1000; SPC( 5); "R=";RM / 10 PI - 1M / 1000: p2 = AM / 100:P3 = RM / 10 GOTO 180 PRINT: PRINT: PRINT I1PROGRAM HAS CONVERGED. II AM' AM / 100: 1M = 1M / 1000: RM = RM / 10 PRINT "MINIMUNS: ASY=";AM;" IN!="; 1M;II RATEe"; RM
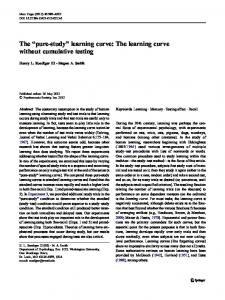
Figure 2. Program listing of the ITERATION routine.
squared deviations between raw scores and equation estimates. The minimizing parameters are printed on the screen. The program inserts these values into the beginning of the routine. The procedures continue to improve the parameter estimates until the same values are found for each parameter on two successive cycles through the program.
REFERENCES J. L. On the time relations of mental processes: An examination of system of processes in cascade. Psychological
McCLELLAND,
R~itw, 1979,16,287-330. WICKELGREN, W. A. Speed-accuracy
tradeoff and information processing dynamics. ActaPsychologica, 1977,41, 67-8S. (Accepted forpublication August 6, 1981.)