how you could use these equations to determine the bi's given the values of the ai's? Problem 4.1.10. Write a code segment to determine the value of the ...
Chapter 4
Curve Fitting We consider two commonly used methods for curve fitting, namely interpolation and least squares. For interpolation, we use first polynomials then splines. Then, we introduce least squares curve fitting using simple polynomials and later generalize this approach sufficiently to permit other choices of least squares fitting functions, for example, splines or Chebyshev series.
4.1
Polynomial Interpolation N
We can approximate a function f (x) by interpolating to the data {(xi , fi )}i=0 by another (computable) function p(x). (Here, implicitly we assume that the data is obtained by evaluating the function f (x); that is, we assume that fi = f (xi ), i = 0, 1, · · · , N .) N
Definition 4.1.1. The function p(x) interpolates to the data {(xi , fi )}i=0 if the equations p(xi ) = fi ,
i = 0, 1, · · · , N
are satisfied. This system of N + 1 equations comprise the interpolating conditions. Note, the function f (x) that has been evaluated to compute the data automatically interpolates to its own data. A common choice for the interpolating function p(x) is a polynomial. Polynomials are chosen because there are efficient methods both for determining and for evaluating them, see, for example, Horner’s rule described in Section 6.6. Indeed, they may be evaluated using only adds and multiplies, the most basic computer operations. A polynomial that interpolates to the data is an interpolating polynomial. A simple, familiar example of an interpolating polynomial is a straight line, that is a polynomial of degree one, joining two points. Definition 4.1.2. A polynomial pK (x) is of degree K if there are constants c0 , c1 , · · · , cK for which pK (x) = c0 + c1 x + · · · + cK xK . The polynomial pK (x) is of exact degree K if it is of degree K and cK != 0. Example 4.1.1. p(x) ≡ 1 + x − 4x3 is a polynomial of exact degree 3. It is also a polynomial of degree 4 because we can write p(x) = 1 + x + 0x2 − 4x3 + 0x4 . Similarly, p(x) is a polynomial of degree 5, 6, 7, · · · .
81
82
CHAPTER 4. CURVE FITTING
4.1.1
The Power Series Form of The Interpolating Polynomial
Consider first the problem of linear interpolation, that is straight line interpolation. If we have two data points (x0 , f0 ) and (x1 , f1 ) we can interpolate to this data using the linear polynomial p1 (x) ≡ a0 + a1 x by satisfying the pair of linear equations p1 (x0 ) ≡ a0 + a1 x0 p1 (x1 ) ≡ a0 + a1 x1
= f0 = f1
Solving these equations for the coefficients a0 and a1 gives the straight line passing through the two points (x0 , f0 ) and (x1 , f1 ). These equations have a solution if x0 != x1 . If f0 = f1 , the solution is a constant (a0 = f0 and a1 = 0); that is, it is a polynomial of degree zero,. Generally, there are an infinite number of polynomials that interpolate to a given set of data. To explain the possibilities we consider the power series form of the complete polynomial (that is, a polynomial where all the powers of x appear) pM (x) = a0 + a1 x + · · · + aM xM N
of degree M . If the polynomial pM (x) interpolates to the given data {(xi , fi )}i=0 , then the interpolating conditions form a linear system of N + 1 equations pM (x0 ) pM (x1 )
≡ ≡
a0 + a1 x0 + · · · + aM xM 0 a0 + a1 x1 + · · · + aM xM 1 .. .
pM (xN ) ≡ a0 + a1 xN + · · · + aM xM N
= f0 = f1 = fN
for the M + 1 unknown coefficients a0 , a1 , · · · , aM . From linear algebra (see Chapter 3), this linear system of equations has a unique solution for N every choice of data values {fi }i=0 if and only if the system is square (that is, if M = N ) and it is N nonsingular. If M < N , there exist choices of the data values {fi }i=0 for which this linear system has no solution, while for M > N if a solution exists it cannot be unique. Think of it this way: 1. The complete polynomial pM (x) of degree M has M + 1 unknown coefficients, 2. The interpolating conditions comprise N + 1 equations. 3. So, • If M = N , there are as many coefficients in the complete polynomial pM (x) as there are equations obtained from the interpolating conditions, • If M < N , the number of coefficients is less than the number of data values and we wouldn’t have enough coefficients so that we would be able to fit to all the data. • If M > N , the number of coefficients exceeds the number of data values and we would expect to be able to choose the coefficients in many ways to fit the data. The square, M = N , coefficient matrix Vandermonde matrix 1 1 VN ≡ 1
of the linear system of interpolating conditions is the x0 x20 · · · xM 0 x1 x21 · · · xM 1 .. . 2 M xN xN · · · xN
and it can be shown that the determinant of VN is ' (xi − xj ) det(VN ) = i>j
83
4.1. POLYNOMIAL INTERPOLATION
N
Observe that det(VN ) != 0, that is the matrix VN is nonsingular, if and only if the nodes {xi }i=0 N are distinct; that is, if and only if xi != xj whenever i != j. So, for every choice of data {(xi , fi )}i=0 , there exists a unique solution satisfying the interpolation conditions if and only if M = N and the N nodes {xi }i=0 are distinct. N
Theorem 4.1.1. (Polynomial Interpolation Uniqueness Theorem) When the nodes {xi }i=0 are distinct there is a unique polynomial, the interpolating polynomial pN (x), of degree N that interpolates N to the data {(xi , fi )}i=0 . Though the degree of the interpolating polynomial is N corresponding to the number of data values, its exact degree may be less than N . For example, this happens when the three data points (x0 , f0 ), (x1 , f1 ) and (x2 , f2 ) are collinear; the interpolating polynomial for this data is of degree N = 2 but it is of exact degree 1; that is, the coefficient of x2 turns out to be zero. (In this case, the interpolating polynomial is the straight line on which the data lies.) Example 4.1.2. Determine the power series form of the quadratic interpolating polynomial p2 (x) = a0 + a1 x + a2 x2 to the data (−1, 0), (0, 1) and (1, 3). The interpolating conditions, in the order of the data, are a0 + (−1)a1 + (1)a2 = 0 a0 = 1 a0 + (1)a1 + (1)a2 = 3 We may solve this linear system of equations for a0 = 1, a1 = form, the interpolating polynomial is p2 (x) = 1 + 32 x + 12 x2 .
3 2
and a2 = 21 . So, in power series
Of course, polynomials may be written in many different ways, some more appropriate to a N given task than others. For example, when interpolating to the data {(xi , fi )}i=0 , the Vandermonde system determines the values of the coefficients a0 , a1 , · · · , aN in the power series form. The number of floating–point computations needed by GE to solve the interpolating condition equations grows like N 3 with the degree N of the polynomial (see Chapter 3). This cost can be significantly reduced by exploiting properties of the Vandermonde coefficient matrix. Another way to reduce the cost of determining the interpolating polynomial is to change the way the interpolating polynomial is represented. Problem 4.1.1. Show that, when N = 2,
1 x0 det(V2 ) = det 1 x1 1 x2
j=0; i=1,2 j=1; i=2 x20 , -. / , -. / ' 2 x1 = (xi − xj ) = (x1 − x0 )(x2 − x0 ) (x2 − x1 ) i>j x22
Problem 4.1.2. ωN +1 (x) ≡ (x − x0 )(x − x1 ) · · · (x − xN ) is a polynomial of exact degree N + N 1. If pN (x) interpolates the data {(xi , fi )}i=0 , verify that, for any choice of polynomial q(x), the polynomial p(x) = pN (x) + ωN +1 (x)q(x) interpolates the same data as pN (x). Hint: Verify that p(x) satisfies the same interpolating conditions as does pN (x). Problem 4.1.3. Find the power series form of the interpolating polynomial to the data (1, 2), (3, 3) and (5, 4). Check that your computed polynomial does interpolate the data. Hint: For these three data points you will need a complete polynomial that has three coefficients; that is, you will need to interpolate with a quadratic polynomial p2 (x). Problem 4.1.4. Let pN (x) be the unique interpolating polynomial of degree N for the data N {(xi , fi )}i=0 . Estimate the cost of determining the coefficients of the power series form of pN (x), assuming that you can set up the coefficient matrix at no cost. Just estimate the cost of solving the linear system via Gaussian Elimination.
84
4.1.2
CHAPTER 4. CURVE FITTING
The Newton Form of The Interpolating Polynomial
Consider the problem of determining the interpolating quadratic polynomial for the data (x0 , f0 ), (x1 , f1 ) and (x2 , f2 ). Using the data written in this order, the Newton form of the quadratic interpolating polynomial is p2 (x) = b0 + b1 (x − x0 ) + b2 (x − x0 )(x − x1 )
To determine these coefficients bi simply write down the interpolating conditions: p2 (x0 ) ≡ b0 = f0 p2 (x1 ) ≡ b0 + b1 (x1 − x0 ) = f1 p2 (x2 ) ≡ b0 + b1 (x2 − x0 ) + b2 (x2 − x0 )(x2 − x1 ) = f2
The coefficient matrix
1 0 1 (x1 − x0 ) 1 (x2 − x0 )
0 0 (x2 − x0 )(x2 − x1 ) 2
for this linear system is lower triangular. When the nodes {xi }i=0 are distinct, the diagonal entries of this lower triangular matrix are nonzero. Consequently, the linear system has a unique solution that may be determined by forward substitution. Example 4.1.3. Determine the Newton form of the quadratic interpolating polynomial p2 (x) = b0 + b1 (x − x0 ) + b2 (x − x0 )(x − x1 ) to the data (−1, 0), (0, 1) and (1, 3). Taking the data points in their order in the data we have x0 = −1, x1 = 0 and x2 = 1. The interpolating conditions are b0 b0 + (0 − (−1))b1 b0 + (1 − (−1))b1 + (1 − (−1))(1 − 0)b2
= 0 = 1 = 3
and this lower triangular system may be solved to give b0 = 0, b1 = 1 and b2 = 12 . So, the Newton form of the quadratic interpolating polynomial is p2 (x) = 0 + 1(x + 1) + 12 (x + 1)(x − 0). After rearrangement we observe that this is the same polynomial as the power series form in Example 4.1.2. Example 4.1.4. For the data (1, 2), (3, 3) and (5, 4), using the data points in the order given, the Newton form of the interpolating polynomial is p2 (x) = b0 + b1 (x − 1) + b2 (x − 1)(x − 3)
and the interpolating conditions are
p2 (1) ≡ b0 = 2 p2 (3) ≡ b0 + b1 (3 − 1) = 3 p2 (5) ≡ b0 + b1 (5 − 1) + b2 (5 − 1)(5 − 3) = 4
This lower triangular linear system may be solved by forward substitution giving b0 b1
=
b2
=
3 − b0 (3 − 1) 4 − b0 − (5 − 1)b1 (5 − 1)(5 − 3)
=
2 1 = 2 =
0
Consequently, the Newton form of the interpolating polynomial is 1 p2 (x) = 2 + (x − 1) + 0(x − 1)(x − 3) 2 Generally, this interpolating polynomial is of degree 2, but its exact degree may be less. Here, 3 1 rearranging into power series form we have p2 (x) = + x and the exact degree is 1; this happens 2 2 because the data (1, 2), (3, 3) and (5, 4) are collinear.
85
4.1. POLYNOMIAL INTERPOLATION real function N ewtonF orm (x, N, node, coef f ) real x integer N real node(0 : N ) real coef f (0 : N ) {Computes the value at a given point x of the polynomial pN (x) of degree N from the values of the nodes and coefficients in its Newton form pN (x) = coef f [0]+ (x − node[0]) ∗ coef f [1]+ (x − node[0] ∗ (x − node[1]) ∗ coef f [2] + · · · + (x − node[0]) ∗ (x − node[1]) ∗ · · · ∗ (x − node[N − 1]) ∗ coef f [N ] } integer i real ans begin ans := coef f [N ] for i = N − 1 downto 0 do ans := coef f [i] + (x − node[i]) ∗ ans next i return (ans) end function N ewtonF orm Figure 4.1: Pseudocode NewtonForm
The Newton form of the interpolating polynomial is easy to evaluate using nested multiplication (which is a generalization of Horner’s rule, see Chapter 6). Start with the observation that p2 (x)
= b0 + b1 (x − x0 ) + b2 (x − x0 )(x − x1 ) = b0 + (x − x0 ) {b1 + b2 (x − x1 )}
For any value of x, the nested multiplication scheme determines p2 (x) = t0 (x) as follows: t2 (x) = b2 t1 (x) = b1 + (x − x1 )t2 (x) t0 (x) = b0 + (x − x0 )t1 (x)
An extension to degree N of this nested multiplication scheme leads to the code segment NewtonForm in Fig. 4.1. This code segment evaluates the Newton form of a polynomial of degree N at a point x given the values of the nodes xi and the coefficients bi . How can the triangular system for the coefficients in the Newton form of the interpolating polynomial be systematically formed and solved? First, note that we may form a sequence of interpolating polynomials as in Table 4.1. So, the Newton equations that determine the coefficients Polynomial p0 (x) = b0 p1 (x) = b0 + b1 (x − x0 ) p2 (x) = b0 + b1 (x − x0 ) + b2 (x − x0 )(x − x1 )
The Data (x0 , f0 ) (x0 , f0 ), (x1 , f1 ) (x0 , f0 ), (x1 , f1 ), (x2 , f2 )
Table 4.1: Building the Newton form of the interpolating polynomial b0 , b1 and b2 may be written b0 = f0 p0 (x1 ) + b1 (x1 − x0 ) = f1 p1 (x2 ) + b2 (x2 − x0 )(x2 − x1 ) = f2
86
CHAPTER 4. CURVE FITTING procedure N ewtonF ormCoef f icients (N, node, value, coef f ) integer N real node(0 : N ), value(0 : N ), coef f (0 : N ) {Determines the values of the coefficients in the Newton form of the interpolating polynomial pN (x) = coef f [0]+ (x − node[0]) ∗ coef f [1]+ (x − node[0]) ∗ (x − node[1]) ∗ coef f [2] + · · · + (x − node[0]) ∗ (x − node[1]) ∗ · · · ∗ (x − node[N − 1]) ∗ coef f [N ] for the data (node[i], value[i]) for i = 0, 1, · · · , N. } integer i, j real num, den begin coef f [0] := value[0] for i = 1 to N num := value[i] − N ewtonF orm(node[i], i − 1, node, coef f ) den := 1.0 for j = 0 to i − 1 den := den ∗ (node[i] − node[j]) next j coef f [i] := num/den next i end procedure N ewtonF ormCoef f icients Figure 4.2: Pseudocode NewtonFormCoefficients
and we conclude that we may solve for the coefficients bi efficiently as follows b0 b1 b2
= f0 f1 − p0 (x1 ) = (x1 − x0 ) f2 − p1 (x2 ) = (x2 − x0 )(x2 − x1 ) N
This process clearly deals with any number of data points. So, if we have data {(xi , fi )}i=0 , we may compute the coefficients in the corresponding Newton polynomial pN (x) = b0 + b1 (x − x0 ) + . . . + bN (x − x0 )(x − x1 ) · · · (x − xN −1 ) from evaluating b0 = f0 followed by bk =
fk − pk−1 (xk ) , (xk − x0 )(xk − x1 ) · · · (xk − xk−1 )
k = 1, 2, . . . , N
Indeed, we can easily incorporate additional data values. Suppose we have fitted to the data N {(xi , fi )}i=0 using the above formulas and we wish to add the data (xN +1 , fN +1 ). Then we may simply use the formula bN +1 =
fN +1 − pN (xN +1 ) (xN +1 − x0 )(xN +1 − x1 ) · · · (xN +1 − xN )
The code segment NewtonFormCoefficients in Fig. 4.2 implements this computational sequence N for the Newton form of the interpolating polynomial of degree N given the data {(xi , fi )}i=0 . In summary, for the Newton form of the interpolating polynomial it is easy to
87
4.1. POLYNOMIAL INTERPOLATION • Determine the coefficients • Evaluate the polynomial at specified values via nested multiplication • Extend the polynomial to incorporate additional interpolation points and data.
If the interpolating polynomial is to be evaluated at many points, generally it is best first to determine its Newton form and then to use the nested multiplication scheme to evaluate the interpolating polynomial at each desired point. Problem 4.1.5. Use the data in Example 4.1.3 in reverse order (that is, use x0 = 1, x1 = 0 and x2 = −1) to build an alternative quadratic Newton interpolating polynomial. Is this the same polynomial that was derived in Example 4.1.3? Why or why not? N
Problem 4.1.6. Let pN (x) be the interpolating polynomial for the data {(xi , fi )}i=0 , and let pN +1 (x) N +1 be the interpolating polynomial for the data {(xi , fi )}i=0 . Show that pN +1 (x) = pN (x) + bN +1 (x − x0 )(x − x1 ) · · · (x − xN ) What is the value of bN +1 ? Problem 4.1.7. In Example 4.1.3 we showed how to form the quadratic Newton polynomial p2 (x) = 0 + 1(x + 1) + 12 (x + 1)(x − 0) that interpolates to the data (−1, 0), (0, 1) and (1, 3). Starting from this quadratic Newton interpolating polynomial build the cubic Newton interpolating polynomial to the data (−1, 0), (0, 1), (1, 3) and (2, 4). Problem 4.1.8. Let pN (x) = b0 + b1 (x − x0 ) + b2 (x − x0 )(x − x1 ) + · · · + bN (x − x0 )(x − x1 ) · · · (x − xN −1 ) N
be the Newton interpolating polynomial for the data {(xi , fi )}i=0 . Write down the coefficient matrix for the linear system of equations for interpolating to the data with the polynomial pN (x). 2
Problem 4.1.9. Let the nodes {xi }i=0 be given. A complete quadratic p2 (x) can be written in power series form or Newton form: 0 1 a0 + a1 x + a2 x2 power series form p2 (x) = b0 + b1 (x − x0 ) + b2 (x − x0 )(x − x1 ) Newton form By expanding the Newton form into a power series in x, verify that the coefficients b0 , b1 and b2 are related to the coefficients a0 , a1 and a2 via the equations 1 −x0 x0 x1 b0 a0 0 1 −(x0 + x1 ) b1 = a1 0 0 1 b2 a2
Describe how you could use these equations to determine the ai ’s given the values of the bi ’s? Describe how you could use these equations to determine the bi ’s given the values of the ai ’s?
Problem 4.1.10. Write a code segment to determine the value of the derivative p"2 (x) at a point x of the Newton form of the quadratic interpolating polynomial p2 (x). (Hint: p2 (x) can be evaluated via nested multiplication just as a general polynomial can be evaluated by Horner’s rule. Review how p"2 (x) is computed via Horner’s rule in Chapter 6.) Problem 4.1.11. Determine the Newton form of the interpolating (cubic) polynomial to the data (0, 1), (−1, 0), (1, 2) and (2, 0). Determine the Newton form of the interpolating (cubic) polynomial to the same data written in reverse order. By converting both interpolating polynomials to power series form show that they are the same.
88
CHAPTER 4. CURVE FITTING
Problem 4.1.12. Determine the Newton form of the interpolating (quartic) polynomial to the data (0, 1), (−1, 2), (1, 0), (2, −1) and (−2, 3). N
Problem 4.1.13. Let pN (x) be the interpolating polynomial for the data {(xi , fi )}i=0 . Determine the number of adds (subtracts), multiplies, and divides required to determine the coefficients of the Newton form of pN (x). Hint: The coefficient b0 = f0 , so it costs nothing to determine b0 . Now, recall that fk − pk−1 (xk ) bk = (xk − x0 )(xk − x1 ) · · · (xk − xk−1 ) N
Problem 4.1.14. Let pN (x) be the unique polynomial interpolating to the data {(xi , fi )}i=0 . Given its coefficients, determine the number of adds (or, equivalently, subtracts) and multiplies required to evaluate the Newton form of pN (x) at one value of x by nested multiplication. Hint: The nested multiplication scheme for evaluating the polynomial pN (x) has the form tN tN −1 tN −2 t0
4.1.3
= bN = bN −1 + (x − xN −1 )tN = bN −2 + (x − xN −2 )tN −1 .. . = b0 + (x − x0 )t1
The Lagrange Form of The Interpolating Polynomial 2
Consider the data {(xi , fi )}i=0 . The Lagrange form of the quadratic polynomial interpolating to this data may be written: p2 (x) ≡ f0 · l0 (x) + f1 · l1 (x) + f2 · l2 (x) We construct each basis polynomial li (x) so that it is quadratic and so that it satisfies 0 1, i = j li (xj ) = 0, i != j then clearly
p2 (x0 ) = 1 · f0 + 0 · f1 + 0 · f2 p2 (x1 ) = 0 · f0 + 1 · f1 + 0 · f2 p2 (x2 ) = 0 · f0 + 0 · f1 + 1 · f2
= f0 = f1 = f2
This property of the basis functions may be achieved using the following construction:
l0 (x)
=
l1 (x) =
l2 (x) =
one at x0 , zero at other nodes , -. / product of linear factors for each node except x0 (x − x1 )(x − x2 ) = numerator evaluated at x = x0 (x0 − x1 )(x0 − x2 ) one at x1 , zero at other nodes , -. / (x − x0 )(x − x2 ) product of linear factors for each node except x1 = numerator evaluated at x = x1 (x1 − x0 )(x1 − x2 ) one at x2 , zero at other nodes -. / , product of linear factors for each node except x2 (x − x0 )(x − x1 ) = numerator evaluated at x = x2 (x2 − x0 )(x2 − x1 )
Example 4.1.5. For the data (1, 2), (3, 3) and (5, 4) the Lagrange form of the interpolating polynomial is p2 (x)
= =
(x − 3)(x − 5) (x − 1)(x − 5) (x − 1)(x − 3) + (3) + (4) (numerator at x = 1) (numerator at x = 3) (numerator at x = 5) (x − 1)(x − 5) (x − 1)(x − 3) (x − 3)(x − 5) + (3) + (4) (2) (1 − 3)(1 − 5) (3 − 1)(3 − 5) (5 − 1)(5 − 3) (2)
89
4.1. POLYNOMIAL INTERPOLATION
The polynomials multiplying the data values (2), (3) and (4), respectively, are quadratic basis functions. N
More generally, consider the polynomial pN (x) of degree N interpolating to the data {(xi , fi )}i=0 : pN (x) =
N 2 i=0
fi · li (x)
where the Lagrange basis polynomials lk (x) are polynomials of degree N and have the property 0 1, k = j lk (xj ) = 0, k != j so that clearly
pN (xi ) = fi , i = 0, 1, · · · , N
The basis polynomials may be defined by
one at xk , zero at other nodes , -. / (x − x0 )(x − x1 ) · · · (x − xk−1 )(x − xk+1 ) · · · (x − xN ) lk (x) ≡ numerator evaluated at x = xk Algebraically, the basis function lk (x) is a fraction whose numerator is the product of the linear factors (x − xi ) associated with each of the nodes xi except xk , and whose denominator is the value of its numerator at the node xk . real function CardinalL (x, i, N, node) integer i, N real x, node(0 : N ) {Computes Li (x) for the N + 1 nodes node[0], node[1], · · · , node[N ] } integer j real num, den, ans begin num := 1.0; den := 1.0 for j = 0 to N if (j != i) then num := num ∗ (x − node(j)) den := den ∗ (node(i) − node(j)) endif next j ans := num/den return (ans) end function CardinalL Figure 4.3: Pseudocode CardinalL N
N
Consider the data {(xi , fi )}i=0 = {(node[i], value[i])}i=0 . The pseudocodes in Figs. 4.3 and 4.4 compute the value of the Lagrange form of the interpolating polynomial at a user specified value x. The pseudocode in Fig. 4.3 returns as CardinalL the value of the k th basis function lk (x) for any input value x. Using this, the pseudocode in Fig. 4.4 returns as LagrangeForm the value of the interpolating polynomial pN (x) for any input value of x. Unlike when using the Newton form of the interpolating polynomial, the Lagrange form has no coefficients whose values must be determined. In one sense, Lagrange form provides an explicit solution of the interpolating conditions. However, the Lagrange form of the interpolating polynomial is more expensive to evaluate than either the power form or the Newton form (see Problem 4.1.20). In summary, the Lagrange form of the interpolating polynomial
90
CHAPTER 4. CURVE FITTING real function LagrangeF orm (x, N, node, value) integer N real x, node(0 : N ), value(0 : N ) {Returns the value at x of the interpolating polynomial for the N + 1 data points (node[i], value[i]) for i = 0, 1, · · · , N } integer i real CardinalL, ans begin ans := 0.0 for i = 0 to N ans := ans + value(i) ∗ CardinalL(x, i, N, node) next i return (ans) end function LagrangeF orm Figure 4.4: Pseudocode LagrangeForm
• is useful theoretically because it does not require solving a linear system • explicitly shows how each data value fi affects the overall interpolating polynomial Problem 4.1.15. Determine the Lagrange form of the interpolating polynomial to the data (−1, 0), (0, 1) and (1, 3). Is it the same polynomial as in Example 4.1.3? Why or why not? Problem 4.1.16. Show that p2 (x) = f0 · l0 (x) + f1 · l1 (x) + f2 · l2 (x) interpolates to the data 2 {(xi , fi )}i=0 . Problem 4.1.17. For the data (1, 2), (3, 3) and (5, 4) in Example 4.1.5, check that the Lagrange 1 3 form of the interpolating polynomial agrees precisely with the power series form + x fitting to 2 2 the same data, as for the Newton form of the interpolating polynomial. Problem 4.1.18. Determine the Lagrange form of the interpolating polynomial for the data (0, 1), (−1, 0), (1, 2) and (2, 0). Check that you have determined the same polynomial as the Newton form of the interpolating polynomial for the same data, see Problem 4.1.11. Problem 4.1.19. Determine the Lagrange form of the interpolating polynomial for the data (0, 1), (−1, 2), (1, 0), (2, −1) and (−2, 3). Check that you have determined the same polynomial as the Newton form of the interpolating polynomial for the same data, see Problem 4.1.12. Problem 4.1.20. Let pN (x) be the Lagrange form of the interpolating polynomial for the data N {(xi , fi )}i=0 . Determine the number of additions (subtractions), multiplications, and divisions that the code segments in Figs. 4.4 and 4.3 use when evaluating the Lagrange form of pN (x) at one value of x. [Hint: The operation count in CardinalL is 2N additions, 2N multiplications, and 1 division.] How does the cost of using the Lagrange form of the interpolating polynomial for m different evaluation points x compare with the cost of using the Newton form for the same task? (See Problem 4.1.14.) Problem 4.1.21. In this problem we consider “cubic Hermite interpolation” where the function and its first derivative are interpolated at the points x = 0 and x = 1: 1. For the function φ(x) ≡ (1 + 2x)(1 − x)2 show that φ(0) = 1, φ(1) = 0, φ" (0) = 0, φ" (1) = 0 2. For the function ψ(x) ≡ x(1 − x)2 show that ψ(0) = 0, ψ(1) = 0, ψ " (0) = 1, ψ " (1) = 0 3. For the cubic Hermite interpolating polynomial P (x) ≡ f (0)φ(x) + f " (0)ψ(x) + f (1)φ(1 − x) − f " (1)ψ(1 − x) show that P (0) = f (0), P " (0) = f " (0), P (1) = f (1), P " (1) = f " (1)
91
4.1. POLYNOMIAL INTERPOLATION
4.1.4
The Error in Polynomial Interpolation N
Let pN (x) be the polynomial of degree N interpolating to the data {xi , fi }i=0 . How accurately does the polynomial pN (x) approximate the function f (x) at any point x? Let the evaluation point x and N all the points {xi }i=0 lie in a closed interval [a, b]. An advanced course in numerical analysis shows, using Rolle’s Theorem (see Problem 4.1.22) repeatedly, that the error expression may be written as f (x) − pN (x) =
ωN +1 (x) (N +1) f (ξx ) (N + 1)!
where ωN +1 (x) ≡ (x − x0 )(x − x1 ) · · · (x − xN ) and ξx is some (unknown) point in the interval [a, b]. N The precise location of the point ξx depends on all of f (x), x and {xi }i=0 . (Here f (N +1) (ξx ) is the st (N + 1) derivative of f (x) evaluated at the point x = ξx .) Some of the intrinsic properties of the interpolation error are: 1. For any value of i, the error is zero when x = xi because wN +1 (xi ) = 0 (the interpolating conditions). 2. The error is zero when the data fi are measurements of a polynomial f (x) of exact degree N because then the (N + 1)st derivative f (N +1) (x) is identically zero. This is simply a statement of the uniqueness theorem of polynomial interpolation. Taking absolute values in the interpolation error expression and maximizing both sides of the resulting inequality over x ∈ [a, b], we obtain the polynomial interpolation error bound max |f (x) − pN (x)| ≤ max |ωN +1 (x)| ·
x∈[a,b]
x∈[a,b]
maxz∈[a,b] |f (N +1) (z)| (N + 1)!
(4.1)
|f (N +1) (x)| or the term (N + 1)! maxx∈[a,b] |ωN +1 (x)|, or both, small. Generally, we have little information about the function f (x) or its derivatives, even about their sizes, and in any case we cannot change them to minimize the bound. In the absence of information about f (x) or its derivatives, we might aim to choose the nodes N {xi }i=0 so that |ωN +1 (x)| is small throughout [a, b]. As Fig. 4.5 demonstrates, generally equally i spaced nodes defined by xi = a + (b − a), i = 0, 1, · · · , N are not a good choice, as for them the N polynomial ωN +1 (x) oscillates with zeros at the nodes as anticipated, but with the amplitude of the oscillations growing as the evaluation point x approaches either endpoint of the interval [a, b]. Fig. 4.6 depicts the polynomial ωN +1 (x) for the point x slightly outside the interval [a, b] where ωN +1 (x) grows like xN +1 . Evaluating the polynomial pN (x) for points x outside the interval [a, b] is extrapolation. This illustration indicates that extrapolation should be avoided whenever possible. This observation implies that we need to know the application intended for the interpolant before we measure the data; a fact frequently ignored when designing an experiment. For the data in Fig. 4.7, we use the Chebyshev points for the interval [a, b]: 3 4 b+a b−a 2i + 1 − cos π i = 0, 1, · · · , N. xi = 2 2 2N + 2 To make this error bound small we must make either the term maxx∈[a,b]
Note that the Chebyshev points do not include the endpoints a or b and that all the Chebyshev points lie inside the open interval (a, b). For the interval [a, b] = [−1, +1], the Chebyshev points are the zeros of the Chebyshev polynomial TN +1 (x), hence the function ωN +1 (x) is a scaled version of TN +1 (x) (see Section 4.3 below for the definition of the Chebyshev polynomials). With the Chebyshev points as nodes, the maximum value of the polynomial |ωN +1 (x)| is less than half its value in Figs. 4.5 and 4.6. As N increases, the improvement in the size of |ωN +1 (x)| when using the Chebyshev points rather than equally spaced points is even greater. Indeed, for
92
CHAPTER 4. CURVE FITTING
0.0002 0.2
0.4
0.6
0.8
1
-0.0002 -0.0004 -0.0006 -0.0008 -0.001
Figure 4.5: Plot of the polynomial ωN +1 (x) for x ∈ [0, 1] when a = 0, b = 1, N = 5 with equally spaced nodes.
0.003
0.002
0.001
0.2
0.4
0.6
0.8
1
-0.001 Figure 4.6: Plot of the polynomial ωN +1 (x) for x ∈ [−0.05, +1.05] when a = 0, b = 1, and N = 5 with equally spaced nodes.
93
4.1. POLYNOMIAL INTERPOLATION
0.0004 0.0002
0.2
0.4
0.6
0.8
1
-0.0002 -0.0004
Figure 4.7: Plot of the polynomial ωN +1 (x) for x ∈ [0, 1] when a = 0, b = 1 and N = 5 with Chebyshev nodes. polynomials of degree 20 or less, interpolation to the data measured at the Chebyshev points gives a maximum error not greater than twice the smallest possible maximum error (known as the minimax error) taken over all polynomial fits to the data (not just using interpolation). However, there are penalties: 1. Extrapolation using the interpolant based on data measured at Chebyshev points is even more disastrous than extrapolation based on the same number of equally spaced data points. 2. It may be difficult to obtain the data fi measured at the Chebyshev points. Figs. 4.5 — 4.7 suggest that to choose pN (x) so that it will accurately approximate all reasonable choices of f (x) on an interval [a, b], we should N
1. Choose the nodes {xi }i=0 so that, for all likely evaluation points x, min(xi ) ≤ x ≤ max(xi )
2. If possible, choose the nodes as the Chebyshev points. If this is not possible, choose them so they are denser close to the endpoints of the interval [a, b] Problem 4.1.22. Prove Rolle’s Theorem: Let f (x) be continuous and differentiable on the closed interval [a, b] and let f (a) = f (b) = 0, then there exists a point c ∈ (a, b) such that f " (c) = 0.
Problem 4.1.23. Let x = x0 + sh and xi = x0 + ih, show that wn+1 (x) = hN +1 s(s − 1) · · · (s − N ).
Problem 4.1.24. Determine the following bound for straight line interpolation (that is with a polynomial of degree one, p1 (x)) to the data (a, f (a)) and (b, f (b)) max |f (x) − p1 (x)| ≤
x∈[a,b]
1 |b − a|2 max |f (2) (z)| 8 z∈[a,b]
[Hint: You need to use the bound (4.1) for this special case, and use standard calculus techniques to find maxx∈[a,b] |ωN +1 (x)|.]
Problem 4.1.25. Let f (x) be a polynomial of degree N + 1 for which f (xi ) = 0, i = 0, 1, · · · , N . Show that the interpolation error expression reduces to f (x) = A wN +1 (x) for some constant A. Explain why this result is to be expected. Problem 4.1.26. For N = 5, N = 10 and N = 15 plot, on one graph, the three polynomials ωN +1 (x) for x ∈ [0, 1] defined using equally spaced nodes. For the same values of N plot, on one graph, the three polynomials ωN +1 (x) for x ∈ [0, 1] defined using Chebyshev nodes. Compare the three maximum values of |ωN +1 (x)| on the interval [0, 1] for each of these two graphs. Also, compare the corresponding maximum values in the two graphs.
94
CHAPTER 4. CURVE FITTING
-4
-2
2
4
-0.5
-1
-1.5
Figure 4.8: The error in interpolating f (x) = 11 equally spaced nodes (N = 10).
1 by a polynomial on the interval [−5, +5] for 1 + x2
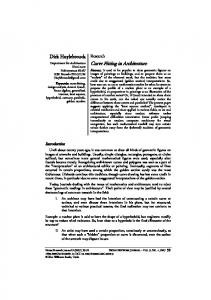
Runge’s Example To use polynomial interpolation to obtain an accurate estimate of f (x) on a fixed interval [a, b], it is natural to think that increasing the number of interpolating points in [a, b], and hence increasing the degree of the polynomial, will reduce the error in the polynomial interpolation to f (x) . In fact, for some functions f (x) this approach may worsen the accuracy of the interpolating polynomial. When this is the case, the effect is greatest for equally spaced interpolation points. At least a part |f (N +1) (x)| of the problem arises from the term maxx∈[a,b] in the expression for interpolation error. (N + 1)! This term may grow, or at least not decay, as N increases, even though the denominator (N + 1)! grows very quickly as N increases. In Fig. 4.8, we plot the error in polynomial interpolation for 1 on the interval [−5, +5] with 11 equally spaced nodes (that interpolating the function f (x) = 1 + x2 is, for N = 10). Note that the behavior of the error mimics the behavior of ωN +1 (x) in Fig. 4.5. Problem 4.1.27. Runge’s example. Consider the function f (x) =
1 on the interval [−5, +5]. 1 + x2
1. For N = 5, N = 10 and N = 15 plot the error e(x) = pN (x)−f (x) where the polynomial pN (x) i is computed by interpolating at the N +1 equally spaced nodes, xi = a+ (b−a), i = 0, 1, · · · , N . N 2. Repeat Part 1 but interpolate at the N + 1 Chebyshev nodes shifted to the interval [−5, 5]. Create a table listing the approximate maximum absolute error and its location in [a, b] as a function of N ; there will be two columns one for each of Parts 1 and 2. [Hint: For simplicity, compute the interpolating polynomial pN (x) using the Lagrange form. To compute the approximate maximum error you will need to sample the error between each pair of nodes (recall, the error is zero at the nodes) — sampling at the midpoints of the intervals between the nodes will give you a sufficiently accurate estimate.]
4.2
Polynomial Splines
Now, we consider techniques designed to reduce the problems that arise when data are interpolated by a single polynomial. The first technique interpolates the data by a collection of low degree
95
4.2. POLYNOMIAL SPLINES
polynomials rather than by a single high degree polynomial. Another technique outlined in Section 4.4, approximates but not necessarily interpolates, the data by least squares fitting a single low degree polynomial. Generally, by reducing the size of the interpolation error bound we reduce the actual error. Since 5 5 the term 5ωN +1 (x)5 in the bound is the product of N + 1 linear factors |x − xi |, each the distance between two points that both lie in [a, b], we have |x − xi | ≤ |b − a| and so max |f (x) − pN (x)| ≤ |b − a|N +1 ·
x∈[a,b]
maxx∈[a,b] |f (N +1) (x)| (N + 1)!
This (larger) bound suggests that we can make the error as small as we wish by freezing the value of N and then reducing the size of |b − a|. We still need an approximation over the original interval, so we use a piecewise polynomial approximation: the original interval is divided into non-overlapping subintervals and a different polynomial fit of the data is used on each subinterval.
4.2.1
Linear Polynomial Splines N
A simple piecewise polynomial fit is the linear interpolating spline. For data {(xi , fi )}i=0 , where a = x0 < x1 · · · < xN = b,
h ≡ max |xi − xi−1 |, i
the linear spline S1,N (x) is a continuous function that interpolates to the data and is constructed from linear functions that we identify as two–point interpolating polynomials: x − x1 f0 x0 − x1 x − x2 f1 x 1 − x2 S1,N (x) = fN −1 x − xN xN −1 − xN
+ + .. .
x − x0 x1 − x0 x − x1 f2 x2 − x1 f1
+ fN
x − xN −1 xN − xN −1
when x ∈ [x0 , x1 ] when x ∈ [x1 , x2 ] when x ∈ [xN −1 , xN ]
From the bound on the error for polynomial interpolation, in the case of an interpolating polynomial of degree one, maxz∈[xi−1 ,xi ] |f (z) − S1,N (z)|
|xi − xi−1 |2 · maxx∈[xi−1 ,xi ] |f (2) (x)| 8 h2 ≤ · maxx∈[a,b] |f (2) (x)| 8 ≤
(See Problem 4.1.24.) That is, the bound on the maximum absolute error behaves like h2 as the maximum interval length h → 0. Suppose that the nodes are chosen to be equally spaced in [a, b], b−a . As the number of points N increases, the so that xi = a + ih, i = 0, 1, · · · , N , where h ≡ N 1 error in using S1,N (z) as an approximation to f (z) tends to zero like 2 . N Example 4.2.1. We construct the linear spline to the data (−1, 0), (0, 1) and (1, 3): x−0 x − (−1) 0· + 1· when x ∈ [−1, 0] (−1) − 0 0 − (−1) S1,2 (x) = x−0 1· x−1 + 3· when x ∈ [0, 1] 0−1 1−0
An alternative method for representing a linear spline uses a linear B-spline basis, Li (x), i = 0, 1, · · · , N, chosen so that Li (xj ) = 0 for all j != i and Li (xi ) = 1. Here, each Li (x) is a “roof”
96
CHAPTER 4. CURVE FITTING
shaped function with the apex of the roof at (xi , 1) and the span on the interval [xi−1 , xi+1 ], and with Li (x) ≡ 0 outside [xi−1 , xi+1 ]. That is, x − xi−1 when x ∈ [xi−1 , xi ] x −x i i−1 x − xi+1 Li (x) = when x ∈ [xi , xi+1 ] xi − xi+1 0 for all other x In terms of the linear B-spline basis we can write S1,N (x) =
N 2 i=0
Li (x) · fi
Example 4.2.2. We construct the linear spline to the data (−1, 0), (0, 1) and (1, 3) using the linear B-spline basis. First we construct the basis: x − 0 , x ∈ [−1, 0] L0 (x) = (−1) − 0 0, x ∈ [0, 1] x − (−1) , x ∈ [−1, 0] 0 − (−1) L1 (x) = x − 1 , x ∈ [0, 1] : 0−1 0, x ∈ [−1, 0] x−0 L2 (x) = , x ∈ [0, 1] 1−0 then
p2 (x) = 0 · L0 (x) + 1 · L1 (x) + 3 · L2 (x)
Problem 4.2.1. Let S1,N (x) be a linear spline. N
1. Show that S1,N (x) is continuous and that it interpolates the data {(xi , fi )}i=0 . " 2. At the interior nodes xi , i = 1, 2, · · · , N − 1, show that S1,N (x− i )= " S1,N (x+ i )=
fi+1 − fi xi+1 − xi
fi − fi−1 and xi − xi−1
" 3. Show that, in general, S1,N (x) is discontinuous at the interior nodes.
4. Under what circumstances would S1,N (x) have a continuous derivative at x = xi ? 5. Determine the linear spline S1,3 (x) that interpolates to the data (0, 1), (1, 2), (3, 3) and (5, 4). " (x) discontinuous at x = 1? At x = 2? At x = 3? Is S1,3 Problem 4.2.2. Given the data (0, 1), (1, 2), (3, 3) and (5, 4), write down the linear B-spline basis functions Li (x), i = 0, 1, 2, 3 and the sum representing S1,2 (x). Show that S1,2 (x) is the same linear spline that was described in Problem 4.2.1. Using this basis function representation of the linear spline, evaluate the linear spline at x = 1 and at x = 2.
4.2.2
Cubic Polynomial Splines
Linear splines suffer from a major limitation: the derivative of a linear spline is generally discontinuous at each interior node, xi . To derive a piecewise polynomial approximation with a continuous derivative requires that we use polynomial pieces of higher degree and constrain the pieces to make the curve smoother.
97
4.2. POLYNOMIAL SPLINES
Before the days of Computer Aided Design, a (mechanical) spline, for example a flexible piece of wood, hard rubber, or metal, was used to help draw curves. To use a mechanical spline, pins were placed at a judicious selection of points along a curve in a design, then the spline was bent so that it touched each of these pins. Clearly, with this construction the spline interpolates the curve at these pins and could be used to reproduce the curve in other drawings1 . The location of the pins are called knots. We can change the shape of the curve defined by the spline by adjusting the location of the knots. For example, to interpolate to the data {(xi , fi )} we can place knots at each of the nodes xi . This produces a curve similar to a cubic spline. N To derive a mathematical model of this mechanical spline, suppose the data is {(xi , fi )}i=0 where, as for linear splines, x0 < x1 < · · · < xN . The shape of a mechanical spline suggests the curve between the pins is approximately a cubic polynomial. So, we model the mechanical spline by a mathematical cubic spline — a special piecewise cubic approximation. Mathematically, a cubic spline S3,N (x) is a C 2 piecewise cubic polynomial. This means that • S3,N (x) is piecewise cubic; that is, between consecutive knots xi p1 (x) = a1,0 + a1,1 x + a1,2 x2 + a1,3 x3 2 3 p2 (x) = a2,0 + a2,1 x + a2,2 x2 + a2,3 x3 p3 (x) = a3,0 + a3,1 x + a3,2 x + a3,3 x S3,N (x) = .. . pN (x) = aN,0 + aN,1 x + aN,2 x2 + aN,3 x3
x ∈ [x0 , x1 ] x ∈ [x1 , x2 ] x ∈ [x2 , x3 ] x ∈ [xN −1 , xN ]
where ai,0 , ai,1 , ai,2 and ai,3 are the coefficients in the power series representation of the ith cubic piece of S3,N (x). (Note: The approximation changes from one cubic polynomial piece to the next at the knots xi .)
• S3,N (x) is C 2 (read C two); that is, S3,N (x) is continuous and has continuous first and second derivatives everywhere in the interval [x0 , xN ] (and particularly at the knots). To be an interpolatory cubic spline we must have, in addition, • S3,N (x) interpolates the data; that is,
S3,N (xi ) = fi , i = 0, 1, · · · , N N
(Note: the points of interpolation {xi }i=0 are called nodes, and we have chosen them to coincide with the knots.) For the mechanical spline, the knots where S3,N (x) changes shape and the nodes where S3,N (x) interpolates are the same. For the mathematical spline, it is traditional to place the knots at the nodes, as in the definition of S3,N (x). However, this placement is a choice and not a necessity. Within each interval (xi−1 , xi ) the corresponding cubic polynomial pi (x) is continuous and has continuous derivatives of all orders. Therefore, S3,N (x) or one of its derivatives can be discontinuous only at a knot. For example, consider the following illustration of what happens at the knot xi . For xi−1 < x < xi , S3,N (x) has value pi (x) = ai,0 + ai,1 x + ai,2 x2 + ai,3 x3 Value of S3,N (x) as x → x− i pi (xi ) p"i (xi ) p""i (xi ) p""" i (xi )
For xi < x < xi+1 , S3,N (x) has value pi+1 (x) = ai+1,0 + ai+1,1 x + ai+1,2 x2 + ai+1,3 x3 Value of S3,N (x) as x → x+ i pi+1 (xi ) p"i+1 (xi ) p""i+1 (xi ) p""" i+1 (xi )
1 Splines were used frequently to trace the plan of an airplane wing. A master template was chosen, placed on the material forming the rib of the wing, and critical points on the template were transferred to the material. After removing the template, the curve defining the shape of the wing was “filled-in” using a mechanical spline passing through the critical points.
98
CHAPTER 4. CURVE FITTING
Observe that the function S3,N (x) has two cubic pieces incident to the interior knot xi ; to the left of xi it is the cubic pi (x) while to the right it is the cubic pi+1 (x). Thus, a necessary and sufficient condition for S3,N (x) to be continuous and have continuous first and second derivatives is for these two cubic polynomials incident at the interior knot to match in value, and in first and second derivative values. So, we have a set of Smoothness Conditions; that is, at each interior knot: p"i (xi ) = p"i+1 (xi ), p""i (xi ) = p""i+1 (xi ),
i = 1, 2, · · · , N − 1
In addition, to interpolate the data we have a set of Interpolation Conditions; that is, on the ith interval: pi (xi−1 ) = fi−1 , pi (xi ) = fi , i = 1, 2, · · · , N
This way of writing the interpolation conditions also forces S3,N (x) to be continuous at the knots. Each of the N cubic pieces has four unknown coefficients, so our description of the function S3,N (x) involves 4N unknown coefficients. Interpolation imposes 2N linear constraints on the coefficients, and assuring continuous first and second derivatives imposes 2(N − 1) additional linear constraints. (A linear constraint is a linear equation that must be satisfied by the coefficients of the polynomial pieces.) Therefore, there are a total of 4N − 2 = 2N + 2(N − 1) linear constraints on the 4N unknown coefficients. So that we have the same number of equations as unknowns, we need 2 more (linear) constraints and the whole set of constraints must be linearly independent . Natural Boundary Conditions A little thought about the mechanical spline as it is forced to touch the pins indicates why two constraints are missing. What happens to the spline before it touches the first pin and after it touches the last? If you twist the spline at its ends you find that its shape changes. A natural condition is to let the spline rest freely without stress or tension at the first and last knot, that is don’t twist it at the ends. Such a spline has “minimal energy”. Mathematically, this condition is expressed as the Natural Spline Condition: p""1 (x0 ) = 0, p""N (xN ) = 0 The so-called natural spline results when these conditions are used as the 2 missing linear constraints. Despite its comforting name and easily understood physical origin, the natural spline is seldom used since it does not deliver an accurate approximation S3,N (x) near the ends of the interval [x0 , xN ]. This may be anticipated from the fact that we are forcing a zero value on the second derivative when this is not necessarily the value of the second derivative of the function which the data measures. A natural cubic spline is built up from cubic polynomials, so it is reasonable to expect that if the data is measured from a cubic polynomial then the natural cubic spline will reproduce the cubic polynomial. However, for example, if the data are measured from the function f (x) = x2 then the natural spline S3,N (x) != f (x); the function f (x) = x2 has nonzero second derivatives at the nodes x0 and xN where value of the second derivative of the natural cubic spline S3,N (x) is zero by definition. Second Derivative Conditions To clear up the inaccuracy problem associated with the natural spline conditions we could replace them with the correct second derivative values p""1 (x0 ) = f "" (x0 ), p""N (xN ) = f "" (xN ) These second derivatives of the data are not usually available but they can be replaced by accurate approximations. If exact values or sufficiently accurate approximations are used then the resulting spline will be as accurate as possible for a cubic spline. (Such approximations may be obtained by using polynomial interpolation to sufficient data values separately near each end of the interval [x0 , xN ]. Then, the two interpolating polynomials are each twice differentiated and the resulting twice differentiated polynomials are evaluated at the corresponding endpoints to approximate the f "" there.)
99
4.2. POLYNOMIAL SPLINES Not-a-knot Conditions
A simpler, and usually sufficiently accurate, spline may be determined be replacing the boundary conditions by using the so-called not-a-knot conditions. Recall, at each knot, the spline S3,N (x) changes from one cubic to the next. The idea of the not-a-knot conditions is not to change cubic polynomials as one crosses both the first and the last interior nodes, x1 and xN −1 . [Then, x1 and xN −1 are no longer knots!] These conditions are expressed mathematically as the Not-a-Knot Conditions """ """ """ p""" 1 (x1 ) = p2 (x1 ), pN −1 (xN −1 ) = pN (xN −1 ).
By construction, the first two pieces, p1 (x) and p2 (x), of the cubic spline S3,N (x) agree in value, first, and second derivative at x1 . If p1 (x) and p2 (x) also satisfy the not-a-knot condition at x1 , it follows that p1 (x) ≡ p2 (x), that is, x1 is no longer a knot. Cubic Spline Accuracy
For each way of supplying the additional linear constraints that is discussed above, the system of 4N linear constraints has a unique solution as long as the knots are distinct. So, the cubic spline interpolant constructed using any one of the natural, the correct endpoint second derivative value, an approximated endpoint second derivative value, or the not-a-knot conditions is unique. This uniqueness result permits an estimate of the error associated with approximations by cubic splines. From the error bound for polynomial interpolation, for a cubic polynomial p3 (x) interpolating at data points in the interval [a, b], we have max
x∈[xi−1 ,xi ]
|f (x) − p3 (x)| ≤ Ch4 · max |f (4) (x)| x∈[a,b]
where C is a constant and h = maxi |xi − xi−1 |. We might anticipate that the error associated with approximation by a cubic spline behave like h4 for h small, as for an interpolating cubic polynomial. However, the maximum absolute error associated with the natural cubic spline approximation behaves like h2 as h → 0. In contrast, the maximum absolute error for a cubic spline based on correct endpoint second derivative values or on the not-a-knot conditions behaves like h4 . Unlike the natural cubic spline, the correct second derivative value and not-a-knot cubic splines reproduce cubic polynomials. That is, in both these cases, S3,N ≡ f on the interval [a, b] whenever the data values are measured from a cubic polynomial f . This reproducibility property is a necessary condition for the error in the cubic spline S3,N approximation to a general function f to behave like h4 . B-splines Codes that work with cubic splines do not use the power series representation of S3,N (x). Rather, often they represent the spline as a linear combination of cubic B–splines; this approach is similar to using a linear combination of the linear B-spline roof basis functions Li to represent a linear spline. B–splines have compact support, that is they are non-zero only inside a set of contiguous subintervals just like the linear spline roof basis functions. So, the linear B-spline basis function, Li , has support (is non-zero) over just the two contiguous intervals which combined make up the interval [xi−1 , xi+1 ], whereas the corresponding cubic B-spline basis function, Bi , has support (is non-zero) over four contiguous intervals which combined make up the interval [xi−2 , xi+2 ]. Construction of a B-spline Assume the points xi are equally spaced with spacing h. We’ll construct Bp (x) the cubic B-spline centered on xp . We know already that Bp (x) is a cubic spline that is identically zero outside the interval [xp −2h, xp +2h] and has knots at xp −2h, xp −h, xp , xp +h, and xp +2h. We’ll normalize it at xp by requiring Bp (xp ) = 1. So on the interval [xp −2h, xp −h] we can choose Bp (x) = A(x−[xp −2h])3 where A is a constant to be determined later. This is continuous and has continuous first and second derivatives matching the zero function at the knot xp − 2h. Similarly on the interval [xp + h, xp + 2h] we can choose Bp (x) = −A(x − [xp + 2h])3 where A will turn out to be the same constant by
100
CHAPTER 4. CURVE FITTING
symmetry. Now, we need Bp (x) to be continuous and have continuous first and second derivatives at the knot xp − h. This is achieved by choosing Bp (x) = A(x − [xp − 2h])3 + B(x − [xp − h])3 on the interval [xp − h, xp ] and similarly Bp (x) = −A(x − [xp + 2h])3 − B(x − [xp + h])3 on the interval [xp , xp + h] where again symmetry ensures the same constants. Now, all we need to do is to fix up the constants A and B to give the required properties at the knot x = xp . Continuity and the requirement Bp (xp ) = 1 give A(xp − [xp − 2h])3 + B(xp − [xp − h])3 = −A(xp − [xp + 2h])3 − B(xp − [xp + h])3 = 1 that is
8h3 A + h3 B = −8(−h)3 A − (−h)3 B = 1
which gives one equation, 8A + B = continuity at the knot x = xp gives
1 h3 ,
for the two constants A and B. Now first derivative
3A(xp − [xp − 2h])2 + 3B(xp − [xp − h])2 = −3A(xp − [xp + 2h])2 − 3B(xp − [xp + h])2 After cancellation, this reduces to 4A + B = −4A − B. The second derivative continuity condition gives an identity. So, solving we have B = −4A. Hence A = 4h1 3 and B = − h13 . So, 0, x < xp − 2h 1 3 (x − [x − 2h]) , xp − 2h ≤ x < xp − h 3 p 4h1 1 3 3 (x − [x − 2h]) − (x − [x − h]) , x p p p − h ≤ x < xp 4h3 h3 Bp (x) = 1 1 3 3 − (x − [x + 2h]) + (x − [x + h]) , x p p p ≤ x < xp + h 4h3 h3 1 3 (x − [x + 2h]) , x − 3 p p + h ≤ x < xp + 2h 4h 0, x ≥ xp + 2h Interpolation using Cubic B-splines
Suppose we have data {xi , fi }ni=0 and the points xi are equally spaced so that xi = x0 + ih. Define the “exterior” equispaced points x−i , xn+i , i = 1, 2, 3 then these are all the points we need to define the B-splines Bi (x), i = −1, 0, . . . , n + 1. This is the B-spline basis; that is, the set of all B-splines which are nonzero in the interval [x0 , xn ]. We seek a B-spline interpolant of the form ;n+1 Sn (x) = i=−1 ai Bi (x). The interpolation conditions give n+1 2
ai Bi (xj ) = fj , j = 0, 1, . . . , n
i=−1
which simplifies to aj−1 Bj−1 (xj ) + aj Bj (xj ) + aj+1 Bj+1 (xj ) = fj , j = 0, 1, . . . , n as all other terms in the sum are zero at x = xj . Now, by definition Bj (xj ) = 1, and we compute Bj−1 (xj ) = Bj+1 (xj ) = 14 by evaluating the above expression for the B-spline, giving the equations 1 1 4 a−1 + a0 + 4 a1 1 1 4 a0 + a1 + 4 a2
.. . 1 1 a + a n−1 n + 4 an+1 4
= f0 = f1 = fn
These are n + 1 equations in the n + 3 unknowns aj , j = −1, 0, . . . , n + 1. The additional equations come from applying the boundary conditions. For example, if we apply the natural spline conditions S "" (x0 ) = S "" (xn ) = 0 we get the two additional equations 3 3 3 2h2 a−1 − h2 a0 + 2h2 a1 3 3 3 2h2 an−1 − h2 an + 2h2 an+1
= =
0 0
101
4.3. CHEBYSHEV POLYNOMIALS AND SERIES
The full set of n + 3 linear equations may be solved by GE but we can simplify the equations. Taking the first of the additional equations and the first of the previous set together we get a0 = 23 f0 ; similarly, from the last equations we find an = 23 fn . So the set of linear equations reduces to a1 + 14 a2 + a2 + 14 a3 + a3 + 14 a4 .. .
= f1 − 16 f0 = f2 = f3
1 4 a1 1 4 a2
1 1 4 an−3 + an−2 + 4 an−1 1 4 an−2 + an−1
The coefficient matrix of this linear system is 1 14 1 1 4 .. .
1 4
..
1 4
.
= fn−2 = fn−1 − 16 fn
..
. 1 1 4
1 4
1
Matrices of this structure are known as tridiagonal and this particular tridiagonal matrix is of a special type known as positive definite. For this type of matrix interchanges are not needed for the stability of GE. When interchanges are not needed for a tridiagonal system, GE reduces to a particularly simple algorithm. After we have solved the linear equations for a1 , a2 , . . . , an−1 we can compute the values of a−1 and an+1 from the “additional” equations above. Problem 4.2.3. Let r(x) = r0 + r1 x + r2 x2 + r3 x3 and s(x) = s0 + s1 x + s2 x2 + s3 x3 be cubic polynomials in x. Suppose that the value, first, second, and third derivatives of r(x) and s(x) agree at some point x = a. Show that r0 = s0 , r1 = s1 , r2 = s2 , and r3 = s3 , i.e., r(x) and s (x) are the same cubic. [Note: This is another form of the polynomial uniqueness theorem.] Problem 4.2.4. Write down the equations determining the coefficients of the not-a-knot cubic spline interpolating to the data (0, 1), (1, 0), (2, 3) and (3, 2). Just four equations are sufficient. Why? Problem 4.2.5. Let the knots be at the integers, i.e. xi = i, so B0 (x) has support on the interval [−2, +2]. Construct B0 (x) so that it is a cubic spline normalized so that B0 (0) = 1. [Hint: Since B0 (x) is a cubic spline it must be piecewise cubic and it must be continuous and have continuous first and second derivatives at all the knots, and particularly at the knots −2, −1, 0, +1, +2.] Problem 4.2.6. In the derivation of the linear system for B-spline interpolation replace the equations corresponding to the natural boundary conditions by equations corresponding to (a) exact second derivative conditions and (b) knot-a-knot conditions. In both cases use these equations to eliminate the coefficients a−1 and an+1 and write down the structure of the resulting linear system. Problem 4.2.7. Is the following function S(x) a cubic spline? Why or why not? 0, x < 0 3 x , 0≤x ? ;N xjr a0 + a1 xr + · · · + aM xM − r=0 fr xjr ] r ;N ;N ;N ;N − r=0 fr xjr ] + · · · + aM r=0 xj+M = 2[a0 r=0 xjr + a1 r=0 xj+1 r r = 2[
;N
r=0
∂ σM = 0 may be rewritten as the Normal Equations: ∂aj a0
N 2
xjr + a1
r=0
N 2 r=0
+ · · · + aM xj+1 r
In matrix form the Normal Equations ;N ;N r=0 1 r=0 xr ; ; N N 2 r=0 xr r=0 xr . . .. .. ;N ; N M M +1 r=0 xr r=0 xr
N 2
xrj+M =
N 2 r=0
r=0
may be written ;N M ··· r=0 xr ;N M +1 ··· r=0 xr . . .. . . ;N 2M ··· r=0 xr
fr xjr , j = 0, 1, · · · , M
a0 a1 .. . aM
;N r=0 fr ;N fr xr r=0 = . . . ;N M r=0 fr xr
The coefficient matrix of the Normal Equations has special properties (it is both symmetric and positive definite). These properties permit the use of an accurate, efficient version of Gaussian Elimination which exploits these properties, without the need for partial pivoting by rows for size. However, if M is at all large, the Normal Equations tend to be ill-conditioned and their direct solution is usually avoided. N
Example 4.4.2. To compute a straight line fit a0 + a1 x to the data {(xi , fi )}i=0 we set M = 1 in the Normal Equations to give ;N ;N ;N a0 r=0 1 + a1 r=0 xr = fr ;N ;N ;r=0 N a0 r=0 xr + a1 r=0 x2r = r=0 fr xr
Substituting the data
i 0 1 2 3
xi 1 3 4 5
fi 2 4 3 1
from Example 4.4.1 we have the Normal Equations 4a0 + 13a1 130 + 51a1 which gives the same result as in Example 4.4.1.
= 10 = 31
108
CHAPTER 4. CURVE FITTING N
Example 4.4.3. To compute a quadratic fit a0 + a1 x + a2 x2 to the data {(xi , fi )}i=0 we set M = 2 in the Normal Equations to give ;N ;N ;N ;N a0 r=0 1 + a1 r=0 xr + a2 r=0 x2r = fr ;N ;N ;N ;r=0 N a0 r=0 xr + a1 r=0 x2r + a2 r=0 x3r = fr xr ;r=0 ;N ;N ;N N 4 3 2 2 a0 r=0 xr + a1 r=0 xr + a2 r=0 xr = r=0 fr xr
The least squares formulation permits more general functions pM (x) than simply polynomials, but the unknown coefficients in pM (x) must still occur linearly. The most general form is pM (x) = a0 φ0 (x) + a1 φ1 (x) + · · · + aM φM (x) =
M 2
ar φr (x)
r=0
M
where the basis {φr (x)}r=0 is chosen with respect to the data points; a basis must be linearly independent (for example, the powers of x or the Chebyshev polynomials). By analogy with the power series case, the linear system of Normal Equations is a0
N 2 r=0
φ0 (xr )φj (xr ) + a1
N 2 r=0
φ1 (xr )φj (xr ) + · · · + aM
N 2 r=0
for j = 0, 1, · · · , M . Again, the coefficient matrix ;N ;N φ0 (xr )2 ··· r=0 r=0 φ0 (xr )φ1 (xr ) ;N φ1 (xr )φ0 (xr ) ;N φ1 (xr )2 · ·· r=0 r=0 . . . .. .. .. ;N ;N r=0 φM (xr )φ1 (xr ) · · · r=0 φM (xr )φ0 (xr )
φM (xr )φj (xr ) =
N 2
fr φj (xr )
r=0
;N r=0 φ0 (xr )φM (xr ) ;N r=0 φ1 (xr )φM (xr ) .. . ;N 2 r=0 φM (xr )
of this linear system is symmetric and positive definite, and potentially ill-conditioned. In particular, the basis functions φj could be, for example, a linear polynomial spline basis, a cubic polynomial B–spline basis, Chebyshev polynomials in a Chebyshev series fit, or a set of linearly independent trigonometric functions. N
Problem 4.4.1. Consider the data {(xi , fi )}i=0 . Argue why the interpolating polynomial of degree N is also the least squares polynomial of degree N . Hint: What is the value of σ(qN ) when qN (x) is the interpolating polynomial? N
Problem 4.4.2. Show that σ0 ≥ σ1 ≥ · · · ≥ σN = 0 for any set of data {(xi , fi )}i=0 . Hint: The proof follows from the definition of minimization. ∂ ∂ σ1 = 0 and σ1 = 0 Problem 4.4.3. Using the chain rule, derive the minimizing equations ∂a0 ∂a1 ;N 2 directly by differentiating σ1 = r=0 {p1 (xr ) − fr } without first substituting the data and multiplying out. Then, substitute the data in Example 4.4.1 in the result to derive the Normal Equations.
Problem 4.4.4. Find the least squares constant fit p0 (x) = a0 to the data in Example 4.4.1. Plot the data, and both the constant and the linear least squares fits on one graph. Problem 4.4.5. Find the least squares linear fit p1 (x) = a0 + a1 x to the following data. Explain why you believe your answer is correct? i 0 1 2 3 4
xi 1 3 4 5 7
fi 1 1 1 1 1
109
4.4. LEAST SQUARES FITTING Problem 4.4.6. Find the least squares quadratic polynomial fits to each of the data sets:
and
i 0 1 2 3 4
xi −2 −1 0 1 2
fi 6 3 1 3 6
i 0 1 2 3 4
xi −2 −1 0 1 2
fi −5 −3 0 3 5
Problem 4.4.7. Use the chain rule to derive the Normal Equations for the general basis functions M {φj }j=0 . Problem 4.4.8. Write down the Normal Equations for the following choice of basis functions: φ0 (x) = 1, φ1 (x) = sin(x) and φ2 (x) = cos(x). Find the coefficients a0 , a1 and a2 for a least squares fit to the data i xi fi 0 −2 −5 1 −1 −3 2 0 0 3 1 3 4 2 5 Problem 4.4.9. Write down the Normal Equations for the following choice of basis functions: φ0 (x) = T0 (x), φ1 (x) = T1 (x) and φ2 (x) = T2 (x). Find the coefficients a0 , a1 and a2 for a least squares fit to the data in the Problem 4.4.8.
110
CHAPTER 4. CURVE FITTING
4.5
Matlab Notes
Matlab has several functions designed specifically for manipulating polynomials, and for curve fitting. Some functions that are relevant to the topics discussed in this chapter include: polyfit
used to create the coefficients of an interpolating or least squares polynomial
polyval
used to evaluate a polynomial
spline
used to create, and evaluate, an interpolatory cubic spline
pchip
used to create, and evaluate, a piecewise cubic Hermite interpolating polynomial
interp1
used to create, and evaluate, a variety of piecewise interpolating polynomials, including linear and cubic splines, and piecewise cubic Hermite polynomials
ppval
used to evaluate a piecewise polynomial, such as given by spline, pchip or interp1
In general, these functions assume a canonical representation of the power series form of a polynomial to be p(x) = a1 xN + a2 xN −1 + · · · + aN x + aN +1 .
Note that this is slightly different than the notation used in Section 4.1, but in either case, all that is needed to represent the polynomial is a vector of coefficients. Using Matlab’s canonical form, the vector representing p(x) is: @ A a = a1 ; a2 ; · · · aN ; aN +1 .
Note that although a could be a row or a column vector, we will generally use column vectors.
Example 4.5.1. Consider the polynomial p(x) = 7x3 − x2 + 1.5x− 3. Then the vector of coefficients that represents this polynomial is given by: >> a = [7; -1; 1.5; -3]; Similarly, the vector of coefficients that represents the polynomial p(x) = 7x5 − x4 + 1.5x2 − 3x is given by: >> a = [7; -1; 0; 1.5; -3; 0]; Notice that it is important to explicitly include any zero coefficients when constructing the vector a.
4.5.1
Polynomial Interpolation
In Section 4.1, we constructed interpolating polynomials using three different forms: power series, Newton and Lagrange forms. Matlab’s main tool for polynomial interpolation, polyfit, uses the power series form. To understand how this function is implemented, suppose we are given data points (x1 , f1 ), (x2 , f2 ), , . . . , (xN +1 , fN +1 ). Recall that to find the power series form of the (degree N ) polynomial that interpolates this data, we need to find the coefficients, ai , of the polynomial p(x) = a1 xN + a2 xN −1 + · · · + aN x + aN +1
111
4.5. MATLAB NOTES such that p(xi ) = fi . That is, p(x1 ) = f1 p(x2 ) = f2
N −1 ⇒ a1 xN + · · · + aN x1 + aN +1 = f1 1 + a2 x1 N −1 ⇒ a1 xN + a x + · · · + aN x2 + aN +1 = f2 2 2 2 .. .
p(xN ) = fN p(xN +1 ) = fN +1
N −1 + · · · + aN xN + aN +1 = fN ⇒ a1 xN N + a2 xN N −1 + a x ⇒ a1 xN 2 N +1 + · · · + aN xN +1 + aN +1 = fN +1 N +1
or, more precisely, we need to solve the linear system V a = f :
xN 1 xN 2 .. .
−1 xN 1 N −1 x2 .. .
··· ···
xN N xN N +1
N −1 xN N −1 xN +1
··· xN · · · xN +1
x1 x2 .. .
1 1 .. .
a1 a2 .. .
1 aN aN +1 1
=
f1 f2 .. . fN fN +1
.
In order to write a Matlab function implementing this approach, we need to: • Define vectors containing the given data: @ A x = x1 ; x2 ; · · · xN +1 @ A f = f1 ; f2 ; · · · fN +1 • Let n = length(x) = N + 1.
• Construct the n × n matrix, V , which can be done one column at a time using the vector x: jth column of V = V(:, j) = x .^ (n-j) • Solve the linear system, V a = f , using Matlab’s backslash operator: a = V \ f Putting these steps together, we obtain the following function:
function a = InterpPow1(x, f) % % a = InterpPow1(x, f); % % Construct the coefficients of a power series representation of the % polynomial that interpolates the data points (x_i, f_i): % % p = a(1)*x^N + a(2)*x^(N-1) + ... + a(N)*x + a(N+1) % n = length(x); V = zeros(n, n); for j = 1:n V(:, j) = x .^ (n-j); end a = V \ f;
112
CHAPTER 4. CURVE FITTING
We remark that Matlab provides a function, vander, that can be used to construct the matrix V from a given vector x. Using vander in place of the first five lines of code in InterPow1, we obtain the following function:
function a = InterpPow(x, f) % % a = InterpPow(x, f); % % Construct the coefficients of a power series representation of the % polynomial that interpolates the data points (x_i, f_i): % % p = a(1)*x^N + a(2)*x^(N-1) + ... + a(N)*x + a(N+1) % V = vander(x); a = V \ f;
Problem 4.5.1. Implement InterpPow, and use it to find the power series form of the polynomial that interpolates the data (−1, 0), (0, 1), (1, 3). Compare the results with that found in Example 4.1.2. Problem 4.5.2. Implement InterpPow, and use it to find the power series form of the polynomial that interpolates the data (1, 2), (3, 3), (5, 4). Compare the results with what you computed by hand in Problem 4.1.3. The built-in Matlab function, polyfit, essentially uses the approach outlined above to construct an interpolating polynomial. The basic usage of polyfit is: a = polyfit(x, f, N) where N is the degree of the interpolating polynomial. In general, provided the xi values are distinct, N = length(x) - 1 = length(f) - 1. As we see later, polyfit can be used for polynomial least squares data fitting by choosing a different (usually smaller) value for N. Once the coefficients are computed, we may want to plot the resulting interpolating polynomial. Recall that to plot any function, including a polynomial, we must first evaluate it at many (e.g., 200) points. Matlab provides a built-in function, polyval, that can be used to evaluate polynomials: y = polyval(a, x); Note that polyval requires the first input to be a vector containing the coefficients of the polynomial, and the second input a vector containing the values at which the polynomial is to be evaluated. At this point, though, we should be sure to distinguish between the (relatively few) ”data points” used to construct the interpolating polynomial, and the (relatively many) ”evaluation points” used for plotting. An example will help to clarify the procedure. Example 4.5.2. Consider the data points (−1, 0), (0, 1), (1, 3). First, plot the data using circles, and set the axis to an appropriate scale: x_data = [-1 0 1]; f_data = [0 1 3]; plot(x_data, f_data, ’o’) axis([-2, 2, -1, 6])
113
4.5. MATLAB NOTES
Now we can construct and plot the polynomial that interpolates this data using the following set of Matlab statements: hold on a = polyfit(x_data, f_data, length(x_data)-1); x = linspace(-2,2,200); y = polyval(a, x); plot(x, y) By including labels on the axes, and a legend (see Section 1.3.2): xlabel(’x’) ylabel(’y’) legend(’Data points’,’Interpolating polynomial’, ’Location’, ’NW’) we obtain the plot shown in Fig. 4.12. Note that we use different vectors to distinguish between the given data (x data and f data) and the set of points x and values y used to evaluate and plot the resulting interpolating polynomial.
6 Data points Interpolating polynomial 5
4
y
3
2
1
0
−1 −2
−1.5
−1
−0.5
0 x
0.5
1
1.5
2
Figure 4.12: Plot generated by the Matlab code in Example 4.5.2. Although the power series approach usually works well for a small set of data points, one difficulty that can arise, especially when attempting to interpolate a large set of data, is that the matrix V may be very ill-conditioned. Recall that an ill-conditioned matrix is close to singular, in which case large errors can occur when solving V a = f . Thus, if V is ill-conditioned, the computed polynomial coefficients may be inaccurate. Matlab’s polyfit function checks V and displays a warning message if it detects it is ill-conditioned. In this case, we can try the alternative calling sequence of polyfit and polyval: [a, s, mu] = polyfit(x_data, f_data, length(x_data)-1); y = polyval(a, x, s, mu); This forces polyfit to first rescale x data (using its mean and standard deviation) before constructing the matrix V and solving the corresponding linear system. This usually results in a matrix that is better-conditioned.
114
CHAPTER 4. CURVE FITTING
Example 4.5.3. Consider the following set of data, obtained from the National Weather Service, http://www.srh.noaa.gov/fwd, which shows average high and low temperatures, total precipitation, and the number of clear days for each month in 2003 for Dallas-Fort Worth, Texas.
Month Avg. High Avg. Low Precip. Clear Days
1 54.4 33.0 0.22 15
2 54.6 36.6 3.07 6
Monthly Weather Data, 2003 Dallas - Fort Worth, Texas 3 4 5 6 7 8 67.1 78.3 85.3 88.7 96.9 97.6 45.2 55.6 65.6 69.3 75.7 75.8 0.85 1.90 2.53 5.17 0.08 1.85 10 11 4 9 13 10
9 84.1 64.9 3.99 11
10 80.1 57.4 0.78 13
11 68.8 50.0 3.15 7
12 61.1 38.2 0.96 18
Suppose we attempt to fit an interpolating polynomial to the average high temperatures. Our first attempt might use the following set of Matlab commands: x_data = 1:12; f_data = [54.4 54.6 67.1 78.3 85.3 88.7 96.9 97.6 84.1 80.1 68.8 61.1]; a = polyfit(x_data, f_data, 11); x = linspace(1, 12, 200); y = polyval(a, x); plot(x_data, f_data, ’o’) hold on plot(x, y) If we run these commands in Matlab, then a warning message is printed in the command window indicating that V is ill-conditioned. If we replace the two lines containing polyfit and polyval with: [a, s, mu] = polyfit(x_data, f_data, 11); y = polyval(a, x, s, mu); the warning no longer occurs. The resulting plot is shown in Fig. 4.13 (we also made use of the Matlab commands axis, legend, xlabel and ylabel). Notice that the polynomial does not appear to provide a good model of the monthly temperature changes between months 1 and 2, and between months 11 and 12. This is a mild example of the more serious problem, discussed in Section 4.1.4, of excessive oscillation of the interpolating polynomial. A more extreme illustration of this is the following example. Example 4.5.4. Suppose we wish to construct an interpolating polynomial approximation of the function f (x) = sin(x + sin 2x) on the interval [− π2 , 3π 2 ]. The following Matlab code can be used to construct an interpolating polynomial approximation of f (x) using 11 equally spaced points: f = @(x) sin(x+sin(2*x)); x_data = linspace(-pi/2, 3*pi/2, 11); f_data = f(x_data); a = polyfit(x_data, f_data, 10); A plot of the resulting polynomial is shown on the left of Fig. 4.14. Notice that, as with Runge’s example (Example 4.1.4), the interpolating polynomial has severe oscillations near the end points of the interval. However, because we have an explicit function that can be evaluated, instead of using equally spaced points, we can choose to use the Chebyshev points. In Matlab these points can be generated as follows: c = -pi/2;, d = 3*pi/2; N = 10;, I = 0:N; x_data = (c+d)/2 - (d-c)*cos((2*I+1)*pi/(2*N+2))/2;
115
4.5. MATLAB NOTES 110 Data Interpolating polynomial 100
temperature, degrees Fahrenheit
90
80
70
60
50
40
30
0
2
4
6
8
10
12
month
Figure 4.13: Interpolating polynomial from Example 4.5.3 Notice that I is a vector containing the integers 0, 1, . . . , 9, and that we avoid using a loop to create x data by making use of Matlab’s ability to operate on vectors. Using this x data, and the corresponding f data = f(x data) to construct the interpolating polynomial, we can create the plot shown on the right of Fig. 4.14. We observe from this example that much better approximations can be obtained by using the Chebyshev points instead of equally spaced points. Interpolation using equally spaced points.
Interpolation using Chebyshev points.
2.5
2.5 True function Interpolating poly. Interpolation points
2
1.5
1.5
1
1
0.5
0.5
0
0
−0.5
−0.5
−1
−1
−1.5
−1.5
−2 −2
−1
0
1
2
True function Interpolating poly. Interpolation points
2
3
4
5
−2 −2
−1
0
1
2
3
4
5
Figure 4.14: Interpolating polynomials for f (x) = sin(x + sin 2x) on the interval [− π2 , 3π 2 ]. The plot on the left uses 11 equally spaced points, and the plot on the right uses 11 Chebyshev points to generate the interpolating polynomial.
Problem 4.5.3. Consider the data (0, 1), (1, 2), (3, 3) and (5, 4). Construct a plot that contains the data (as circles) and the polynomial of degree 3 that interpolates this data. You should use the axis command to make the plot look sufficiently nice.
116
CHAPTER 4. CURVE FITTING
Problem 4.5.4. Consider the data (1, 1), (3, 1), (4, 1), (5, 1) and (7, 1). Construct a plot that contains the data (as circles) and the polynomial of degree 4 that interpolates this data. You should use the axis command to make the plot look sufficiently nice. Do you believe the curve is a good representation of the data? Problem 4.5.5. Construct plots that contain the data the following sets of data: xi fi −2 6 −1 3 and 0 1 1 3 2 6
(as circles) and interpolating polynomials for xi −2 −1 0 1 2
fi −5 −3 0 3 5
Problem 4.5.6. Construct interpolating polynomials through all four sets of weather data given in Example 4.5.3. Use subplot to show all four plots in the same figure, and use the title, xlabel and ylabel commands to document the plots. Each plot should show the data points as circles on the corresponding curves. Problem 4.5.7. Consider the function given in Example 4.5.4. Write a Matlab script m-file to create the plots shown in Fig. 4.14. Experiment with using more points to construct the interpolating polynomial, starting with 11, 12, . . . . At what point does Matlab print a warning that the polynomial is badly conditioned (both for equally spaced and Chebyshev points)? Does centering and scaling improve the results?
4.5.2
Polynomial Splines
Polynomial splines help to avoid excessive oscillations by fitting the data using a collection of low degree polynomials. We’ve actually already used linear polynomial splines to connect data via Matlab’s plot command. But we can create this linear spline more explicitly using the interp1 function. The basic calling syntax is given by: y = interp1(x_data, f_data, x); where • x data and f data are vectors containing the given data points, • x is a vector containing values at which the linear spline is to be evaluated (e.g., for plotting the spline), and • y is a vector containing S(x) values. The following example illustrates how to use interp1 to construct, evaluate, and plot a linear spline interpolant. Example 4.5.5. Consider the average high temperatures from Example 4.5.3. The following set of Matlab commands can be used to construct a linear spline interpolant of this data: x_data = 1:12; f_data = [54.4 54.6 67.1 78.3 85.3 88.7 96.9 97.6 84.1 80.1 68.8 61.1]; x = linspace(1, 12, 200); y = interp1(x_data, f_data, x); plot(x_data, f_data, ’o’) hold on plot(x, y)
117
4.5. MATLAB NOTES 110 Data Linear spline 100
temperature, degrees Fahrenheit
90
80
70
60
50
40
30
0
2
4
6
8
10
12
month
Figure 4.15: Linear polynomial spline interpolant for average high temperature data given in Example 4.5.3 The resulting plot is shown in Fig. 4.15. Note that we also used the Matlab commands axis, legend, xlabel and ylabel to make the plot look a bit nicer. We can obtain a smoother curve by using a higher degree spline. The primary Matlab function for this purpose, spline, constructs a cubic spline interpolant. The basic calling syntax, which uses, by default, not-a-knot end conditions, is as follows: y = spline(x_data, f_data, x); where x data, f data, x and y are defined as for interp1. The following example illustrates how to use spline to construct, evaluate, and plot a cubic spline interpolant. Example 4.5.6. Consider again the average high temperatures from Example 4.5.3. The following set of Matlab commands can be used to construct a cubic spline interpolant of this data: x_data = 1:12; f_data = [54.4 54.6 67.1 78.3 85.3 88.7 96.9 97.6 84.1 80.1 68.8 61.1]; x = linspace(1, 12, 200); y = spline(x_data, f_data, x); plot(x_data, f_data, ’o’) hold on plot(x, y) The resulting plot is shown in Fig. 4.16. Note that we also used the Matlab commands axis, legend, xlabel, ylabel and title to make the plot look a bit nicer. It should be noted that other end conditions can be used, if they can be defined by the slope of the spline at the end points. In this case, the desired slope values at the end points are are attached to the beginning and end of the vector f data. This is illustrated in the next example.
118
CHAPTER 4. CURVE FITTING Default, not−a−knot end conditions 110 Data Cubic spline 100
temperature, degrees Fahrenheit
90
80
70
60
50
40
30
0
2
4
6
8
10
12
month
Figure 4.16: Cubic polynomial spline interpolant, using not-a-knot end conditions, for average high temperature data given in Example 4.5.3 Example 4.5.7. Consider again the average high temperatures from Example 4.5.3. The so-called clamped end conditions assume the slope of the spline is 0 at the end points. The following set of Matlab commands can be used to construct a cubic spline interpolant with clamped end conditions: x_data = 1:12; f_data = [54.4 54.6 67.1 78.3 85.3 88.7 96.9 97.6 84.1 80.1 68.8 61.1]; x = linspace(1, 12, 200); y = spline(x_data, [0, f_data, 0], x); plot(x_data, f_data, ’o’) hold on plot(x, y) Observe that, when calling spline, we replaced f data with the vector [0, f data, 0]. The first and last values in this augmented vector specify the desired slope of the spline (in this case zero) at the end points. The resulting plot is shown in Fig. 4.17 Note that we also used the Matlab commands axis, legend, xlabel, ylabel and title to make the plot look a bit nicer. In all of the previous examples using interp1 and spline, we construct and evaluate the spline in one command. Recall that for polynomial interpolation we used polyfit and polyval in a two step process. It is possible to use a two step process with both linear and cubic splines as well. For example, when using spline, we can execute the following commands: S = spline(x_data, f_data); y = ppval(S, x); where x is a set of values at which the spline is to be evaluated. If we specify only two input arguments to spline, it returns a structure array that defines the piecewise cubic polynomial, S(x), and the function ppval is then used to evaluate S(x). In general, if all we want to do is evaluate and/or plot S(x), it is not necessary to use this two step process. However, there may be situations for which we must access explicitly the polynomial
119
4.5. MATLAB NOTES Clamped end conditions 110 Data Cubic spline 100
temperature, degrees Fahrenheit
90
80
70
60
50
40
30
0
2
4
6
8
10
12
month
Figure 4.17: Cubic polynomial spline interpolant, using clamped end conditions, for average high temperature data given in Example 4.5.3 pieces. For example, we could find the maximum and minimum (i.e., critical points) of S(x) by explicitly computing S " (x). Another example is given in Section 5.6 where the cubic spline is used to integrate tabular data. We end this subsection by mentioning that Matlab has another function, pchip, that can be used to construct a piecewise Hermite cubic interpolating polynomial, H(x). In interpolation, the name Hermite is usually attached to techniques that use specific slope information in the construction of the polynomial pieces. Although pchip constructs a piecewise cubic polynomial, strictly speaking, it is not a spline because the second derivative may be discontinuous at the knots. However, the first derivative is continuous. The slope information used to construct H(x) is determined from the data. In particular, if there are intervals where the data are monotonic, then so is H(x), and at points where the data has a local extremum, so does H(x). We can use pchip exactly as we use spline; that is, either one call to construct and evaluate: y = pchip(x_data, f_data, x); or via a two step approach to construct and then evaluate: H = pchip(x_data, f_data); y = ppval(H, x); where x is a set of values at which H(x) is to be evaluated. Example 4.5.8. Consider again the average high temperatures from Example 4.5.3. The following set of Matlab commands can be used to construct a piecewise cubic Hermite interpolating polynomial through the given data: x_data = 1:12; f_data = [54.4 54.6 67.1 78.3 85.3 88.7 96.9 97.6 84.1 80.1 68.8 61.1]; x = linspace(1, 12, 200); y = pchip(x_data, f_data, x);
120
CHAPTER 4. CURVE FITTING plot(x_data, f_data, ’o’) hold on plot(x, y)
The resulting plot is shown in Fig. 4.18 As with previous examples, we also used the Matlab commands axis, legend, xlabel and ylabel to make the plot look a bit nicer. 110 Data PCHIP interpolation 100
temperature, degrees Fahrenheit
90
80
70
60
50
40
30
0
2
4
6
8
10
12
month
Figure 4.18: Piecewise cubic Hermite interpolating polynomial, for average high temperature data given in Example 4.5.3 Notice that the curve generated by pchip is smoother than the piecewise linear spline, but because pchip does not guarantee continuity of the second derivative, it is not as smooth as the cubic spline interpolant. In addition, the flat part on the left, between the months January and February, is probably not an accurate representation of the actual temperatures for this time period. Similarly, the maximum temperature at the August data point (which is enforced by the pchip construction) may not be accurate; more likely is that the maximum temperature occurs some time between July and August. We mention these things to emphasize that it is often extremely difficult to produce an accurate, physically reasonable fit to data. Problem 4.5.8. Consider the data (0, 1), (1, 2), (3, 3) and (5, 4). Use subplot to make a figure with 4 plots: a linear spline, a cubic spline with not-a-knot end conditions, a cubic spline with clamped end conditions, and a piecewise cubic Hermite interpolating polynomial fit of the data. Each plot should also show the data points as circles on the curve, and should have a title indicating which of the four methods was used.
121
4.5. MATLAB NOTES Problem 4.5.9. Consider the following sets of data: xi −2 −1 0 1 2
fi 6 3 1 3 6
and
xi −2 −1 0 1 2
fi −5 −3 0 3 5
Make two figures, each with four plots: a linear spline, a cubic spline with not-a-knot end conditions, a cubic spline with clamped end conditions, and a piecewise cubic Hermite interpolating polynomial fit of the data. Each plot should also show the data points as circles on the curve, and should have a title indicating which of the four methods was used. Problem 4.5.10. Consider the four sets of weather data given in Example 4.5.3. Make four figures, each with four plots: a linear spline, a cubic spline with not-a-knot end conditions, a cubic spline with clamped end conditions, and a piecewise cubic Hermite interpolating polynomial fit of the data. Each plot should also show the data points as circles on the curve, and should have a title indicating which of the four methods was used. Problem 4.5.11. Notice that there is an obvious ”wobble” at the left end of the plot given in Fig. 4.16. Repeat the previous problem, but this time shift the data so that the year begins with April. Does this help eliminate the wobble? Does shifting the data have an effect on any of the other plots?
4.5.3
Chebyshev Polynomials and Series
Matlab does not provide any specific functions to construct a Chebyshev representation of the interpolating polynomial. However, it is not difficult to write our own Matlab functions similar to polyfit, spline and pchip. Recall that if x ∈ [−1, 1], the jth Chebyshev polynomial, Tj (x), is defined as Tj (x) = cos(j arccos(x)), j = 0, 1, 2, ... We can easily plot Chebyshev polynomials with just a few Matlab commands. Example 4.5.9. The following set of Matlab commands can be used to plot the 5th Chebyshev polynomial. x = linspace(-1, 1, 200); y = cos( 5*acos(x) ); plot(x, y) Recall that the Chebyshev form of the interpolating polynomial (for x ∈ [−1, 1]) is p(x) = b0 T0 (x) + b1 T1 (x) + · · · + bN TN (x). Suppose we are given data (xi , fi ), i = 0, 1, . . . , N , and that −1 ≤ xi ≤ 1. To construct Chebyshev form of the interpolating polynomial, we need to determine the coefficients b0 , b1 , . . . , bN such that p(xi ) = fi . That is, p(x0 ) = f0 p(x1 ) = f1 p(xN ) = fN
⇒ b0 T0 (x0 ) + b1 T1 (x0 ) + · · · + bN TN (x0 ) = f1 ⇒ b0 T0 (x1 ) + b1 T1 (x1 ) + · · · + bN TN (x1 ) = f2 .. .
⇒ b0 T0 (xN ) + b1 T1 (xN ) + · · · + bN TN (xN ) = fN
122
CHAPTER 4. CURVE FITTING
or, more precisely, we need to solve the linear system T b = f : b0 T0 (x0 ) T1 (x0 ) · · · TN (x0 ) T0 (x1 ) T1 (x1 ) · · · TN (x1 ) b1 .. = .. .. .. . . . . bN T0 (xN ) T1 (xN ) · · · TN (xN )
f0 f1 .. . fN
.
If the data xi are not all contained in the interval [−1, 1], then we must perform a variable transformation. For example, x ¯j = −
xj − xmx xj − xmn 2xj − xmx − xmn + = , xmn − xmx xmx − xmn xmx − xmn
where xmx = max(xi ) and xmn = min(xi ). Notice that when xj = xmn , x ¯ = −1 and when xj = xmx , x ¯ = 1, and therefore −1 ≤ x ¯j ≤ 1. The matrix T should then be constructed using x ¯j . In this case, we need to use the same variable transformation when we evaluate the resulting Chebyshev form of the interpolating polynomial. For this reason, we write a function (such as spline and pchip) that can be used to construct and evaluate the interpolating polynomial. The basic steps of our function can be outlined as follows: • The input should be three vectors, x data = vector containing given data, xj . f data = vector containing given data, fj . x = vector containing points at which the polynomial is to be evaluated. Note that the values in this vector should be contained in the interval [xmn , xmx ]. • Perform a variable transformation on the entries in x data to obtain x ¯j , −1 ≤ x ¯j ≤ 1, and define a new vector containing the transformed data: @ A ¯0 ; x ¯1 ; · · · x ¯N x data = x • Let n = length(x data) = N + 1.
• Construct the n × n matrix, T , which can be computed one column at a time using recurrence relation for generating the Chebyshev polynomials and the (transformed) vector x data: 1st column of T = T(:,1) = ones(n,1) 2nd column of T = T(:,2) = x_data and for j = 3, 4, . . . , n, jth column of T = T(:, j) = 2*x_data .* T(:,j-1) - T(:,j-2) • Compute the coefficients using Matlab’s backslash operator: b = T \ f_data • Perform the variable transformation of the entries in the vector x. • Evaluate the polynomial at the transformed points. Putting these steps together, we obtain the following function:
4.5. MATLAB NOTES
123
function y = chebfit(x_data, f_data, x) % % y = chebfit(x_data, f_data, x); % % Construct and evaluate a Chebyshev representation of the % polynomial that interpolates the data points (x_i, f_i): % % p = b(1)*T_0(x) + b(1)*T_1(x) + ... + b(n)T_N(x) % % where n = N+1, and T_j(x) = cos(j*acos(x)) is the jth Chebyshev % polynomial. % n = length(x_data); xmax = max(x_data); xmin = min(x_data); x_data = (2*x_data - xmax - xmin)/(xmax - xmin); T = zeros(n, n); T(:,1) = ones(n,1); T(:,2) = x_data; for j = 3:n T(:,j) = 2*x_data.*T(:,j-1) - T(:,j-2); end b = T \ f_data; x = (2*x - xmax - xmin)/(xmax - xmin); y = zeros(size(x)); for j = 1:n y = y + b(j)*cos( (j-1)*acos(x) ); end
Example 4.5.10. Consider again the average high temperatures from Example 4.5.3. chebfit, for example with the following Matlab commands,
Using
x_data = 1:12; f_data = [54.4 54.6 67.1 78.3 85.3 88.7 96.9 97.6 84.1 80.1 68.8 61.1]; x = linspace(1, 12, 200); y = chebfit(x_data, f_data, x); plot(x_data, f_data, ’o’) hold on plot(x, y) we obtain the plot shown in Fig. 4.19. As with previous examples, we also used the Matlab commands axis, legend, xlabel and ylabel to make the plot look a bit nicer. Because the polynomial that interpolates this data is unique, it should not be surprising that the plot obtained using chebfit looks identical to that obtained using polyfit. (When there is a large amount of data, the plots may differ slightly due to the effects of computational error and the possible difference in conditioning of the linear systems.) Problem 4.5.12. Write a Matlab script m-file that will generate a figure containing the jth Chebyshev polynomials, j = 1, 3, 5, 7. Use subplot to put all plots in one figure, and title to document the various plots.
124
CHAPTER 4. CURVE FITTING 110 Data Chebyshev interpolation 100
temperature, degrees Fahrenheit
90
80
70
60
50
40
30
0
2
4
6
8
10
12
month
Figure 4.19: Interpolating polynomial or average high temperature data given in Example 4.5.3 using the Chebyshev form. Problem 4.5.13. Consider the data (0, 1), (1, 2), (3, 3) and (5, 4). Construct a plot that contains the data (as circles) and the polynomial of degree 3 that interpolates this data using the function chebfit. You should use the axis command to make the plot look sufficiently nice. Problem 4.5.14. Consider the data (1, 1), (3, 1), (4, 1), (5, 1) and (7, 1). Construct a plot that contains the data (as circles) and the polynomial of degree 4 that interpolates this data using the function chebfit You should use the axis command to make the plot look sufficiently nice. Do you believe the curve is a good representation of the data? Problem 4.5.15. Construct plots that contain the data (as circles) and interpolating polynomials, using the function chebfit, for the following sets of data: xi −2 −1 0 1 2
fi 6 3 1 3 6
and
xi −2 −1 0 1 2
fi −5 −3 0 3 5
Problem 4.5.16. Construct interpolating polynomials, using the function chebfit, through all four sets of weather data given in Example 4.5.3. Use subplot to show all four plots in the same figure, and use the title, xlabel and ylabel commands to document the plots. Each plot should show the data points as circles on the corresponding curves.
4.5.4
Least Squares
Using least squares to compute a polynomial that approximately fits given data is very similar to the interpolation problem. Matlab implementations can be developed by mimicking what was done in
125
4.5. MATLAB NOTES
Section 4.5.1, except we replace the interpolation condition p(xi ) = fi with p(xi ) ≈ fi . For example, suppose we want to find a polynomial of degree M that approximates the N + 1 data points (xi , fi ), i = 1, 2, . . . N + 1. If we use the power series form, then we end up with an (N + 1) × (M + 1) linear system V a ≈ f.
The normal equations approach to construct the least squares fit of the data is simply the (M + 1) × (M + 1) linear system V T V a = V T f. Example 4.5.11. Consider the data xi fi
1 2
3 4
4 3
5 1
Suppose we want to find a least squares fit to this data by a conditions p(xi ) ≈ fi we obtain 1 p(x0 ) ≈ f0 ⇒ a0 + a1 ≈ 2 1 p(x1 ) ≈ f1 ⇒ a0 + 3a1 ≈ 4 ⇒ 1 p(x2 ) ≈ f2 ⇒ a0 + 4a1 ≈ 3 1 p(x3 ) ≈ f3 ⇒ a0 + 5a1 ≈ 1
line: p(x) = a0 + a1 x. Then using the 2 1 B C 4 a 3 0 ≈ 3 4 a1 1 5
To find a least squares solution, we solve the normal equations C B C B CB 10 4 23 a0 T T = V V =V f ⇒ 31 13 51 a1
.
Notice that this linear system is equivalent to what was obtained in Example 4.4.1. Matlab’s backslash operator can be used to compute least squares approximations of linear systems V a ≈ f using the simple command a = V \ f In general, when the backslash operator is used, Matlab checks first to see if the matrix is square (number of rows = number of columns). If the matrix is square, it will use Gaussian elimination with partial pivoting by rows to solve V a = f . If the matrix is not square, it will compute a least squares solution, which is equivalent to solving the normal equations. Matlab does not use the normal equations, but instead a more sophisticated approach based on a QR decomposition of the rectangular matrix V . The details are beyond the scope of this book, but the important point is that methods used for polynomial interpolation can be used to construct polynomial least squares fit to data. Thus, the main built-in Matlab functions for polynomial least squares data fitting are polyfit and polyval. In particular, we can construct the coefficients of the polynomial using a = polyfit(x_data, f_data, M) where M is the degree of the polynomial. In the case of interpolation, M = N = length(x data)-1, but in least squares, M is generally less than N. Example 4.5.12. Consider the data xi fi
1 2
3 4
4 3
5 1
To find a least squares fit of this data by a line (i.e., polynomial of degree M = 1), we use the Matlab commands:
126
CHAPTER 4. CURVE FITTING x_data = [1 3 4 5]; f_data = [2 4 3 1]; a = polyfit(x_data, f_data, 1);
As with interpolating polynomials, we can use polyfit to evaluate the polynomial, and plot to generate a figure: x = linspace(1, 5, 200); y = polyval(a, x); plot(x_data, f_data, ’o’); hold on plot(x, y) If we wanted to construct a least squares fit of the data by a quadratic polynomial, we simply replace the polyfit statement with: a = polyfit(x_data, f_data, 2); Fig. 4.20 shows the data, and the linear and quadratic polynomial least squares fits. 6 Data LS line LS quadratic 5
4
3
2
1
0
0
1
2
3
4
5
6
Figure 4.20: Linear and quadratic polynomial least squares fit of data given in Example 4.5.12 Note that it is possible to modify chebfit so that it can compute a least squares fit of the data; see Problem 4.5.17. It may be the case that functions other than polynomials are more appropriate to use in data fitting applications. The next two examples illustrate how to use least squares to fit data to more general functions. Example 4.5.13. Suppose it is known that data collected from an experiment, (xi , fi ), can be represented well by a sinusoidal function of the form g(x) = a1 + a2 sin(x) + a3 cos(x).
127
4.5. MATLAB NOTES
To find the coefficients, a1 , a2 , a3 , so that g(x) is a least squares fit of the data, we use the criteria g(xi ) ≈ fi . That is, g(x1 ) ≈ f1 g(x2 ) ≈ f2 g(xn ) ≈ fn
⇒ a1 + a2 sin(x1 ) + a3 cos(x1 ) ≈ f1 ⇒ a1 + a2 sin(x2 ) + a3 cos(x2 ) ≈ f2 .. .
⇒ a1 + a2 sin(xn ) + a3 cos(xn ) ≈ fn
which can be written in matrix-vector form as 1 sin(x1 ) cos(x1 ) 1 sin(x2 ) cos(x2 ) .. .. .. . . . 1 sin(xn )
cos(xn )
a1 a2 ≈ a 3
f1 f2 .. . fn
.
In Matlab, the least squares solution can then be found using the backslash operator which, assuming more than 3 data points, uses a QR decomposition of the matrix. A Matlab function to compute the coefficients could be written as follows: function a = sinfit(x_data, f_data) % % a = sinfit(x_data, f_data); % % Given a set of data, (x_i, f_i), this function computes the % coefficients of % g(x) = a(1) + a(2)*sin(x) + a(3)*cos(x) % that best fits the data using least squares. % n = length(x_data); W = [ones(n, 1), sin(x_data), cos(x_data)]; a = W \ f_data;
Example 4.5.14. Suppose it is known that data collected from an experiment, (xi , fi ), can be represented well by an exponential function of the form g(x) = a1 ea2 x . To find the coefficients, a1 , a2 , so that g(x) is a least squares fit of the data, we use the criteria g(xi ) ≈ fi . The difficulty in this problem is that g(x) is not linear in its coefficients. But we can use logarithms, and their properties, to rewrite the problem as follows: g(x) = a1 ea2 x ln(g(x)) = ln (a1 ea2 x ) = ln(a1 ) + a2 x = a ˆ1 + a2 x, where a ˆ1 = ln(a1 ), or a1 = eaˆ1 . With this transformation, we would like ln(g(xi )) ≈ ln(fi ), or ln(g(x1 )) ≈ ln(f1 ) ln(g(x2 )) ≈ ln(f2 )
⇒ a ˆ1 + a2 x1 ≈ ln(f1 ) ⇒ a ˆ1 + a2 x2 ≈ ln(f2 ) .. .
ln(g(xn )) ≈ ln(fn ) ⇒ a ˆ1 + a2 xn ≈ ln(fn )
128
CHAPTER 4. CURVE FITTING
which can be written in matrix-vector form as 1 x1 ln(f1 ) B C 1 x2 ln(f2 ) ˆ1 a ≈ .. . .. a .. . 2 . . 1 xn ln(fn )
In Matlab, the least squares solution can then be found using the backslash operator. A Matlab function to compute the coefficients could be written as follows: function a = expfit(x_data, f_data) % % a = expfit(x_data, f_data); % % Given a set of data, (x_i, f_i), this function computes the % coefficients of % g(x) = a(1)*exp(a(2)*x) % that best fits the data using least squares. % n = length(x_data); W = [ones(n, 1), x_data]; a = W \ log(f_data); a(1) = exp(a(1)); Here we use the built-in Matlab functions log and exp to compute the natural logarithm and the natural exponential, respectively.
Problem 4.5.17. Modify the function chebfit so that it computes a least squares fit to the data. The modified function should have an additional input value specifying the degree of the polynomial. Use the data in Example 4.5.12 to test your function. In particular, produce a plot similar to the one given in Fig. 4.20.