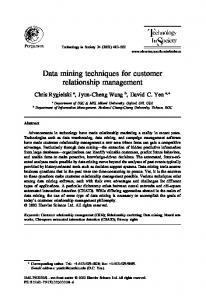
Keywords: Customer retention, feature selection, deviation analysis, multiple level association ... tools as the catalyst for the success of data mining applications. After ...... sales and services related industries, like Telecommunications, Internet.
Customer Retention via Data Mining KianSing Ng and Huan Liu (fngkians1,
g
liuh @comp.nus.edu.sg)
School of Computing, National University of Singapore, 119260
Abstract. \Customer Retention" is an increasingly pressing issue in today's evercompetitive commercial arena. This is especially relevant and important for sales and services related industries. Motivated by a real-world problem faced by a large company, we proposed a solution that integrates the various techniques of data mining, such as feature selection via induction, deviation analysis, and mining multiple concept-level association rules to form an intuitive and novel approach to gauging customer loyalty and predicting their likelihood of defection. Immediate action triggered by these \early-warnings" resulted from data mining is often the key to eventual customer retention. Keywords: Customer retention, feature selection, deviation analysis, multiple level association rules, data mining
1. Introduction In the last decade, the increased dependency and widespread use of databases in almost every business, scienti c and government organization has led to an explosive growth of data. Instead of being blessed with more information to aid decision making, the overwhelming amounts of data have inevitably resulted in the problem of \information overloading" but \knowledge starvation", as the human analysts are unable to keep pace to digest the data and turn it into useful knowledge for application purposes. This situation has motivated some scientists and researchers in the elds of arti cial intelligence, machine learning, statistics and databases to put their expertise together to form the eld of knowledge discovery in databases (KDD). KDD seeks to intelligently analyze voluminous amount of information in databases and extract previously unknown and useful knowledge (nuggets) from them (Fayyad et al., 1996). Active research in these elds has produced a wide range of effective knowledge discovery techniques like ID3 (Quinlan, 1986) for classi cation (used in C4.5 (Quinlan, 1993)) and Apriori (Agrawal and Srikant, 1994) for association rule mining (used in DBMiner (Kamber et al., 1997)), to cater to various applications in data mining. This tremendous success achieved in the research domain has also spun o� a wide repertoire of high-quality, o�-the-shelf commercial data mining software/tools, like C5.0 by RuleQuest, MineSet by Silicon Graphics and Intelligent Miner by IBM, to name a few. Many people saw these
c 1999 Kluwer Academic Publishers.
Printed in the Netherlands.
p1.tex; 30/07/1999; 10:19; p.1
2 tools as the catalyst for the success of data mining applications. After all, many organizations are facing problems coping with overwhelming amounts of data in their databases and are attracted by the potential competitive advantages from data mining applications. The availability of real-world problems and the wealth of data from the organizations' databases provide an excellent test-bed for us to perform practical data mining. Our work was motivated by a real-world problem involving a collaboration with a large company to tackle the pressing issue of \customer retention". Such collaborations between academia and application domains to solve real-world problems represent a positive step towards the success of data mining applications. The proposed approach showcases an e�ective application of data mining in the sales and services related industries, and reveals the complex and intertwined process of practical data mining. More importantly, we demonstrate that real-world data mining is an art of combining careful study of the domain, intelligent analysis of the problems, and skillful use of various tools from machine learning, statistics, and databases. One truth about data mining applications is that even when the problem or goal is clear and focused, the mining process still remains a complicated one, involving multiple tasks across multiple stages. In our application, although we are clear that we want to retain customers and the goal is to \identify the potential defectors way before they actually defect", it is still di�cult to know where to start. Without studying the domain, it is impossible for us to go further. The problem and goal statement speci ed gave no clue to \what" tasks of data mining are involved, \which" techniques are to be applied, and \how" they are applied. Obviously, the problem of customer retention must be further decomposed into several sub-problems such that the knowledge derived from a task in one phase can serve as the input to the next phase. Since the available data mining techniques and tools are designed to be taskspeci c (according to the framework given in Figure 1) rather than problem-speci c, they cannot be applied directly to solve real-world problems. Many challenges can only be found in real-world applications. The changing environment can cause the data to uctuate and make the previously discovered patterns partially invalid. Such phenomenon is termed as \concept drift" (Widmer, 1996). The possible solutions include incremental methods for updating the patterns and treating such drifts as an opportunity for \interesting" discovery by using it to cue the search for patterns of change (Matheus et al., 1994). In practice, we often nd many organizations collecting data as a by-product of a business process. Hence, large databases with hundreds of tables, millions of records and multi-gigabytes size are quite commonplace
p1.tex; 30/07/1999; 10:19; p.2
3 MPS = Multi-Purpose System Category / Task Asc =
Association
Cls = Classification
Cst = Clustering
Dev =
Sta =
Deviation
Statistical
Analysis
Analysis
Sum = Summarization
Tree
Vis = Visualization
Type
Approach
Dt = Decision
Pre = Preprocessing
Nn = Neural
Rd = Rule
Network
Discovery
Framework for Data Mining Tools, Methods and Techniques
Fd = Feature
Fs = Feature
Fe = Feature
Discretization
Selection
Extraction
Figure 1. A framework for classi cation of data mining tools (by tasks).
in many application domains. In our case, the company's databases typically logged in more than 45,000 transactions per day. In a few months, this database alone can easily aggregate to a few gigabytes of data without even including the many other operational databases. To aggravate the matter, most of the databases are of high dimensionality - with a very large number of elds (attributes). This results in an exponential increase in size of search space, and hence intolerably long computational time will be required for running any machine learning algorithms. To resolve these problems, we need to pre-process the data set to reduce the dimensionality of the problem. Another practical issue is that concepts can have various levels of abstraction or taxonomies. For this reason, knowledge or patterns have various characteristics. However, most transactional and operational databases are usually described in terms of low-level concepts and relations, like \freight car companies". This is cognitively distant from the high-level business concepts that are required for decision making, like \loyalcustomers". Since the generality of knowledge is needed to determine its \interestingness" and applicability in practical problems, some forms of generalization (and specialization) must be catered for. Our work here will focus mainly on those challenges of the immediate need for customer retention. Obviously, there are also many other challenges for practical data mining applications (Fayyad et al., 1996). They include challenges like \understandability of patterns", \complex relationships between elds", \missing and noisy data", \data over- tting", so on and so forth. Another point that cannot be stressed enough is that a data mining application requires substantial much know-how, skills and experiences from the user. This is often not fully understood by many, thus leading to failures in data mining applications. This work illustrates the kind of complexity involved in solving real-world problems and further justi es that practical data mining is an art that requires more than just directly
p1.tex; 30/07/1999; 10:19; p.3
4 applying the o�-the-shelf techniques and tools. The remainder of the work is organized as follows. In Section 2, we begin with a domain analysis and task discovery of the customer retention problem faced by the company. We then perform a top-down problem decomposition and list various sub-problems. This is important because each subproblem must map to only one speci c task of data mining, so that the existing data mining tools and techniques can e�ectively be applied. In Section 3, we illustrate the use of feature selection via induction to choose the objective \indicators" (or salient features) about customer loyalty. With this technique, \concept-drifts" - the de nition of a concept change over time (Clearwater et al., 1989) can be captured as they take place. This is followed by the use of deviation analysis and forecasting to monitor these indicators for the potentially defecting customers in Section 4. Next, in Section 5, we elaborate on the employment of multiple-level association rule mining in predicting customers who are likely to follow the previously identi ed defecting customers and leave the company. These \early-warnings" of the possible chain-e�ect will enable the marketing division to take recti cation actions or tailor special packages to retain important customers and their potential followers before the defection takes place. Finally, Section 6 concludes the work and suggests some implications of this project. Because of the con dentiality of the databases used and the sensitivity of services provided by the company, we deliberately use \the company" throughout the paper and describe applications through some intuitive examples as much as possible. In explaining basic concepts, we use the \credit" database from the UC Irvine Machine Learning Repository (Merz and Murphy, 1996) for illustrative purpose.
2. Understanding the Domain and Problems The nature of the company is of service providing. Because of the con dentiality and sensitivity of the company, details shall be left out. However, in order for the readers to understand the working of the techniques used in this data mining application, we use an imaginative example of international telephone satellite relaying services to explain the problems and techniques. The scenario is as follows: there are some major satellite relaying centers for major regions around the world, and each center has its network; companies doing international business usually need services from three centers in order to communicate to any business partner in the world. In other words, three parties are involved, the sender, the company, and the receiver. The sender and
p1.tex; 30/07/1999; 10:19; p.4
5 the receiver are usually determined by the need of the business. But they can choose the company over others or vice versa as di�erent relayers provide varying services and charges with contracts of various periods. Companies (senders and receivers) can form consortiums or groups to enjoy discounts of various sorts o�ered by the company. This work is, in essence, how a relayer can keep the most customers to use its relaying services. The goal of customer retention is to retain customers before they switch to other relayers. Like many organizations, the dependency on information technology has inevitably resulted in an explosive growth of data, far beyond the human analyst's ability to understand and make use of the data for competitive advantages. This is also due to the fact that conventional databases and spreadsheets used by these analysts are not designed for identifying patterns from the databases. Neither do they possess the capability to select nor consolidate the di�erent sources of information from a large number of multiple databases of heterogeneous sources. In view of these inadequacies, the company involved sees \data warehousing" and \data mining" as two intuitive solutions. Maintaining a data warehouse separately from the transactional database allows special organization, access methods and implementation methods to support multi-dimensional views and operations typical of OLAP. In fact, some OLAP tool can be integrated to the data warehouse to support complex OLAP queries involving multi-dimensional data representation, visualization and interactive viewing, while not degrading the performance of the operational databases. 2.1. Problem identification and analysis The rst step in our analysis involves identifying opportunities for data mining applications. This step is important because not every problem can be solved by data mining. Some guidelines for selecting a potential data mining application include \the potential for signi cant impact", \availability of su�cient data with low noise level", \relevance of attributes", and \presence of domain knowledge". In fact, nearly one fth of the whole development time was spent on identifying the \right" problems for application, as well as justifying the use of data mining over the conventional approaches. The possibility that an application can be generalized into solving other similar problems in related industries is also taken into consideration. With these factors in mind, our feasibility study has identi ed the problems of customer retention for data mining application. The motivation of our work comes from the fact that the problem of customer retention is becoming an increasingly pressing issue for or-
p1.tex; 30/07/1999; 10:19; p.5
6 ganizations in the sales (e.g., departmental stores, banking, insurance, etc.) and services (e.g., providers of Internet and/or Telecommunications services) related industries. From an economic point of view, customer retention directly translates to a huge saving in marketing costs, as highlighted by Coopers & Lybrand 's Vince Bowey : \A
lot of companies have not figured out what it costs them to acquire a new customer, it's usually pretty shocking. We estimate that it costs three to five times more money to acquire a new customer than to keep the ones you have."
This problem is especially important for organizations that have a small customer base where each customer represents a group of a large number of companies. The defection of any single customer means a signi cant percentage loss in the revenue of the company. Naturally, the company has a strong interest to retain each and every one of them. This is especially important when the company is facing keen competition from many upcoming relayers in the neighboring countries. The increased competitiveness means that the marketing division is facing higher risk of customer defection, which potentially escalates marketing costs due to defections. Furthermore, the relaying activities are an entrepot in nature, i.e., an intermediary center for call transfer and repackaging for conference call. Hence, the defection of a customer to another relayer is likely to in uence its associated business alliances to also defect, in order to maintain their already established business relationship. Thus, the possibility of a \snow-ball e�ect" from a defection further gives rise to a pressing need for an e�ective method to identify the less obvious associations between customers for the bene t of marketing and customer retention. Finally, contrary to a popular belief, focusing on retaining customers is not a passive policy. This is because existing customers can, and often do, bring in new customers through their business associations and expansion, as well as through word of mouth. Despite the importance of the \customer retention" problem, many organizations simply cannot do anything about it, since their customers are free to leave without warning when they are dissatis ed with the services or if better o�ers come by. Fortunately, this is not the case in this relaying business. By o�ering attractive discount and rebate schemes to the customers, especially the major senders (consortiums, or groups), the company can usually at least secure them under some short-term contractual agreements. This means that potential defectors cannot just pull out abruptly. Moreover, most customers are usually
p1.tex; 30/07/1999; 10:19; p.6
7 \committed" by the sheer size of their regular relaying transactions through the company, which must be pre-scheduled some time (e.g., weeks or months) in advance. Hence, potential defectors will have to take a couple of months to gradually trim-out their outgoing volumes in relaying business before their eventual withdrawal. This gradual pulling out process o�ers the company the opportunity to identify the signals of defection and to predict the possible chain-e�ect with each defection. \Early warnings" like these can give the marketing department ample lead-time to investigate the causes and take recti cation actions before defections actually take place. As was described in (Matheus et al., 1994), the \interestingness" of a deviation can be related to the estimated bene t achievable through available actions. In the course of our work, it was observed that managers and executives have rarely realized that the very knowledge that can help them alleviate these problems lies no further than within the wealth of data already at their disposal. In the context of our application, the company logs in every call, its duration, the length of the relay, and other information into various databases daily. This wealth of information, which has so often been underestimated and under-utilized, can be invaluable for our data mining applications. 2.2. Task identification: Customer retention In this application, the goal is focused and clear. We are concerned about \customer defection" and the goal is to \identify the potentially defecting customers so that steps can be taken to retain them before they actually defect". At rst glimpse, it is di�cult to start. The key to nding a solution is to iteratively decompose it into some solvable sub-problems. The problem analysis and task decomposition for our application is brie y summarized in Figure 2. As we can see in the gure, the main problem of customer retention is decomposed into three sub-problems or sub-goals. In the rst subproblem, we need to identify a list of \objective indicators" that are representative of customer pro les. The task is to select pertinent indicators from many possible ones. We need to employ a reliable method that can select good indicators from data sets sampled from various databases. The selection of indicators is recast into a problem of feature selection for classi cation (Liu and Motoda, 1998). A list of relevant attributes is identi ed if they are in uential to the classi cation of customer loyalty and their likelihood for defection. As predictive accuracy is the main concern here, a wrapper model of feature selection is adopted (John et al., 1994). The updating of \objective indicators" means to run an induction algorithm on the data sets. Thereafter,
p1.tex; 30/07/1999; 10:19; p.7
8 Problem/Goal Application
Sub-problems/ Sub-goals of Application
Problem Decomposition
Identify objective indicators of customer’s loyalty List of objective indicator
Indica tors
Discover defecting customers List of defecting customer
Task/goals of Data mining
Decision tree induction for classification
Deviation analysis
Databases (sources)
Relaying performance
Financial Performance
Customer retention in a relaying business
defect’g cust
Discover possible chain-effects
Solution
Assoc’g cust
Take rectifying steps
List of associated customer
Mining of multiple level association rules
Message transactions
Figure 2. Task identi cation for \customer retention" in the relaying business.
we can capture concept drifts by frequently updating these objective indicators. The list of objective indicators is then served as the input to the next sub-problem - identifying the list of potential defectors. This is achieved by using deviation analysis to measure the actual performance of a customer with those forecasted from their historical data sets for each of the objective indicators. The work of customer retention seems completed at this stage. However, we pursue further. For each potential defector discovered in the second phase, we look for their associated business partners who are likely to follow suit in order to maintain their established relaying business. Such predictions can be obtained through the mining of multiplelevel association rules from the organization and association databases. If they can be convinced to stay with the company, the potential defectors may have to stay. In general, our work illustrates how the study and decomposition of customer retention and the integration of various techniques of data mining can give rise to an e�ective solution to a complicated real-world problem. The details of our implementation will be discussed in the following.
3. Identifying Concept Drifts The key to solving the problem of customer retention is to identify the list of \potential defectors" and predict the consequences following each potential defection even before they actually take place. Intuitively, this
p1.tex; 30/07/1999; 10:19; p.8
9 gives rise to the need for us to rst identify a set of relevant attributes or \indicators" that are representative for the target concept of \customer loyalty and their likelihood of defection". The knowledge found can then be cross-validated against the existing knowledge, and employed to capture concept drifts. 3.1. The conventional approach Because of the clear importance of this task, most organizations have had to rely on the judgments of their human experts to devise a set of \subjective indicators". This has several shortcomings. To begin with, the human's analytical and pattern recognition abilities are extremely weak in identifying factors that are relevant to the classi cation outcomes. Therefore, the set of subjective indicators speci ed by the human experts will often involve uncertainty or incompleteness to some extent. Nevertheless, the list of subjective indicators is still important, because it can help us determine which of the many databases contain important attributes and should be used. Secondly, in the context of a dynamic environment over a period of time, the set of indicators becomes susceptible to concept drifts. Human experts may not be able to detect such subtle changes, especially if they have taken place gradually. Because of such dynamism, a business may be at risk of monitoring the outdated and irrelevant indicators, or of missing important indicators. There are other issues as well. For instance, the comprehensive logging of daily operations in the company has caused the dimensionality of databases to be very high (ranging from dozens to hundreds of attributes), although many of the attributes are irrelevant or redundant to the target concept. Usually, the raw data sets are too large for the user to monitor e�ectively and e�ciently. Hence, it is necessary for us to rst identify a set of relevant indicators. This is a problem of feature selection (Blum and Langley, 1997). A comprehensive survey of various methods can be found in (Dash and Liu, 1997). Since our problem requires the set of objective indicators to be highly accurate, C4.5 (Quinlan, 1993) - a decision tree induction (Quinlan, 1986) method for classi cation was chosen due to its proven good performance. The underlying idea is that attributes used in a decision tree that gives high accuracy are relevant and meaningful indicators. 3.2. Decision tree induction for classification Classi cation is one of the most important and frequently seen tasks in data mining: given a large set of training data of the form fA1 ; A2; :::; An; C g, its objective is to learn an accurate model of how attribute-values (A0i s) can determine class-labels C . \Decision trees" is one possible
p1.tex; 30/07/1999; 10:19; p.9
10 model (Quinlan, 1986) from which a set of disjunctive if-then classi cation rules can be derived. Classi cation rules having high predictive accuracy (or con dence) are employed for various tasks. Firstly, the model can be used to perform classi cation for future data having unknown class outcome - prediction. For example, a bank manager can check a future application against the classi cation model obtained from historical data to determine whether this applicantion should be granted a credit - a screening process. Secondly, since those attributes appeared in the classi cation rules are in uential to the eventual outcome of the classi cation, the user can have a better understanding and insight into the characteristics for each target class. This is especially useful in some real-world applications where the users seek to achieve speci c classi cation outcome. 3.3. Using decision tree induction to identify objective indicators
Our actual data, sampled from the transactional databases residing in Oracle, has more than 40 attributes and 60,000 periodical records. Because of its con dentiality, we choose the \credit" data to illustrate the idea of classi cation using decision trees. The data is parially shown in Table I. The last column shows the class values. C4.5 is applied to the data to derive the updated classi cation rules about customers of the following form: If (Jobless = \No") \ (Bought = \jewel") \ (Saving > 20) ! Granted = \Y es" [90%]: The attributes that appear in the classi cation rules are objective indicators as they are found in the data and considered in uential to the target concept \Granted". For instance, from the above classi cation rule, the user can conclude that attributes \Jobless", \Bought" and \Saving" are in uential and relevant to the target class of \Granted", while othere attributes such as \Married", \Age", \Sex" are not. Table I. Training data set for classi cation in credit-screening Id Jobless Bought Sex 1 2 ... 125
... Age Savings Granted
No car Yes jewel
male ... female ...
38 26
$150K $60K
Yes Yes
Yes stereo
male
20
$10K
No
...
p1.tex; 30/07/1999; 10:19; p.10
11 Periodical applications of this method allow the Marketing Department to objectively identify the most recent set of in uencing indicators in order to capture possibile concept drifts. The set of objective indicators are then compared with the set of subjective indicators identi ed by the domain experts. As a result of the cross-validation process, the eventual set of merged indicators is more updated and reliable for gauging the loyalty of customers and their likelihood of defecting. Monitors are then placed on these \loyalty-indicators" in the data warehouse so that if any customer shows signi ciant deviations beyond a certain minimum deviation threshold �Min , an exception report of defection will be triggered o�. This is described in the next section.
4. Predicting the Potential Defectors Having identi ed objective indicators, we now need to identify those customers who show signs of defecting according to these indicators and then predict the potentially defecting customers. This is possible because the customers' contractual agreements with the company and their sheer size of relaying commitments established through the company e�ectively prolong a defecting process. 4.1. The conventional approach An intuitive way of identifying the potential defectors is to monitor performances of customers over periods. Similarly, a marketing analyst in the company will prepare a periodic (for example, weekly, monthly, or yearly) report showing the percentage change of every major customer's relaying volumes in the previous period to that of the previous month and year. By doing so, the gauge of the loyalty of a customer (sender or receiver) is tagged to the relative volume change of the customers. Sometimes, this method does manage to identify potential defectors who pull out abruptly. However, in most cases, such simplistic analysis can be improved. The aw is mainly that the comparisons made on the volume performances should normally be relative. Even when a sender is maintaining a steady volume with the company, it could still be defecting. For example, say sender S1 is a fast-growing company who decides to change to another new relayer. Hence, S1 diverts its increased volume into the new relayer, while maintaining its existing volumes with the company. When it has eventually re-established its relaying business over at the new relayer, it will pull out completely and suddenly. Another situation involves an economy boom where all the senders in the Asia Service-
p1.tex; 30/07/1999; 10:19; p.11
12 Route are increasing at a rate of 10%, a particular sender in the same route having no increase in volume should become suspicious. Besides, such comparison has overly relied on the volume performance for indication of defection. In fact, there are many other indicators that can also re ect the customer's loyalty, depending on applications. The use of multiple indicators can produce more interesting ndings. In fact, the quality and performance of the calls that are despatched to receivers, as re ected in some of the attributes of the Relaying Performance database, can also re ect the loyalty of customers. There are still many other issues such as the seasonality observed in the relaying business, incorporation of the trends in the external environments, and the pro les of the subject under study. Solving such complicated issues requires some predictive modeling methods that can extrapolate the future performance from the historic performances with referencing norms. From these de ned norms, signi cant changes can then be derived. Our approach further compares the magnitude of every deviation to that of the other subjects having similar pro les. Only then can we ascertain whether the deviation actually means a defection. We use a trend-seasonal forecasting model to predict future performance for every customer, based on past performance in the various performance databases. With the predicted norms to serve as the references, we can then employ deviation analysis (Piatetsky-Shapiro and Matheus, 1994) to identify \trimming patterns" among the customers. Without these predictions and analysis, human analysts can barely observe any phenomenon of gradual deviations at the initial stage of defection. 4.2. Deviation analysis Deviation analysis is the discovery of signi cant changes or deviations of some pre-de ned measures from its normative value over a time period in a data set (Piatetsky-Shapiro and Matheus, 1994). In most applications, the measured normative value is expressed as the expected value (expectation Et) of some time-series, or as a forecasted value calculated from applying some mathematical models like the \seasonal model" that describes the series. In our work, a deviation �t for time t is given by: �t
=
A ?Et ) Et
( t
where At is the Actual value for the indicator, and Et is the Expected value for the indicator and obtained over a time period from the timeseries.
p1.tex; 30/07/1999; 10:19; p.12
13 If the analysis detects any deviation �t exceeding a certain userspeci ed \minimum deviation threshold �Min ", i.e., �t > �Min in some pre-de ned measures in the temporal database, it suggests that a signi cant deviation has occurred. Some exception reports are generated. Since signi cant deviations from the norms are unexpected, they should be \interesting" to the user. Such statistical analysis method is widely employed in data mining to discover a few really important and relevant deviations among a multitude of potentially interesting changes in the temporal databases. Without such a method, most of the changes are normally \drowned out" by the mass of data (Matheus et al., 1994) and will remain unnoticed. Even if human analysts were able to detect the more abrupt pattern changes in the time-series, it would be extremely di�cult to monitor such a large number of deviations over a long period of time. Nevertheless, nding these patterns is interesting in discovering higherlevel relationships. 4.3. Forecasting The measured normative value Et of a time-series is often calculated by applying some mathematical models. This section will brie y introduce the concept of time-series forecasting. Forecasting is an area of predictive modelling that involves the building of an appropriate mathematical model from the historical data, followed by applying the model to forecasting future measures. Most management decisions today depend on information from forecasting. This is especially important for big organizations. Given the large number of time-series to be forecasted periodically, computer-based quantitative modelling is the only realistic alternative.
Developing a Trend-Seasonal Forecasting Model
In general, there are two common classes of forecasting models used in Management Science. They are time-series models and causal models. In the former, a series of future \performances" are predicted based on a period of historical behaviours, whereas in the latter, it is predicted based on other known and quanti able factors that will a�ect \performances". In our work, we adopt the former because of the wealth of available historical data in databases, which can serve as the basis for the training and adjustment of the model. The causal model has many complications and di�culties that are still under research. The particular forecasting model adopted here is a type of multiplicative trend-seasonal model. A multiplicative seasonal model means that the expected measure in any season/month t within a year is given by A � St, where A is the base value of current estimate and St is the sea-
p1.tex; 30/07/1999; 10:19; p.13
14 sonal index for period t. A seasonal index de nes the ratio of the actual value of the time series (week, month, or quarter) to the average for the year. Hence, a value for St above 1 means that the expected measure in that period exceeds the base value A, and vice versa. A seasonal model is adopted because the performance of a relaying business (e.g., the import and export volumes) follows a de nite pattern that repeats itself cyclically over years. For example, peak volumes are always expected before the seasons of Christmas and New Year. In addition, since the relaying business also exhibits a constant but steady growth of business volumes and customers over years, a trend component is incorporated into the multiplicative seasonal model. Combining these components into a single model, we have a multiplicative trend-seasonal model, which is used to predict the various measures. The model can generally be stated by the expected deseasonalized forecast for the period (t-1) + B with seasonal adjustment:
Ft = [(A + B � (t ? 1)) + B] � St where Ft : Forecast for month t in [1..12], A : Base value of the current estimate, B : Slope (gradient) of the trend line, and St : Seasonality Indices for month t.
To forecast, the user should specify three types of data sets: the warm-up data, training data, and forecast data. First, the warm-up data set, which comprises a selected range of historical data, is used to compute the initial estimates of base value A, slope of the trend line B and seasonality indices St for each t month. This provides the initial unadjusted forecasting model. Next, the training data set is selected from the next period of data that is not used in the warm-up data set. This step uses current estimates of A, slope of the trend line B , and seasonality indices St to extrapolate the forecasted measures Ft . The di�erence between the computed forecast Ft and the actual measures is then used to adjust the estimates of A, B and the seasonality constants of St based on \exponential smoothing" (to be discussed next). This step is crucial as it adjusts the above three factors in the forecasting model proportionally according to the uctuations observed in the actual measures from the predicted forecast measures. Last, a range of future periods after the training data are selected to form the forecast data set. The predicted measures in these periods are extrapolated using trained base-value A, slope-value B , and seasonal indices St .
Exponential Smoothing
The method of exponential smoothing works like an auto-pilot in which it is designed to continuously use the forecast error in one period to correct and improve the forecast of the next period. On the basis of comparing the forecast Ft with the actual measure in that period, the
p1.tex; 30/07/1999; 10:19; p.14
15 adjustment method can compute new estimates for base At , slope of the trend line Bt and seasonality indices St by adjusting three smoothing constants { �, , and respectively. In the following example, we will only make use of the base value A and its smoothing constant � for illustration. From the historical data, we obtain an estimate of A = 10; 000 which is then used as the forecast for the actual outcome in 1995. Due to an economy boom in 1995, the actual performance is 11,000. Thus, we had a forecast error of 11,000 - 10,000 = 1,000. Considering any random uctuation, we adjust the estimate of A for the 1996 forecast by the fraction of the forecast error that we attribute to the actual shift in the value of A. We can specify this fraction (in the range 0 to 1) in the form of a smoothing constant. For instance, if � is set to 0.1, we are actually attributing 10% of the current forecast error to an actual shift in the value of A and 90% to randomness. In general, the closer the smoothing constant is to 1, the larger the fraction of the forecast error we are attributing to an actual shift. Usually, these smoothing constants are left to the control of the end-user in a dynamic environment, although empirical experiments have shown that a value between 0.10 and 0.30 for all the smoothing constants often results in reliable forecasts. However, if the user expects the level of the estimate to change permanently in the immediate future because of some special circumstances, then a larger value of a smoothing constant (like 0.7) should be used for a short period of time. Once the computed level of the forecasting model has changed in accordance with these special circumstances, the user should then switch back to a smaller value of smoothing constant. 4.4. Using deviation analysis and forecasting to discover potentially defecting customers
In our implementation, the normative values Et for each of the ve to seven \indicators" are rst developed through a trend-seasonal forecasting model (Levin et al., 1992), based on the customer's historical performance in the temporal databases. With an annual size of more than 50,000 records available for each indicator to train the forecasting model, accuracy of the predicted normative values can be increased. This should also be credited to additional factors taken into consideration in our approach:
? the use of seasonal indexes adjusts the forecast according to the annual seasonal pattern in the time-series, and
p1.tex; 30/07/1999; 10:19; p.15
16
? the use of exponential smoothing allows more weights to be as-
signed to the recent data, thus taking into account the current circumstances, like a recent economy downturn in South-East Asia. With the normative values of every indicator forecasted for every customer, deviation analysis is performed to detect those customers who show signi cant deviations, or �t > �Min . These customers are deemed to be potentially defecting and this warrants a further \interestingness validation" (Matheus et al., 1994). In other words, their deviations are further compared with those �SR of the (aggregated) customers operating in the same Service-Route. By doing so, we take into account the trends in the external environment and pro les of the subject under consideration. This will ensure that a \real" deviation is exclusive only to the speci c subject and not some general phenomenon experienced by other subjects too in the same Service-Route. For example, the Asian boom in the mid of last decade had generally boosted the volumes of those in the Asia Service-Route. Similiarly, the recent Asia economy crisis also causes an overall reduction in the volumes of those senders and receivers in the Asia Service-Route. An illustration of one such analysis is shown in Figure 3.
Query for deviation Select distinct Sender
Result of deviation analysis
c.f. From Indicator I1 S1 (-11%) c.f. Where �Min � -10% S4 (-11%) c.f. And Date = \Jan" C2 (-15%) c.f. Sender
ServiceRoute Interest'g SR1 (+01%) Yes SR5 (-10%) No SR3 (-01%) Yes
Figure 3. An illustration of deviation analysis: (left) - A SQL-like query interface for \monitor" setting. (right) - An \interestingness" evaluation of the deviation analysis.
In the analysis, senders S1; S4 and consortium C2 showed signi cant deviations �1 which satis ed the �Min of -10%. These are further compared with the average deviation �SR of the aggregated customers in their respective Service-Routes. In S1 's case, the general population in SR1 performs reasonably well (a positive deviation +1%), suggesting that S1 's deviation is unexpected and thus interesting. In S4's case, the general population in SR5 performs equally badly (a deviation of -10%), suggesting that S4's deviation should be expected and thus not interesting. As mentioned above, we can usually relate S4 's kind of deviation to some regional events like the current economy turmoil in Asia that a�ects all the relaying operations in the Asia's Service-Routes.
p1.tex; 30/07/1999; 10:19; p.16
17 If no such explanation can be found, then it would mean that all the customers in the Service-Route are declining. If consistent deviations are also observed across the set of indicators for \deviating" customers like S1 and C2 , then a periodic exception report is produced to alert the domain experts on these possible \defectors". Domain knowledge and insights are then applied to verify the ndings for each of these cases and the suspected potential defectors will be monitored closely for the subsequent periods. Persistent deviations are strong signs of likely defection. Besides performing deviation analysis on the Customer concept, similar analysis can also be applied to investigate and identify upcoming or weakening Markets (continents and countries) and Service-Routes for the purpose of marketing.
5. Avoiding the Chain-E�ect Many organizations would be content if they can predict the potentially defecting customers. Nevertheless, this work takes one step further. We ask who else will likely follow suit for each of the potential defectors. Such association knowledge is especially important to a relaying business. This is because the choice of a particular relayer linking di�erent senders and receivers via di�erent Service-Routes and Markets is usually dictated by a few major players. Since they carry very large relaying volumes, they have great in uence over the smaller companies. Hence, the defection of a major sender will encourage similar behavior in their associated business partners who will attempt to preserve established relationships. This can in ict a severe dent to the nancial health of a relayer. Hence, there is much incentive for the Marketing Department to have a full picture of the consequences from an identi ed potential defection. If we wait until a \chain-e�ect" becomes observable to the human analysts, it would be too late. In short, a preventive measure should also be taken to take care of the followers when a potential defector is detected as they can also in uence the major players to change their stands. 5.1. The conventional approach The conventional approaches include information exchanges between relayers, senders, and receivers. They o�er only subjective and often unreliable prediction of the association relationships among the customers. From the earlier data analysis, we have identi ed that the Transactions database, having some 120,000 records monthly, contains attributes incoming messages and outgoing messages for every relaying transaction. Table II depicts the design of the Transactions database.
p1.tex; 30/07/1999; 10:19; p.17
18 Table II. A database of Message-Transactions for association rule mining. Date-Time
Msg-Id
970501-1210 AB0012 970501-1230 ... 970601-0115
RX3766 AO9912
In-Msg Sender
M1 M3 M7
Out-Msg Receiver
HongKong Shanghai Frankfurt
M4 M7 M2
Amsterdam Jakarta
.. .. ..
Kuala Lumpur ..
From such transactional records, we can mine for association rules (Agrawal et al., 1993) which represent the transactional relationships between messages, senders and receivers in the notation of an association rule: M1 ! ? [s% support, c% con dence] Although the mining of association rules at the message level will give a good idea of the association relationships between senders and receivers, knowledge of this level does not provide much business value for our application. This is because knowledge at too low a level (overspeci c) will end up looking like the raw data and having little general meaning. Since most concepts in a real-world context involve multiple levels of abstractions, it causes many problems for application. Hierarchical concepts are also present in our application domain. For example, our analysis of concepts Customer and Market reveals some taxonomies as follows: ? fgroups � consortiums � sendersg 2 Customers ? fcontinents � countries � relayersg 2 Market As an example, we will elaborate on the concept of Customer. The taxonomy is shown in Figure 4. A group is an association of consortiums that forms for the purpose of negotiating a better volume rebate/discount or qualifying for a better charging scheme. Most consortiums will therefore form groups with their associated business partners. Hence, a group consists of many consortiums, and each consortium owns several individual senders. With this hierarchy, we can deduce a trivial association rule, which is \a consortium is associated with some other consortiums in the same group." Therefore, the defection of one of them may a�ect their partners in the group. This is because the remaining may fail to reach the minimum volume quota in order to enjoy the rebate or discount. Since the association rules at a low level, say at the sender level, are too speci c to have much
p1.tex; 30/07/1999; 10:19; p.18
19 application value, we mine for generalized association rules (Srikant and Agrawal, 1996), or generate rules that are as general as possible by taking the existing taxonomies into account. A similar approach to nding multiple-level association rules (Han and Fu, 1996) is employed here. S 1.1.3 S 1.1.2 S 1.1.1
C 1.1
S 1.2.3
S 1.3.3
S 1.2.2 S 1.2.1
C 1.2
S 2.1.3
S 1.3.2 S 1.3.1
S 2.2.3
S 2.1.2
Sender Level
C 1.3
S 2.2.2
S 2.3.3 S 2.3.2
S 2.1.1
S 2.2.1
S 2.3.1
C 2.1
C 2.2
C 2.3
Consortium Level
G1
Group Level
G2
Figure 4. A taxonomy of the \Customer " concept in a relaying business.
5.2. Multiple-Level Association Rules Many databases in the real-world are transaction-oriented and do not contain class-label. The most popular example is the supermarket's bar-coded transactional data. Generally, the task of mining association rules over a transactional database can be formally stated as follows: Let I = f i1 ; i2; ::::::; im g be the set of items in the database. Each transaction T in the database D has a unique identi er and contains a set of items called an itemset. An itemset with k items is called a k-itemset. The support of an itemset is the percentage of transactions in D that contain the itemset. An association rule is a conditional implication among itemsets, A ! B , where itemsets A; B � I . The support of the association rule is given as the percentage of the transactions that contain both A and B , and the con dence is given as the conditional probability that a transaction contains B , given that it contains A.
Predicting the followers of a potential defector
The Transactions database contains the transactional associations between senders and receivers with respect to messages. We can derive association rules between vessels, having the following form for a message: Sender1:3:3 ! Receiver2:1:3 [s% support, c% con dence]
p1.tex; 30/07/1999; 10:19; p.19
20 Associations at this level may be too speci c to be of any value to a business. We therefore generalize the associations to higher taxonomy levels, in accordance to the hierarchical taxonomy of Customer (like the one in Figure 4). For example, group G1 includes consortiums C1:1; C1:2, and C1:3, group G2 contains consortiums C2:1; C2:2, and C2:3. Employing the algorithms presented in (Han and Fu, 1996), association rules at the consortium and group level are generated:
? Consortium: C : ! C : [30% support, 50% con dence] ? Group : G ! G [50% support, 70% con dence] 13
1
21
2
The rst association rule is interpreted as \if consortium C1:3 defects, so may C2:1 (50% con dence)". The second association rule says \if group G1 defects, so may G2 (70% con dence)". The following example illustrates the \chain-e�ect" of a defection based on the taxonomy of Customer. If consortium C1:3 defects, consortiums C1:1 and C1:2 within the same group G1 are likely to defect too because of their established business transactions. So will C2:1, due to its association with C1:3 found in the above association rule. This will further a�ect the consortiums C2:2 and C2:3 within the same group of G2 . Similarly, should group G1 defect, G2 is likely to follow suit. Eventually, all the consortiums in these two groups will defect together to another relayer. It is imperative to detect this kind of chain reaction before it is too late. The mining of multiple-level association rules enables the company to regularly predict possible chain reaction of a defection, thus giving it a good chance to take pertinent actions before a major customer starts leaving for a new relayer, thereby in uencing its associated business partners not to leave either. The knowledge of associations also allows the marketing department to customize attractive schemes for the customers' alliances identi ed, in order to attract more volumes from them. It should be highlighted here that association rules may sound relatively easy to be detected by human analysts. However, in a database containing a few millions of transactional records, these associations are simply \drowned out".
6. Conclusions In the course of our work, we have identi ed some interesting objective indicators among a large number of attributes. The nding has veri ed our earlier conjecture on the limitations of human capabilities. In addition, preliminary experiments on the historical data sets have successfully identi ed some already-defected customers, way before they
p1.tex; 30/07/1999; 10:19; p.20
21 showed prominent signs of defection. This work is signi cant because our approach can be generalized into solving similar problems in the sales and services related industries, like Telecommunications, Internet Service Providers, Insurance, Cargo Transshipment, etc. For instance, a popular strategy used by many companies in the services industry is using attractive promotions and discounts to \lure" new customers into short-term services under them. Even departmental stores in the sales industry come up with their own VIP smart cards in a bid to retain their customers. We would like to highlight that the information from the logs and databases can potentially be turned into valuable knowledge for competitive advantages. For example, the customers' particulars and their pro les (like mobile-phone or Internet usage patterns) could be mined for predicting a list of potential defectors among them. Since most customers are bound to the services of a company for at least a period of time (usually around a year), special o�ers can be made to those who show signs of dissatisfaction. Many ideas presented here can in fact be modi ed to suit various applications of similar needs. For instance, although the third sub-task in our work is made possible by the availability of the transactional associations, unique to a business of hierarchical structure, there are many other kinds of associations practitioners can look for in di�erent problem domains. Spatial associations can be identi ed and applied in some property-related problems while sequential associations can be found from a sales-transactional database and applied to predicting future purchases in E-business. These di�erent associations in di�erent problem domains can help infer valuable knowledge. One of the goals of this work is to show that the maturity of data mining has reached a point where large-scale applications to practical problems are desirable and feasible. This work will hopefully create some sort of \chain-e�ect" in motivating the strategic use of data mining in business applications where conventional approaches fall short. The success of practical applications serves to remind the executives and managers that understanding the underlying concept of the data mining methods remains the key to a successful data mining application. There is no such data mining tool that can t into every kind of problems. Neither is there any short-cut solution to a complicated problem. A detailed analysis, a good design and a systematic development are necessary for a successful application. This work further demonstrates that data mining is very much an art, in the context of practical applications.
p1.tex; 30/07/1999; 10:19; p.21
22
Acknowledgements We would like to thank Farhad Hussain and Manoranjan Dash for helping us nalize this version of the paper, and the company involved in the project to make this application possible although it is unfortunate that no identity of the company can be mentioned. We are also indebted to the anonymous reviewers and the editor for their detailed constructive suggestions and comments.
References Agrawal, R., T. Imielinski, and A. Swami: 1993, `Database Mining: A Performance Perspective'. IEEE Trans. on Knowledge and Data Engineering 5(6), 914{925. Agrawal, R. and R. Srikant: 1994, `Fast Algorithms for Mining Association Rules in Large Databases'. In: Proceedings of the 20th VLDB Int'l Conference, Santiago, Chile. pp. 487{499. Blum, A. and P. Langley: 1997, `Selection of Relevant Features and Examples in Machine Learning'. Arti cial Intelligence 97, 245{271. Clearwater, S., T. Cheng, H. Hirsh, and B. Buchanan: 1989, `Incremental Batch Learning'. In: A. Segre (ed.): Proceedings of The Sixth International Workshop on Machine Learning. Morgan Kaufmann Publishers, Inc., pp. 366 { 370. Dash, M. and H. Liu: 1997, `Feature Selection Methods for Classi cations'. Intelligent Data Analysis: An International Journal 1(3). http://www-east.elsevier.com/ida/free.htm. Fayyad, U., G. Piatetsky-Shapiro, and P. Smyth: 1996, `From Data Mining to Knowledge Discovery: An Overview'. In: U. Fayyad, G. Piatetsky-Shapiro, P. Smyth, and R. Uthurusamy (eds.): Advances in Knowledge Discovery and Data Mining. AAAI Press / The MIT Press, pp. 495{515. Han, J. and Y. Fu: 1996, `Attribute-Oriented Induction in Data Mining'. In: U. Fayyad, G. Piatetsky-Shapiro, P. Smyth, and R. Uthurusamy (eds.): Advances in Knowledge Discovery and Data Mining. AAAI Press / The MIT Press, pp. 399{421. John, G., R. Kohavi, and K. P eger: 1994, `Irrelevant Feature and the Subset Selection Problem'. In: W. a. H. H. Cohen (ed.): Machine Learning: Proceedings of the Eleventh International Conference. New Brunswick, N.J., pp. 121{129. Kamber, M., J. Han, and J. Chiang: 1997, `Metarule-Guided Mining of MultiDimensional Association Rules Using Data Cubes'. In: Proceedings of the 3rd Int'l Conference on Knowledge Discovery and Data Mining (KDD-97). p. 207. Levin, R., D. Rubin, J. Stinson, and E. Gardener: 1992, Quantitative Approach to Management (8th Edition), Chapt. 3 - Forecasting, pp. 103{134. McGraw-Hill. Liu, H. and H. Motoda: 1998, Feature Selection for Knowledge Discovery Data Mining. Boston: Kluwer Academic Publishers. Matheus, C., G. Piatetsky-Shapiro, and D. McNeil: 1994, `An Application of KEFIR to the Analysis of Healthcare Information'. In: Proceedings of the 11th Int'l Conference on Arti cial Intelligence AAAI-94, Workshop on Knowledge Discovery in Databases. pp. 25{36.
p1.tex; 30/07/1999; 10:19; p.22
23 Merz, C. and P. Murphy: 1996, UCI Repository of machine learning databases. http://www.ics.uci.edu/~mlearn/MLRepository.html. Irvine, CA: University of California, Department of Information and Computer Science. Piatetsky-Shapiro, G. and C. Matheus: 1994, `The Interestingness of Deviations'. In: Proceedings of the 11th Int'l Conference on Arti cial Intelligence AAAI-94, Workshop on Knowledge Discovery in Databases. pp. 25{36. Quinlan, J.: 1986, `Induction of Decision Trees'. Machine Learning 1(1), 81{106. Quinlan, J.: 1993, C4.5: Programs for Machine Learning. Morgan Kaufmann. Srikant, R. and R. Agrawal: 1996, `Mining Quantitative Association Rules in Large Relational Tables'. In: Proceedings of ACM SIGMOD Conference on Management of Data. Montreal, Canada. Widmer, G.: 1996, `Recognition and Exploitation of Contextual Clues via Incremental Meta-Learning'. In: L. Saitta (ed.): Machine Learning: Proceedings of the Thirteenth International Conference. Bari, Italy, pp. 525{533.
p1.tex; 30/07/1999; 10:19; p.23
p1.tex; 30/07/1999; 10:19; p.24