Hindawi Publishing Corporation Mathematical Problems in Engineering Volume 2014, Article ID 681259, 13 pages http://dx.doi.org/10.1155/2014/681259
Research Article D-FNN Based Modeling and BP Neural Network Decoupling Control of PVC Stripping Process Shu-zhi Gao,1 Jing Yang,2 and Jie-sheng Wang3 1
College of Information and Engineering, Shenyang University of Chemical Technology, Shenyang 110142, China Multi-Functional Design and Research Academy, Zhengzhou University, Zhengzhou 450001, China 3 School of Electronic and Information Engineering, University of Science and Technology Liaoning, Anshan 114044, China 2
Correspondence should be addressed to Jie-sheng Wang; wang
[email protected] Received 23 December 2013; Accepted 18 March 2014; Published 15 April 2014 Academic Editor: Qintao Gan Copyright © 2014 Shu-zhi Gao et al. This is an open access article distributed under the Creative Commons Attribution License, which permits unrestricted use, distribution, and reproduction in any medium, provided the original work is properly cited. PVC stripping process is a kind of complicated industrial process with characteristics of highly nonlinear and time varying. Aiming at the problem of establishing the accurate mathematics model due to the multivariable coupling and big time delay, the dynamic fuzzy neural network (D-FNN) is adopted to establish the PVC stripping process model based on the actual process operation datum. Then, the PVC stripping process is decoupled by the distributed neural network decoupling module to obtain two singleinput-single-output (SISO) subsystems (slurry flow to top tower temperature and steam flow to bottom tower temperature). Finally, the PID controller based on BP neural networks is used to control the decoupled PVC stripper system. Simulation results show the effectiveness of the proposed integrated intelligent control method.
1. Introduction With VCM as a raw material, the suspension method to produce polyvinyl chloride (PVC) resin is a kind of typical intermittent chemical production process [1]. The traditional polymerization monomer conversion ratio is controlled to the scope 85%–90%. Unreacted vinyl chloride monomer is recovered by self-pressure, and 1%-2% of the monomers are still remained in PVC slurry. In the production, vinyl chloride monomer must be getting a further removal and recovery due to its some toxicity. The removal of residual vinyl chloride in polyvinyl chloride can improve the quality of polyvinyl chloride, reduce the cost of production, and solve the problem of environmental pollution caused in plastic processing and usage. At present, the stripping technique is very effective among all the removal methods of redundant VCM monomers in PVC slurry [2]. Now the research on the control methods in PVC industry mostly is in the stage of polymerization and distillation, where many advanced control techniques, such as neural network, fuzzy control, expert system, and predictive control methods, have been widely used [3–5]. Li [3] proposed a BP neural
network decoupling controller applied to the temperature control of rectifying column. The simulation results show that the algorithm has strong robustness. Xiao et al. [4] established steady-state optimization model of expanded bed energy consumption and designed feedback control system of multivariable state based on artificial neural network for the drying process of fluidized bed, effectively removing the decoupling association between the variables and achieving the dynamic optimization control of bed temperature. The actual operation results show that this system has strong robustness and achieve the minimum energy consumption control indicators of expanded bed. Khairiyah et al. [5] proposed the predictive control system based on neural network applied to the control of the rectifying tower, which makes the system have a smaller overshoot and shorter response time. However, the research on the advanced control methods for the PVC stripping process is lack. The stripping process has characteristics of highly nonlinear, strong coupling, and time varying. It is difficult to establish a precise mathematical model and achieve good control effect by using traditional control methods.
2 Dynamic fuzzy neural network (DFNN) is a hybrid model of fuzzy theory and neural network method, whose function is equivalent to the TSK fuzzy system [6–10]. Based on the problem complexity and precision demand, D-FNN model can be constructed combining the system prior knowledge. An improved fuzzy neural network modeling method [11] was proposed to realize the soft sensor of molten index in the polymerization process, in which a hybrid learning method based on LM algorithm and a steepest descend method to train the network parameters exist. Simulation results show that the model has the merits of being not sensitive to initial values, fast convergence velocity, and high forecasting precision. The particle swarm algorithm (PSO) is adopted to optimize the parameters of the fuzzy neural network to set up a soft-sensor model of acrylonitrile yield [12]. Li and Lee [13] proposed an interval type-2 fuzzy system integrated with an observer-based hierarchical fuzzy neural controller, which can greatly reduce the number of adjusted parameters. Wu et al. proposed the maximum likelihood estimators used in nonparametric maximum likelihood fuzzy neural networks (MFNNs) for nonlinear regression problems and simple weight updating rules based on gradient descent and iteratively reweighted least squares (IRLS) will be derived [14]. Nasr and Chtourou [15] proposed a self-organizing map-based initialization for hybrid training based on a twostage learning approach for feedforward neural networks. The weights between input and hidden layers are firstly adjusted by Kohonen algorithm with fuzzy neighborhood, whereas the weights connecting hidden and output layers are adjusted using gradient descent method. Hung-Ching proposed an adaptive self-constructing fuzzy neural network (ASCFNN) controller for a real inverted pendulum system, where the Mahalanobis distance (M-distance) method in the structure learning is also employed to determine if the fuzzy rules are generated/eliminated or not [16]. D-FNN is also successfully applied in many fields, such as function approximation, permanent-magnet synchronous motor drive control [17, 18]. In this paper, the D-FNN model of the PVC stripping process has been established firstly. Then the neural network decoupling modules and BP neural network PID controller are applied in the stripping temperature control. The effectiveness of the proposed intelligent control strategy is verified by the simulation experiments. The paper is organized as follows. In Section 2, the technique flowchart of PVC stripping process is introduced. The stripping process model based on dynamic fuzzy neural networks is presented in Section 3. In Section 4, the neural network decoupling controller of stripping process is summarized. In Section 5, simulation results are introduced in detail. Finally, the conclusion illustrates the last part.
2. Technique Flowchart of PVC Stripping Process In the polymerization reaction process of vinyl chloride, according to the different techniques and resin grades, the polymerization conversion rate of vinyl chloride is generally controlled within the scope of (80%, 90%). Even the unreacted monomer is disposed by the autoclave recovery and
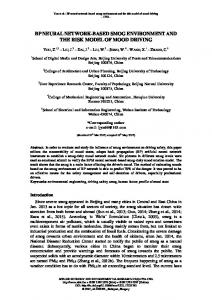
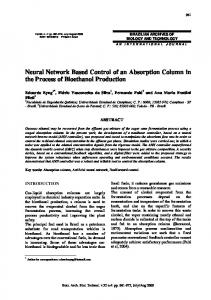
Mathematical Problems in Engineering precipitated groove blowing, and there still remains small amount of vinyl chloride monomer in resin products, which will influence the products quality and increase the hazards when using the produced plastic. In addition, vinyl chloride emission into atmosphere per year not only causes a huge waste of raw materials, but also causes serious environment pollution. Currently, among all the approaches to the removal of excess VCM monomer in PVC slurry, the stripping technique is very effective. Firstly, the stripping mechanism of PVC slurry is introduced in detail. In the PVC suspension to be stripping treated in the off chute of PVC polymerization, the mass fraction of PVC is about 25%–30%, the VCM is 2%–4%, and the rest is water. The mass approximation allocation ratio of VCM in gassed is about 1 : 1000 : 100. Because of the different amount distribution of VCM in the three phases, the slurry itself has the characteristic of the diffused concentration gradient. In PVC slurry, the VCM in the solid PVC either by parsing or by spreading must pass through the film layer to a low concentration of VCM in water for spreading through the pores in PVC particles. Moreover, the solubility of VCM in water changes within the variation of temperature. In different temperature, when the VCM in water reaches to solubility, the part which diffused from PVC into water will break the static pressure of the liquid water layer and diffuse into the gas phase. With the above mechanism, the heat exchange makes the slurry’s temperature increase so that the VCM will be parsed. There are two main tower stripping devices. What we research in this paper is the sieve wear weir plate stripper. The stripping technique of the PVC slurry is shown in Figure 1. After the polymerization reaction, the PVC slurry is threw into the top of stripper from the polymerization vessel through the inlet slurry pump. But before entering the stripper, they need to carry through the heat exchange with the slurry stripped from the bottom of stripper and then go into the top of stripper. PVC slurry sprinkles evenly on the tray by sprinklers and flow from the top to bottom along the strays from the first layer stray. The low pressure steam enters from the stripper bottom, rises through the orifice of the tray from the bottom to top, and countercurrent contacts with the declining PVC slurry at each plate for heat and mass transfer. Finally, it will resolve internal vinyl chloride and the residue in the surface of the resin particles. Steam and parsed vinyl chloride gas are discharged from the top of the stripper. After the condensation by overhead condenser, it enters into the condensate sink, then separates condensate, and controls the level of condensate sink. The excess condensate will be discharged to the centrifuge mother liquor water recovery unit, and the separate vinyl chloride gas will be recovered to vinyl chloride gas cabinets. The key parameters influencing the PVC stripping process can mainly include temperature, steam, slurry flow rate, and pressure. Table 1 gives the parameters values in the PVC stripper controller of a certain type resin. Through the analysis of PVC stripping process, it has the characteristics of strong nonlinear and coupling. Because of lack of effective mathematical model and strong coupling between the variables, it is difficult to achieve satisfactory
Mathematical Problems in Engineering
3 Table 1: Parameters of PVC string tower.
Parameter
Scope
Temperature in tower top
0–150∘ C
Temperature in tower bottom
0–150∘ C
Pressure in tower top
0-0.1 MPa
Pressure difference in tower
0–60 MPa
Steam flow rate
Alarm value Upper limit: 110∘ C Lower limit: 70∘ C Upper limit: 130∘ C Lower limit: 100∘ C Upper limit: 0.08 MPa Lower limit: 0.02 MPa Upper limit: 30 MPa Lower limit: 5 MPa Upper limit: 3500 kg/h Lower limit: 1000 kg/h Upper limit: 70 m3 /h Lower limit: 15 m3 /h Upper limit: 0.5 MPa Lower limit: 0.15 MPa
0–4000 kg/h
Inlet slurry flow rate
0–80 m3 /h
Steam pressure in tower
0–0.6 MPa
Normal scope
Real value
80–105∘ C
85∘ C
105–113∘ C
107∘ C
0.03–0.06 MPa
0.03 MPa
10–25 MPa
15 MPa
1500–3000 kg/h
2200 kg/h
35–50 m3 /h
40–45 m3 /h
0.35–0.4 MPa
0.38 MPa
Stripping tower Condenser
Flushing water Antifoaming agents
To gasometer hot water
Cold water
Pressure differential
To centrifuge
To wastewater disposal basin
Saturated steam
Heat exchanger
Steam
Slurry pump Filter
Discharging pump
Figure 1: Flow diagram of PVC stripping process.
control effect. The integrated model and hybrid intelligent control strategies based on neural network technology are put forward for the PVC stripping process in this paper. The data used for modeling all derived from the history data recorded in the operating process of PVC stripping tower. Each data sample includes the following elements: top tower temperature, bottom tower temperature, top tower pressure, tower differential pressure, slurry flow rate, and steam flow rate. According to the analysis of stripping technique, the key factors which influence vinyl chloride removed from PVC are the top tower temperature and the bottom tower temperature. So there are two mainly important control factors, which are the steam flow rate and the slurry flow rate during the process regulation. Therefore, the D-FNN model is built in which the steam flow rate and slurry flow rate are the input variables, and the top tower temperature and the bottom tower temperature are the output variables.
3. Stripping Process Modelling Based on Dynamic Fuzzy Neural Networks According to the analysis of the stripping process, the changeable slurry flow or the steam flow rate not only influences the top tower temperature but also the bottom tower temperature. Consequently, the coupling exists in the PVC stripping process. The coupling object model needs to be built and the stripping process needs to be decoupled. Suppose the dynamic system model is described as the following nonlinear equation: 𝑦 (𝑘) = 𝑓 [𝑦 (𝑘 − 1) , . . . , 𝑦 (𝑘 − 𝑛𝑎 ) , 𝑢1 (𝑘) , . . . , 𝑢1 (𝑘 − 𝑛𝑏 ), 𝑢2 (𝑘) , . . . , 𝑢2 (𝑘 − 𝑛𝑏 )] , (1)
4
Mathematical Problems in Engineering u1 (k)
y(k)
PVC stripping process
u2 (k)
+ e(k)
x1
− Dynamic fuzzy neural network
. ..
I1
ym (k)
. . .
.. .
Figure 2: Modeling of stripping process based on D-FNN. xn
where 𝑦 is the top tower temperature or bottom tower temperature, 𝑢1 is the steam flow rate, 𝑢2 is the slurry flow rate, and 𝑘 is the sample time (20 s). The D-FNN control strategy of the PVC stripping process is put forward shown in Figure 2, whose inputs variables are the steam flow rate and the slurry flow rate and output variables are the top tower temperature and the bottom tower temperature. 3.1. Structure of D-FNN. The structure diagram of D-FNN [19–23] is shown in Figure 3. In Figure 3, 𝑥1 , 𝑥2 , . . . , 𝑥𝑟 is the input linguistic variables, y is the system output, MF𝑖𝑗 represents the jth membership function of the ith input variable, 𝑅𝑗 is the jth fuzzy rule, 𝑁𝑗 is the jth normalized node, 𝑤𝑗 is the connection weight of the jth rule, and u refers to the numbers of the system rules. Then each layer of the D-FNN is described in detail. Layer 1 is the input layer, whose each node represents an input linguistic variable. Layer 2 is the membership function layer, whose each node represents a membership function (MF) defined in the followed Gaussian function: 2
𝜇𝑖𝑗 (𝑥𝑖 ) = exp [− [
(𝑥𝑖 − 𝑐𝑖𝑗 ) 𝜎𝑗2
2
𝜙𝑗 = exp [− [
𝜎𝑗2
] = exp [− ]
(2)
]
2 −𝑋 − 𝐶𝑗
[
𝜎𝑗2
] , (3) ]
where 𝑗 = 1, . . . , 𝑢, 𝑋 = (𝑥1 , . . . , 𝑥𝑟 ) and 𝐶𝑗 = 𝑐1𝑗 , . . . , 𝑐𝑟𝑗 is the center of the jth RBF unit. Layer 4 is the normalization layer, where the output of the 𝑁𝑗 node is defined as 𝜓𝑗 =
𝜑𝑗 𝑢 ∑𝑘=1 𝜑𝑘
𝑗 = 1, 2, . . . , 𝑢.
wj
.. .
In
w1
. . .
. . .
Ru
Nu
Layer 3
Layer 4
∑
Y
wn
.. .
MFru
Layer 1
Layer 2
Layer 5
Figure 3: Structure diagram of D-FNN.
Layer 5 is the output layer, whose each node is an output variable, a summation of input signals described as follows: 𝑢
𝑦 (𝐾) = ∑ 𝑤𝑘 ⋅ 𝜓𝑘 ,
(5)
𝑘=1
where y is the output variable and 𝑤𝑘 is the weight of the kth rule. For the TSK model, it can be represented as follows: 𝑤𝑘 = 𝑎𝑘0 + 𝑎𝑘1 𝑥1 + ⋅ ⋅ ⋅ + 𝑎𝑘𝑟 𝑥𝑟
𝑘 = 1, 2, . . . , 𝑢.
(6)
Then (2)–(5) are fed into (5) to obtain 𝑢
𝑦 (𝑋) = ∑ [ (𝑎𝑖0 + 𝑎𝑖1 𝑥1 + ⋅ ⋅ ⋅ + 𝑎𝑖𝑟 𝑥𝑟 ) 𝑖=1
],
where 𝑖 = 1, 2, . . . , 𝑟, 𝑗 = 1, 2, . . . 𝑢, 𝜇𝑖𝑗 is the jth membership function, 𝑐𝑖𝑗 is the center of the jth Gaussian membership function, 𝜎𝑗 is the width of the jth Gaussian membership function of 𝑥𝑖 , and 𝑟 is the number of input variables. Layer 3 is the T-norm layer, whose each node represents a possible IF-part of fuzzy rules. For the jth rule 𝑅𝑗 , its output is defined as follows: ∑𝑟𝑖=1 (𝑥𝑖 − 𝑐𝑖𝑗 )
. . .
. . .
. . .
(4)
2 𝑋 − 𝐶𝑖 × exp (− )] 𝜎𝑖2
(7)
−1 2 𝑋 − 𝐶𝑖 × (∑ exp (− )) . 𝜎𝑖2 𝑖=1 𝑢
3.2. Learning Algorithm of D-FNN. Each node in layer 3 of the D-FNN represents an RBF unit or the IF-part for fuzzy rules. If the number of fuzzy rules is required to be identified, the DFNN structure is not predefined. So a new learning algorithm for the D-FNN is adopted to automatically determine the fuzzy rules satisfying the required system performances. 3.2.1. Rule Generation Criteria. If there are only few rules, the system cannot fully represent the input-output state space. But if there are too many rules, the system can be unnecessarily complicated, and the generic ability of D-FNN can become worse because of the greatly increased calculation burden. So the system errors are the principal elements to determine whether the new rules can be added.
Mathematical Problems in Engineering
5
The error criterion can be described as follows. For the ith observation point (𝑋𝑖 , 𝑡𝑖 ), where 𝑋𝑖 is the input vector and 𝑡𝑖 is the desired output, compute the overall D-FNN output 𝑦𝑖 according to (7). Define the error as follows: (8) 𝑒𝑖 = 𝑡𝑖 − 𝑦𝑖 . If the following condition is satisfied, a new rule should be added. In (9), 𝑘𝑒 is determined according to the desired accuracy of the D-FNN: 𝑒𝑖 > 𝑘𝑒 . (9) 3.2.2. Accommodation Boundary. Gaussian function has good locality characteristic because its output is monotonic decreasing along with the increasing distance between the output and the centers. When the membership function of input variables is described by Gaussian function, the whole input space is divided by a series of Gaussian function. If a new sample is located in some Gaussian function, that is to say within accommodation boundary, the new sample can be represented by the existed Gaussian function, without new Gaussian unit produced by D-FNN. The accommodation boundary criterion is described as follows. For the ith observation point (𝑋𝑖 , 𝑡𝑖 ), calculate the distance 𝑑𝑖 (𝑗) between the observation 𝑋𝑖 and the center 𝐶𝑗 of the existed RBF units by 𝑑𝑖 (𝑗) = 𝑋𝑖 − 𝐶𝑗 ,
𝑗 = 1, 2, . . . , 𝑢.
(10)
Find the minimum distance by (11). If 𝑑min > 𝑘𝑑 , a new fuzzy rule should be added. Otherwise, the observation 𝑋𝑖 can be represented by the nearest existed RBF unit. Here, 𝑘𝑑 is the effective radius of the accommodation boundary 𝑑min = arg min (𝑑𝑖 (𝑗)) .
(11)
3.2.3. Hierarchical Learning Strategy. The concept of hierarchical learning is that the accommodation boundary of each RBF unit is not fixed but adjusted dynamically in the following style. Firstly, the accommodation boundaries are set larger for achieving rough but global learning. Then, they are gradually reduced for fine adjustment. Inspired by this idea, a simple method based on monotonically decreasing function is proposed to reduce both the effective radius of each RBF unit and error index gradually [22]. To be more specific, the discussed above 𝑘𝑒 and 𝑘𝑑 are not constant. They are changeable according to the following equations:
𝑘𝑑 = max [𝑑max × 𝛾𝑖 , 𝑑min ] ,
3.2.4. Allocation of Precedent Parameters. After a fuzzy rule is obtained, the problem is how to determine its parameters. The width of the RBF unit has great significant on its generalization. If it is less than the distance between adjacent inputs, the RBF unit does not generalize well and D-FNN will not give meaningful outputs in response to inputs. However, if the width is too large, the output of the RBF nodes may always be large irrespective of inputs. Hence, the initial parameters of the new produced rule are allocated based on the following equations: 𝐶𝑖 = 𝑋𝑖 ,
(13)
𝜎𝑖 = 𝑘 × 𝑑min ,
where 𝑘 (𝑘 > 1) is an overlap factor. What we needed to pay attention to is that when the first pattern (𝑋1 , 𝑡1 ) enters the D-FNN, it is selected as the first fuzzy rule: 𝐶1 = 𝑋1 , 𝜎1 = 𝜎0 , where 𝜎0 is a preset constant. It is worth highlighted that only when ‖𝑒𝑖 ‖ > 𝑘𝑒 , 𝑑min > 𝑘𝑑 , one fuzzy rule needs to be added. 3.2.5. Determination of Decision Parameters. According to the criteria of rule generation, suppose 𝑢 fuzzy rules are generated based on the 𝑛 observation datum. So the output of 𝑁 nodes can be obtained according to (4), which can be represented as follows: 𝜓11 ⋅ ⋅ ⋅ 𝜓1𝑛 [ .. 𝜓 = [ ... . ⋅ ⋅ ⋅ 𝜓 𝜓 𝑢𝑛 [ 𝑢1
..] . .]
(14)
]
Then, for any input 𝑋𝑗 (𝑥1𝑗 , 𝑥2𝑗 , . . . , 𝑥𝑟𝑗 ), the system output 𝑦𝑗 can be calculated by (5), which can be described in more compact form: 𝑊Ψ = 𝑌.
(15) 𝑛
Suppose the ideal output is 𝑇 = (𝑡1 , 𝑡2 , . . . , 𝑡𝑛 ) ∈ R . The relation between Ψ ∈ R(𝑟+1)𝑢×𝑛 and 𝑇 ∈ R𝑛 is represented as follows: 𝑌 = 𝑊 × Ψ, (16)
𝐸̃ = ‖𝑇 − 𝑌‖ .
𝑖
𝑘𝑒 = max [𝑒max × 𝛽 , 𝑒min ] ,
between the desired and the actual outputs but are not properly covered by existing fuzzy rules. This stage is called the coarse learning. When 𝑘𝑒 and 𝑘𝑑 reach 𝑒min and 𝑑min , respectively, this stage is named the fine learning.
(12)
where 𝑒max is the predefined maximum error, 𝑒min is the desired D-FNN accuracy, 𝛽 (0 < 𝛽 < 1) is the convergence constant, 𝛾 (0 < 𝛾 < 1) is the decay constant, and 𝑑max and 𝑑min are the largest and the smallest length of the input space, respectively. The key idea of the hierarchical learning is to firstly find the most troublesome positions, which have large errors
Find an optimal coefficient vector based on 𝑊∗ × Ψ = 𝑇.
(17)
The optimal 𝑊∗ is in the following form: −1
𝑊∗ = 𝑇(Ψ𝑇 Ψ) Ψ𝑇 ,
(18) −1
where Ψ𝑇 is the transposition of Ψ and Ψ+ = (Ψ𝑇 Ψ) Ψ𝑇 is the pseudoinverse of Ψ.
6
Mathematical Problems in Engineering 89
100
Tower top temperature (∘ C)
Tower top temperature (∘ C)
88 95
90
85
80
87 86 85 84 83 82 81
75
0
50
100
150 Sample
200
250
80
300
0
10
20
30
40
50
60
70
80
Sample Real output Model output
Real output Model output (a) Training samples
(b) Testing samples
110
109.5
109
109 Tower bottom temperature (∘ C)
Tower bottom temperature (∘ C)
Figure 4: Simulation results of D-FNN modeling of tower top temperature.
108 107 106 105 104 103
108.5 108 107.5 107 106.5 106
0
50
100
150
200
250
105.5
0
20
40
60
80
100
120
Sample
Sample Real output Model output
Real output Model output (a) Training samples
(b) Testing samples
Figure 5: Simulation results of D-FNN modeling of tower bottom temperature.
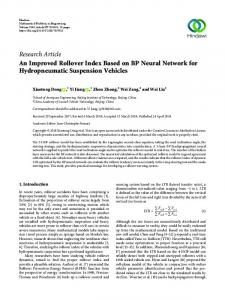
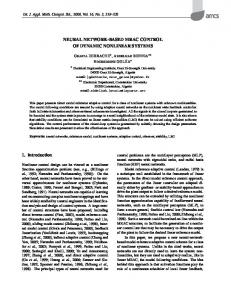
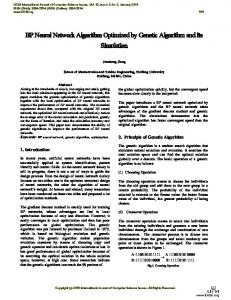
3.3. Simulation Results. The samples are derived from the actual operation datum of the certain chemical corporation, in which 250 groups of input-output data have been selected to identify the system randomly. The other 80 groups of inputoutput data are used to test the identification effect. Then the D-FNN models are obtained, in which the steam flow rate and slurry flow rate are inputs variables, and the top tower temperature and the bottom tower temperature are output variables separately. The identification effect and test results are shown in Figures 4 and 5. It can be seen form Figures 4 and 5 that the output curves of the D-FNN model and the
actual curves of the tower temperature match very well, and the errors are within ±0.1, which can meet the requirement of the process optimization control.
4. Neural Network Decoupling Controller of Stripping Process 4.1. Structure of Intelligent Decoupling Controller. The intelligent decoupling control strategy based on neural network is put forward aiming at the above-established PVC stripping process model. The system diagram is shown in Figure 6.
r1
− e1
NN1 kp1 ki1 kd1 PID1
+
x1 ND1
7
+ u1 +
u1
u2 + +
u2
ND2 r2 +
PID2 − e2
kp2 ki2 kd2 NN2
x2
Controlled object
Mathematical Problems in Engineering
y1
y2
Neural network distributed decoupling device
Figure 6: Decoupling controller structure of PVC stripping process.
The control system consists of PVC stripper object (slurry flow rate to top tower temperature and steam flow rate to tower bottom temperature), two neural network open-loop decoupling modules ND1 and ND2 , and two PID controllers online optimized by two BP neural networks NN1 and NN2 . In Figure 6, 𝑟𝑖 is the system input, 𝑦𝑖 is the system output, 𝑥𝑖 is the controller output vector, 𝑢𝑖 is the output vector of the neural network decoupling module, and 𝑢𝑖 is the control input vector (𝑖 = 1, 2). The intelligent decoupling control system of the stripping process can be divided into two stages.
interconnection problem needs not be considered. At the same time, the dispersion of the objective function is also easy to achieve parallel distributed processing in real time. In addition, the decoupling structure does not change the dynamic characteristics of the controlled process main channel. It will make the design problem easy in engineering. As long as the reasonable structure and parameters of controller 𝑐𝑖 are chosen, the required dynamic characteristics can be obtained. The PVC stripping process is double input and double output coupling system. The structure of the neural decoupling module is shown in Figure 7. The decoupling module is composed of two different neural networks ND1 and ND2 , which are dynamic time delay TDNN networks. Each network has an input terminal and an output terminal. The decoupling module outputs can be expressed as 𝑢2 (𝑘) = 𝑓1 [𝑥1 (𝑘) , 𝑥1 (𝑘 − 1) , ∧, 𝑥1 (𝑘 − 𝑛1 ) , 𝑢2 (𝑘 − 1) , 𝑢2 (𝑘 − 2) , ∧, 𝑢2 (𝑘 − 𝑚2 )] , 𝑢1 (𝑘) = 𝑓2 [𝑥2 (𝑘) , 𝑥2 (𝑘 − 1) , ∧, 𝑥2 (𝑘 − 𝑛2 ) , 𝑢1 (𝑘 − 1) , 𝑢1 (𝑘 − 2) , ∧, 𝑢1 (𝑘 − 𝑚1 )] , (19)
4.1.1. Training Stage. The neural network PID controller is disconnected and the system is in open-loop training state. Firstly, the neural decoupling module ND1 is trained and ND2 is maintained as no input. If decoupling is successful, the channel between the slurry flow rate and the tower top temperature will not have output (𝑦1 is 0). Then 𝑦1 is set as the training index function of ND1 . The connection weights of ND1 ’s each layer are adjusted. Similarly, ND2 is trained in the same way. Finally, the whole stripper controlled object is decoupled into two SISO systems (slurry flow rate, the tower top temperature, and the steam flow rate, the tower bottom temperature). 4.1.2. Control Stage. NN1 and NN2 are used to online optimize the PID controller parameters for realizing the closedloop control for the two SISO systems. After training of ND1 and ND2 , the weights are maintained unchanged. At this time, the entire stripper controlled object is decoupled into two SISO systems. Then two BPNN PID controllers (NN1 and NN2 ) are, respectively, adopted to realize the closed-loop control of two SISO systems. NN1 and NN2 will be used to online adjust the PID controller’s parameters 𝐾𝑝 , 𝐾𝑖 , and 𝐾𝑑 . 4.2. Structure of Neural Network Decoupling Module. The neural network decoupling module consists of 𝑛 × (𝑛 − 1) SISO neural network (𝑛 is the number of the object inputs), whose structure is shown in Figure 7. Each neural network decoupling module is single-input-single-output (SISO) subsystem, which is responsible for only one channel decoupling. So its structure and indicator function are relatively simple because the total objective function has been decomposed into single objective functions and the decoupling modules’
where u is the output of neural network decoupling module, 𝑘 is sampling frequency, and 𝑚1 , 𝑚2 , 𝑛1 , and 𝑛2 are the positive integers, which are determined according to the controlled process’ order. The decoupling module in this paper adopts a three-layer neural network. The neural network’s excitation function is the hyperbolic tangent function 𝑓(𝑥) = (1 − 𝑒−𝑥 )/(1 + 𝑒−𝑥 ). Its derivative is 𝑓(𝑥) = 1/(2 × (1 − 𝑓2 (𝑥))). 𝑢1 (𝑘) and 𝑢2 (𝑘) are the outputs of the decoupling module. After superimposing the controller outputs 𝑥1 and 𝑥2 , the system control output is obtained by 𝑢1 = 𝑢1 + 𝑥1 and 𝑢2 = 𝑢2 + 𝑥2 . 4.3. Training Algorithm of Neural Network Decoupling Module. For the neural decoupling module shown in Figure 8, theoretically speaking, the expected output of the neural decoupling module should be viewed as the target function. But the NN expected output is unknown. In order to avoid this contradiction, the neural decoupling module and the controlled object are viewed as a generalized object. Thus the neural network training can adopt the system output as the performance function. For neural decoupling modules ND1 and ND2 , the performance index functions are defined as follows:
𝐽1 =
1 𝑁 2 ∑ [𝑦 (𝑘)] , 2 𝐾=0 2
1 𝑁 2 𝐽2 = ∑ [𝑦1 (𝑘)] . 2 𝐾=0
(20)
8
Mathematical Problems in Engineering r1 +
C1
−
x1
y1
u1
1 ND21 .. .
ND12 r2
+
C2
−
x2
.. .
rn
+ −
Cn
u2
1 .. . NDn2 .. .
Controlled object
NDn1
y2
ND1n
xn
NDnn .. .
un
1
yn
Figure 7: Structure diagram of decoupling module.
According to the BP learning algorithm [24, 25], the network weights are updated based on the following equation: Δ𝑤 (𝑘) = −𝜂
𝜕𝐽 + 𝛼 ∗ Δ𝑤 (𝑘 − 1) , 𝜕𝑤
D
(21)
where 𝜂 is the learning rate, 𝛼 is the momentum coefficient, 𝑤 is the weights of the corresponding neural network, and 𝑁 is the number for training samples. For ND1 and ND2 , differentiate the performance index function to obtain Δ𝑤 (𝑘) = Δ𝑤 (𝑘) =
𝜕𝑦 𝜕𝑢 −𝜂∑𝑦2 2 2 𝜕𝑢2 𝜕𝑤 𝑁
𝜕𝑦 𝜕𝑢 −𝜂∑𝑦1 1 1 𝜕𝑢1 𝜕𝑤 𝑁
T
L T x1 (k)
D L
T D
+ 𝛼 ∗ Δ𝑤 (𝑘 − 1) ,
L
(22) + 𝛼 ∗ Δ𝑤 (𝑘 − 1) .
T x2 (k)
For the convenience of discussion, the subscripts are omitted to get the universal formula:
D L
u2 (k − 1) ∧ u2 (k − m2 )
x1 (k)
ND1
u2 (k)
∧ x1 (k − n1 )
u1 (k − 1) ∧ u1 (k − m1 )
x2 (k)
ND2
u1 (k)
∧ x2 (k − n2 )
Figure 8: Schematic diagram of distributed decoupling. 𝑁
Δ𝑤 (𝑘) = −𝜂∑𝑦
𝜕𝑦 𝜕𝑢 + 𝛼 ∗ Δ𝑤 (𝑘 − 1) , 𝜕𝑢 𝜕𝑤
(23)
where Δ𝑤 is the change of weight. In order to adopt BP learning algorithm, the partial derivative 𝜕𝑦/𝜕𝑢 needs to be calculated. However, the learning rate is an adjustable parameter. The partial derivatives multiply the learning rate’s product deciding the change of weights. Therefore, the absolute value of the partial derivatives is not very important. If the partial derivative’s symbols are known, it is recorded as sign(𝜕𝑦/𝜕𝑢). Adjust the learning rate to obtain 𝜕𝑦 (24) 𝜂 = 𝜂 . 𝜕𝑢
Therefore, (23) can be written as
Δ𝑤 (𝑘) = −𝜂 sign (
𝜕𝑦 𝑁 𝜕𝑢 + 𝛼 ∗ Δ𝑤 (𝑘 − 1) . (25) ) ∑𝑦 𝜕𝑢 𝜕𝑤
In the actual industrial production, there are many controlled processes which have monotone increasing or decreasing characteristics. That is to say, y is the monotonically increasing or decreasing function of 𝑢 . When 𝑦 is the monotone increasing of 𝑢 , sign(𝜕𝑦/𝜕𝑢) = 1, or it is −1.
Mathematical Problems in Engineering
9
The relationship between network input and output can be expressed as
Kp Ki
𝑢 = 𝑤(2) 𝑢(1) , (26)
𝑢(1) = 𝑓 (𝑤(1) 𝑢(0) ) , 𝑢(0) = [𝑥 (𝑘) , 𝑥 (𝑘 − 1) , ∧, 𝑥 (𝑘 − 𝑛) , 𝑢 (𝑘 − 1) , 𝑇
𝑢 (𝑘 − 2) , ∧, 𝑢 (𝑘 − 𝑚)] ,
is the connection weight vector between
𝜕𝑤𝑖(2)
1 = (1 − 𝑢2 ) 𝑢𝑖(1) . 2
(28)
For the middle layer, 𝜕𝑢 𝜕𝑤𝑗𝑖(1)
=
(1) 𝜕𝑢 𝜕𝑢𝑗
𝜕𝑢𝑗(1)
𝜕𝑤𝑗𝑖(1)
=
1 1 (1 − 𝑢2 ) 𝑤𝑗(2) (1 − 𝑢𝑗(1)2 ) 𝑢𝑖(0) . 2 2 (29)
Put (28) and (29) into (23); the weight of the output layer and middle layer is updated by the following equations. For the output layer, Δ𝑤𝑖 (𝑘) = −
𝜕𝑦 𝑁 𝜂 sign ( ) ∑𝑦 (1 − 𝑢2 ) 𝑢𝑖(1) 2 𝜕𝑢
e
Kd u
PID controller
Controlled object
y
−
(4) According to the selected samples and time interval, adopt (26) to calculate the output of the neural network 𝑢 , 𝑢(1) , 𝑢(0) , and 𝑁 values of the process variables changed with time (set 𝑢 = 0 at the begin of calculation). (5) According to (30) and (31), calculate the weight variances of the output layer and middle layer and update weights 𝑤(1) and 𝑤(2) . (6) Replete steps (4) and (5) until reaching the specified iterations to determine 𝑤(2) and 𝑤(1) at the end.
network input layer and middle layer. For the output layer, 𝜕𝑢
+
(27)
where 𝑢 is the output signal of the network output layer, 𝑢(1) is the output signal of the network middle layer, 𝑢(1) = [𝑢1(1) , 𝑢2(1) , 𝑢3(1) , ∧] and 𝑢(0) is the input signal of the network input layer, and 𝑤(2) = [𝑤0(2) , 𝑤1(2) , 𝑤2(2) , . . .] is the connection weight vector between network middle layer and output layer. (1) (1) 𝑤11 𝑤12 ⋅⋅⋅ (1) 𝑤22 ⋅⋅⋅ ] ⋅⋅⋅ ⋅⋅⋅ d
r
Figure 9: PID controller based on BP neural network.
𝑤(1) = [ 𝑤21(1)
NN
(30)
+ 𝛼 ∗ Δ𝑤𝑖 (𝑘 − 1) . For the middle layer, 𝜂 𝜕𝑦 𝑁 Δ𝑤𝑗𝑖 (𝑘) = − sign ( ) ∑𝑦 (1 − 𝑢2 ) 𝑤𝑗(2) (1 − 𝑢𝑗(1)2 ) 𝑢𝑖(0) 4 𝜕𝑢 + 𝛼 ∗ Δ𝑤𝑗𝑖 (𝑘 − 1) . (31) The algorithm procedure is described as follows. (1) Connect the neural network decoupling module ND1 and ND2 with the controlled process. (2) Initialize the neural decoupling module weights with the smaller random values. (3) Give the input signals and make the controller output signal correspond to the input signal of the neural decoupling module.
The above process does not involve each variable’s subscript. In practice, the training of network weights can be completed individually according to the above procedure. When ND1 , ND2 , . . . , ND𝑛 are determined, the whole system can be viewed as 𝑛 single variable nonlinear systems. Then each loop can be designed the corresponded controller. 4.4. PID Controller Based on BP Neural Network. The structure of PID controller based on BP neural network is shown in Figure 9. According to the system’s operation states, the PID controller parameters are adjusted to achieve the optimization performance. The neural units in the output layer are in correspondence with three PID controller adjustable parameters 𝑘𝑝 , 𝑘𝑖 , and 𝑘𝑑 . Through self-learning of neural network, the weighted coefficients are adjusted to make the neural network output corresponding to the PID controller parameters with a certain optimal control law. Three layers BP neural network [26] is used for the PVC stripping process. The input layer have 3 neurons: input 𝑟, output 𝑦, and error error: 𝑂𝑖 = 𝑥𝑖1 (𝑖) ,
𝑖 = 1, 2, 3,
(32)
where the subscripts 𝑖, 𝑗, and 𝑙, respectively, represent the input layer, the hidden layer, and the output layer. The hidden layer has 5 neurons. The input of the hidden layer is calculated by 3
𝑛𝑒𝑡𝑗 (𝑘) = ∑𝑤𝑗𝑖 𝑂𝑖 .
(33)
𝑖=1
The output of the hidden layer is calculated by 𝑂𝑗 (𝑘) = 𝑓 (𝑛𝑒𝑡𝑗 (𝑘))
𝑗 = 1, 2, . . . , 5.
(34)
The activation function of the hidden layer neuron adopts the symmetrical sigmoid function 𝑓(𝑥) = tanh(𝑥) = (𝑒𝑥 − 𝑒−𝑥 )/(𝑒𝑥 + 𝑒−𝑥 ).
10
Mathematical Problems in Engineering
The output layer has 3 neurons. The input of the output layer is calculated by 5
𝑛𝑒𝑡𝑙 (𝑘) = ∑𝑤𝑙𝑗 𝑂𝑗 (𝑘) .
(35)
𝑗=1
3
𝑙 = 1, 2, 3.
𝜕𝐸 (𝑘) + 𝛼Δ𝑤𝑙𝑗 (𝑘 − 1) , 𝜕𝑤𝑙𝑗
𝑗 = 1, 2, . . . 5,
𝑙=1
(36)
The output layer nodes are in accordance with three adjustable parameters 𝑘𝑝 , 𝑘𝑖 , and 𝑘𝑑 . Since 𝑘𝑝 , 𝑘𝑖 , and 𝑘𝑑 cannot be negative, the output layer neuron’s activation function is not negative sigmoid function: 𝑔(𝑥) = 1/(2 × (1 + tanh(𝑥))) = 𝑒𝑥 /(𝑒𝑥 + 𝑒−𝑥 ). The performance index function is selected as 𝐸(𝑘) = 1/(2 × (𝑟(𝑘) − 𝑦(𝑘))2 ). The network weights 𝑤𝑗𝑖 and 𝑤𝑙𝑗 are revised according to the gradient descent method. That is to say, according to 𝐸(𝑘), the weighted coefficients are searched and adjusted in the negative gradient direction with an inertia which make search rapidly converge to global minima. From the output layer to the hidden layer, Δ𝑤𝑙𝑗 (𝑘) = −𝜂
Δ𝑤𝑗𝑖 (𝑘) = 𝛼Δ𝑤𝑗𝑖 (𝑘 − 1) + 𝜂𝛿𝑗 𝑂𝑖 (𝑘) , 𝛿𝑗 = 𝑓 (𝑛𝑒𝑡𝑗 (𝑘)) ∑𝛿𝑙 𝑤𝑙𝑗 (𝑘)
The output of the output layer is calculated by 𝑂𝑙 (𝑘) = 𝑔 (𝑛𝑒𝑡𝑙 (𝑘)) ,
Similarly, the learning algorithm of the hidden layer weights is described as
(37)
𝑓 (𝑥) =
(1 − 𝑓2 (𝑥)) 2
(41)
.
The algorithm procedure is described as follows. (1) Determine the structure of BP neural network. That is to say, determine the number of the input layer nodes and the hidden layer nodes. Given all initial weighting coefficients, select the learning rate 𝜂 and the inertial coefficient 𝛼. (2) Sample and obtain 𝑟(𝑘) and 𝑦(𝑘). Then calculate 𝑒𝑟𝑟𝑜𝑟(𝑘) = 𝑟(𝑘) − 𝑦(𝑘).
where 𝜂 is the learning rate and 𝛼 is the inertial coefficient:
(3) Calculate each layer’s input and output of the neural network. The output in BPNN is the three adjustable parameters of the PID controller.
𝜕𝐸 (𝑘) 𝜕𝑦 (𝑘) 𝜕𝑢 (𝑘) 𝜕𝑂𝑙 (𝑘) 𝜕𝑛𝑒𝑡𝑙 (𝑘) 𝜕𝐸 (𝑘) = ⋅ ⋅ , ⋅ ⋅ 𝜕𝑤𝑙𝑗 (𝑘) 𝜕𝑦 (𝑘) 𝜕𝑢 (𝑘) 𝜕𝑂𝑙 (𝑘) 𝜕𝑛𝑒𝑡𝑙 (𝑘) 𝜕𝑤𝑙𝑗 (𝑘)
(4) Calculate the PID output according to the incremental algorithm.
𝜕𝑛𝑒𝑡𝑙 (𝑘) = 𝑂𝑗 (𝑘) . 𝜕𝑤𝑙𝑗 (𝑘) (38) Because 𝜕𝑦(𝑘)/𝜕𝑢(𝑘) is unknown, it is approximated by the symbol function sign(𝜕𝑦(𝑘)/𝜕𝑢(𝑘)). The problem of calculation accuracy can be solved by adjusting the learning rate 𝜂 to compensate. For the output layer, 𝜕𝑢 (𝑘) = 𝑒𝑟𝑟𝑜𝑟 (𝑘) − 𝑒𝑟𝑟𝑜𝑟 (𝑘 − 1) , 𝜕𝑂1 (𝑘) 𝜕𝑢 (𝑘) = 𝑒𝑟𝑟𝑜𝑟 (𝑘) , 𝜕𝑂2 (𝑘)
(39)
𝜕𝑢 (𝑘) = 𝑒𝑟𝑟𝑜𝑟 (𝑘) − 2𝑒𝑟𝑟𝑜𝑟 (𝑘 − 1) + 𝑒𝑟𝑟𝑜𝑟 (𝑘 − 2) . 𝜕𝑂3 (𝑘) Thus the learning algorithm of the output layer weights is described as Δ𝑤𝑙𝑗 (𝑘) = 𝛼Δ𝑤𝑙𝑗 (𝑘 − 1) + 𝜂𝛿𝑙 𝑂𝑗 (𝑘) , 𝛿𝑙 = 𝑒𝑟𝑟𝑜𝑟 (𝑘) 𝑠𝑖𝑔𝑛 (
𝜕𝑦 (𝑘) 𝜕𝑢 (𝑘) ) 𝑔 (𝑛𝑒𝑡𝑙 (𝑘)) 𝜕𝑢 (𝑘) 𝜕𝑂𝑙 (𝑘) 𝑙 = 1, 2, 3,
𝑔 (𝑥) = 𝑔 (𝑥) (1 − 𝑔 (𝑥)) .
(40)
(5) Train BP neural network to online adjust the weights for realizing the self-tuning of the PID controller parameters. (6) Set 𝑘 = 𝑘 + 1 and repeat from step (2) to step (6).
5. Simulation Experiments In order to verify the effectiveness of the D-FNN model and the proposed intelligent decoupling control strategy based on neural network, the D-FNN model is used in neural network decoupling control strategy. Based on the tower top temperature D-FNN model and tower bottom temperature D-FNN model, the neural network decoupling modules ND1 and ND2 and neural network controller NN1 and NN2 are designed. The structure and the parameters of all neural networks are set as follows. The structure of ND1 and ND2 is 5-4-1, the momentum factor 𝜂ND = 0.005, and the learning rate 𝛼ND = 0.9. The structure of NN1 and NN2 is 3-5-3, the inertia 𝜂NN = 0.25, and learning rate 𝛼NN = 0.05. According to the technique of the PVC stripping process, the optimum of the stripper tower top temperature is 85∘ C. Thus in our simulation, the tower top temperature is 85∘ C. The temperature should not exceed 110∘ C, otherwise it will make the PVC resin decomposed and metamorphic. Therefore the upper limit is 110∘ C. The optimum of the stripper tower bottom temperature is 107∘ C and its upper limit is 113∘ C. According to the actual possible working conditions
11
120 107 100 85 80
Temperature (∘ C)
Temperature (∘ C)
Mathematical Problems in Engineering
60 40 20 0
0
5
10
15
90 85 80 70 60 50 40 30 20 10 0
0
Real output Reference output (a) Response curve of tower top temperature
(a) Curves of tower top temperature step input 110
120 107 100 85 80
109.5 Temperature (∘ C)
Temperature (∘ C)
15
Time (min)
Tower top temperature Tower bottom temperature
60 40
109 108.5 108 107.5 107
20 0
10
5
Time (min)
106.5 0
5
10
15
0
5
Time (min) Tower top temperature Tower bottom temperature (b) Curves of tower bottom temperature step input
Figure 10: Simulation results of step input without disturbance.
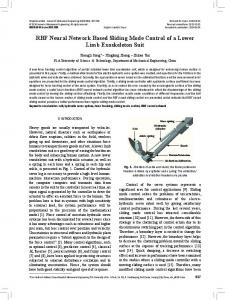
of the stripping process, this paper considers the following situations in the simulation. (1) Without any disturbance, the tracking performance of the tower top temperature and tower bottom temperature is verified, which is shown in Figure 10. It can be seen form Figure 10 that the control system can track the input changes and has a high response performance. (2) The random disturbance Δ𝑦1 = 0.01 is added on the tower top temperature and the simulation results are shown in Figure 11. The random disturbance Δ𝑦2 = 0.01 is added on the tower bottom temperature and the simulation results are shown in Figure 12. By adding the disturbance signals on the tower top temperature and tower bottom temperature, the system decoupling effects are verified. It can be seen form Figures 10 and 11 that the neural network decoupling modules improve the performance of the control system and the transaction between two loops can be controlled effectively.
10
15
Time (min) Real output Reference output (b) Response curve of tower bottom temperature
Figure 11: Simulation results with tower top temperature disturbance.
Based on the above simulation results, the following conclusions can be made. (1) The tracking performance of the system is better and is able to adapt to the change of set points. The response time and other parameters are satisfactory. (2) The coupling degree between the slurry flow rate, the tower top temperature, and steam flow rate, the tower bottom temperature, has been significantly reduced and the decoupling is achieved. (3) The system has certain robustness for the external disturbances. It can overcome the temperature disturbance of the tower top temperature and the tower bottom temperature.
6. Conclusions In the paper, the D-FNN was used to set up the PVC stripping process model. Then the strategy of combination of the neural network decoupling module and the BP neural network PID controller is put forward for controlling the stripping process temperature. The simulation results verify the effectiveness of the proposed PVC stripping intelligent control strategy.
12
Mathematical Problems in Engineering
Temperature (∘ C)
140 120 107 100 80 60 40 20 0
0
10
5
15
Time (min) Real output Reference output (a) Response curve of tower bottom temperature 87.5
Temperature (∘ C)
87 86.5 86 85.5 85 84.5 84 83.5
0
5
Time (min)
10
15
Real output Reference output (b) Response curve of tower top temperature
Figure 12: Simulation results with tower bottom temperature disturbance.
Conflict of Interests The authors declare that there is no conflict of interests regarding the publication of this paper.
Acknowledgments This work is partially supported by the Program for China Postdoctoral Science Foundation (Grant no. 20110491510), the Program for Liaoning Excellent Talents in University (Grant no. LJQ2011027), and the Program for Research Special Foundation of University of Science and Technology of Liaoning (Grant no. 2011ZX10).
References [1] J. S. Wang, S. Han, and Q. P. Guo, “Echo state networks based predictive model of vinyl chloride monomer convention velocity optimized by artificial fish swarm algorithm,” Soft Computing, vol. 18, no. 3, pp. 457–468, 2014. [2] Z. G. Hui, “The application of stripping technology in the production of PVC,” Polyvinyl Chloride, vol. 7, no. 2, pp. 8–12, 2007.
[3] H. Li, “Design of Multivariable Fuzzy-neural Network Decoupling Controller,” Control and Decision, vol. 21, no. 5, pp. 593– 596, 2006. [4] W. G. Xiao, Z. M. Wang, Y. F. Guo et al., “PVC boiling bed drying process optimization control system,” Automation and Instruments in Chemical Industry, vol. 21, no. 5, pp. 12–15, 1994. [5] M. Y. Khairiyah, C. E. Boo, and T. S. Amy, Formulation of Model Predictive Control Algorithm For Nonlinear Processes, University of Technology Malaysia, 2006. [6] S. Q. Wu and J. Xu, Dynamic Fuzzy Neural Network-Design and Application, Tsinghua University Press, Beijing, China, 2008. [7] J. S. Wang and Q. P. Guo, “D-FNN based soft-sensor modeling and migration reconfiguration of polymerizing process,” Applied Soft Computing, vol. 13, no. 4, pp. 1892–1901, 2013. [8] C. K. Kwong, T. C. Wong, and K. Y. Chan, “A methodology of generating customer satisfaction models for new product development using a neuro-fuzzy approach,” Expert Systems with Applications, vol. 36, no. 8, pp. 11262–11270, 2009. [9] K. Y. Chan, C. K. Kwong, and Y. C. Tsim, “Modelling and optimization of fluid dispensing for electronic packaging using neural fuzzy networks and genetic algorithms,” Engineering Applications of Artificial Intelligence, vol. 23, no. 1, pp. 18–26, 2010. [10] C. K. Kwong, K. Y. Chan, and Y. C. Tsim, “A genetic algorithm based knowledge discovery system for the design of fluid dispensing processes for electronic packaging,” Expert Systems with Applications, vol. 36, no. 2, pp. 3829–3838, 2009. [11] R. L. Liu, H. Y. Su, and J. Chu, “A soft sensor modeling algorithm based on modified fuzzy neural network,” Information and Control, vol. 32, no. 4, pp. 367–370, 2003. [12] G.-C. Chen, Y.-F. Xu, and J.-S. Yu, “Soft-sensor modelling of acrylonitrile yield based on particle swarm optimization fuzzy neural networks,” Journal of System Simulation, vol. 19, no. 23, pp. 5370–5372, 2007. [13] I. Li and L. W. Lee, “Interval type 2 hierarchical FNN with the Hinfinity condition for MIMO non-affine systems,” Applied Soft Computing, vol. 12, no. 8, pp. 1996–2011, 2012. [14] H.-K. Wu, J.-H. Hsieh, Y.-L. Lin, and J.-H. Jeng, “On maximum likelihood fuzzy neural networks,” Fuzzy Sets and Systems, vol. 161, no. 21, pp. 2795–2807, 2010. [15] M. B. Nasr and M. Chtourou, “A self-organizing map-based initialization for hybrid training of feedforward neural networks,” Applied Soft Computing Journal, vol. 11, no. 8, pp. 4458–4464, 2011. [16] H. C. Lu, M. H. Chang, and C. H. Tsai, “Adaptive selfconstructing fuzzy neural network controller for hardware implementation of an inverted pendulum system,” Applied Soft Computing, vol. 11, no. 5, pp. 3962–3975, 2011. [17] S. Wu and M. J. Er, “Dynamic fuzzy neural networks—a novel approach to function approximation,” IEEE Transactions on Systems, Man, and Cybernetics B: Cybernetics, vol. 30, no. 2, pp. 358–364, 2000. [18] F. J. Lin, C. H. Lin, and P. H. Shen, “Self-constructing fuzzy neural network speed controller for permanent-magnet synchronous motor drive. Fuzzy Systems,” IEEE Transactions on Fuzzy Systems, vol. 9, no. 5, pp. 751–759, 2001. [19] X. Deng and X. Wang, “Incremental learning of dynamic fuzzy neural networks for accurate system modeling,” Fuzzy Sets and Systems, vol. 160, no. 7, pp. 972–987, 2009. [20] C.-F. Juang and C.-D. Hsieh, “A locally recurrent fuzzy neural network with support vector regression for dynamic-system
Mathematical Problems in Engineering
[21]
[22]
[23]
[24]
[25]
[26]
modeling,” IEEE Transactions on Fuzzy Systems, vol. 18, no. 2, pp. 261–273, 2010. A. Subasi, “Automatic detection of epileptic seizure using dynamic fuzzy neural networks,” Expert Systems with Applications, vol. 31, no. 2, pp. 320–328, 2006. H. Adeli and X. Jiang, “Dynamic fuzzy wavelet neural network model for structural system identification,” Journal of Structural Engineering, vol. 132, no. 1, pp. 102–111, 2006. C.-H. Lee and C.-C. Teng, “Identification and control of dynamic systems using recurrent fuzzy neural networks,” IEEE Transactions on Fuzzy Systems, vol. 8, no. 4, pp. 349–366, 2000. B. H. M. Sadeghi, “BP-neural network predictor model for plastic injection molding process,” Journal of Materials Processing Technology, vol. 103, no. 3, pp. 411–416, 2000. Z. Xiao, S.-J. Ye, B. Zhong, and C.-X. Sun, “BP neural network with rough set for short term load forecasting,” Expert Systems with Applications, vol. 36, no. 1, pp. 273–279, 2009. J. Yi, Q. Wang, D. Zhao, and J. T. Wen, “BP neural network prediction-based variable-period sampling approach for networked control systems,” Applied Mathematics and Computation, vol. 185, no. 2, pp. 976–988, 2007.
13
Advances in
Operations Research Hindawi Publishing Corporation http://www.hindawi.com
Volume 2014
Advances in
Decision Sciences Hindawi Publishing Corporation http://www.hindawi.com
Volume 2014
Journal of
Applied Mathematics
Algebra
Hindawi Publishing Corporation http://www.hindawi.com
Hindawi Publishing Corporation http://www.hindawi.com
Volume 2014
Journal of
Probability and Statistics Volume 2014
The Scientific World Journal Hindawi Publishing Corporation http://www.hindawi.com
Hindawi Publishing Corporation http://www.hindawi.com
Volume 2014
International Journal of
Differential Equations Hindawi Publishing Corporation http://www.hindawi.com
Volume 2014
Volume 2014
Submit your manuscripts at http://www.hindawi.com International Journal of
Advances in
Combinatorics Hindawi Publishing Corporation http://www.hindawi.com
Mathematical Physics Hindawi Publishing Corporation http://www.hindawi.com
Volume 2014
Journal of
Complex Analysis Hindawi Publishing Corporation http://www.hindawi.com
Volume 2014
International Journal of Mathematics and Mathematical Sciences
Mathematical Problems in Engineering
Journal of
Mathematics Hindawi Publishing Corporation http://www.hindawi.com
Volume 2014
Hindawi Publishing Corporation http://www.hindawi.com
Volume 2014
Volume 2014
Hindawi Publishing Corporation http://www.hindawi.com
Volume 2014
Discrete Mathematics
Journal of
Volume 2014
Hindawi Publishing Corporation http://www.hindawi.com
Discrete Dynamics in Nature and Society
Journal of
Function Spaces Hindawi Publishing Corporation http://www.hindawi.com
Abstract and Applied Analysis
Volume 2014
Hindawi Publishing Corporation http://www.hindawi.com
Volume 2014
Hindawi Publishing Corporation http://www.hindawi.com
Volume 2014
International Journal of
Journal of
Stochastic Analysis
Optimization
Hindawi Publishing Corporation http://www.hindawi.com
Hindawi Publishing Corporation http://www.hindawi.com
Volume 2014
Volume 2014