Austin-Seymour M, Kalet I, McDonald J, Kromhout-Schiro S, Jacky J, ... Court L E, Dong L, Lee A K, Cheung R, Bonnen M D, O'Daniel J, Wang H, Mohan R and ...
IOP PUBLISHING
PHYSICS IN MEDICINE AND BIOLOGY
Phys. Med. Biol. 52 (2007) 6575–6587
doi:10.1088/0031-9155/52/22/002
Effect of daily localization and correction on the setup uncertainty: dependences on the measurement uncertainty, re-positioning uncertainty and action level Kwok L Lam, James M Balter and Randall K Ten Haken Department of Radiation Oncology, University of Michigan, Ann Arbor, Michigan 48109, USA
Received 21 May 2007, in final form 12 September 2007 Published 23 October 2007 Online at stacks.iop.org/PMB/52/6575 Abstract With the advent of commercial image-guided radiotherapy, daily correction of the setup uncertainty is feasible. It is beneficial to understand the dependence of the probability density function (pdf) of the corrected setup variation on the action level, localization uncertainty and re-positioning uncertainty so that an appropriate action level is used. Also, that pdf can be used in treatment planning to incorporate setup variation directly in the planning process to generate treatment plans more robust to setup variations. We have found an analytical expression of the pdf of the corrected setup variation assuming normal distributions for the uncertainties. Using the second moment of that pdf as a metric, we have explored the dependence of the metric on the action level for the following cases: (1) the uncertainties in measurement and repositioning are less than the initial setup uncertainty, (2) the uncertainties in measurement and re-positioning are on the order of the initial setup uncertainty, (3) the uncertainty in measurement is the least and (4) the uncertainty in repositioning is the least. An optimal action level exists in case 3. We have also √ found that an action level of µ2p + σp2 + σm2 works well in practice where µp is the mean of the re-positioning uncertainty, σp is the standard deviation of the re-positioning uncertainty and σm is the standard deviation of the localization uncertainty. In typical clinical situations, the distribution of the corrected setup variation can be closely approximated by a normal distribution.
1. Introduction After electronic portal imaging devices (EPID) were available, more frequent patient localization using imaging became manageable. A body of work has been published on optimal protocols for offline correction of systematic setup uncertainties (Amer et al 2001, Bel et al 1993, Bijhold et al 1992, Bortfeld et al 2002, de Boer and Heijmen 2001, de Boer et al 2001, 2005, Gluhchev 1998, Hoogeman et al 2005, Nuver et al 2007, Yan et al 1995). The 0031-9155/07/226575+13$30.00 © 2007 IOP Publishing Ltd Printed in the UK
6575
6576
K L Lam et al
effect of the correction of the systematic error on the distribution of patient setup positions will be a translation of the mean of that distribution to a different value. Following the commercial introduction of image-guided radiotherapy (IGRT) (Court et al 2005, Enmark et al 2006, Guckenberger et al 2006, Hansen et al 2006, Keller et al 2006, Lauve et al 2006, Ling et al 2006, Mohan et al 2005, Perkins et al 2006, Song et al 2007) and the gain in experience in using EPID in the clinic, even daily correction of the setup position is feasible (De Neve et al 1992, Enmark et al 2006, Guckenberger et al 2006, Hansen et al 2006, Keller et al 2006, Perkins et al 2006, Yan et al 1995). With daily online correction, both the systematic setup error and the random setup error can potentially be reduced. Although an obvious purpose of the correction is to modify the mean location and spread of each patient’s setup distribution, the resulting distributions after the implementation of a daily correction protocol have not been explored. Concurrent with the studies on patient setup variations, the relationship between the setup uncertainty and the setup margin used in treatment planning has been extensively studied (Austin-Seymour et al 1995, Balter et al 1993, Goitein 1983, 1985, McKenzie et al 2000, Remeijer et al 2002, van Herk et al 2000, 2002). This leads to a closer look at the concept of the setup margin. Setup uncertainty distributions are starting to be used directly in treatment planning to generate treatment plans that are optimized with respect to an estimated setup uncertainty distribution without incorporation of a setup margin around the tumor (Birkner et al 2003, Li and Xing 2000, L¨of et al 1995, 1998, Lujan et al 1999, McShan et al 2006, Unkelbach and Oelfke 2004, Unkelbach and Oelfke 2005a, 2005b). However, what type of distribution is to be used in the optimization remains an open question when a setup correction protocol is also being employed. In the following, we will derive an analytical expression for the probability density function (pdf) of the corrected setup variation. Based on the analytical expression, we will explore the dependence of the corrected setup variation on the action level and attempt to determine appropriate action levels under different situations. Finally, we will study whether the corrected setup variation can be approximated by a normal distribution under some conditions to simplify its use in treatment planning. 2. Probability density function of the corrected setup variation In this paper, we assume that the patient treatment position problem is defined by three sources of uncertainties: the inter-fraction setup variations themselves, the uncertainty in the ability to localize the patient in the treatment room and the variation in re-positioning of the patient after a corrective action has been decided upon. Also, we will assume that these three sources of uncertainties can be described by normal distributions. We also assume that a positional interval (action level) has been defined in the setup correction protocol to re-position only if the localization indicates that the setup is outside of the interval. The interval could be null for the case of a no threshold correction protocol. We will only consider rigid body translations. If we assume that the three dimensions of the translation are statistically independent, we can reduce the problem to three independent one-dimensional problems. We will consider the problem in a one-dimensional coordinate system with the origin at the planned position of the target. We assume that the positioning protocol uses an action level represented by the open interval (a, b). There are three random variables: (s, l, r). Here, s is the initial setup position, l is the error in localization, i.e. it is the difference between the measured position and the actual position and r is the error in re-positioning. If the measured position is within the action level and no re-positioning is performed for a particular fraction, a realization of r is still sampled from the distribution although it is not used. If we assume that
Daily localization and correction on the setup uncertainty
6577
the variation in the initial setup position, the uncertainty in localization and the uncertainty in re-positioning are statistically independent, the trivariate probability density function can be written as p1 (s, l, r) = fs (s)fm (l)fp (r) where fs , fm and fp are the pdfs for the initial setup uncertainty, measurement uncertainty and re-positioning uncertainty, respectively. The three random variables (s, l, r) are not very convenient for our problem. Firstly, the action level is compared to the measured position which is not one of these three variables. Secondly, we want to find the pdf of the corrected setup position. We will introduce two random variables: m and x. m is the measured position and x is the corrected setup position. m is not equal to s because there is uncertainty in measurement and l = m − s. x is not zero because there are uncertainties in both measurement and re-positioning so that the correction is not perfect. Let us consider the following two situations separately. If m ∈ / (a, b), the patient is re-positioned by correcting for the measured position m and not s. If the re-positioning has no uncertainty, the target will be at a fictitious position z = s − m = −l. Actually, the target is re-positioned with uncertainty r. Thus, r = x − z. As a result, s =z+m l = −z r = x − z. If m ∈ (a, b), the measured position is within the action level and the patient is not re-positioned and s=x l = m − s = m − x. Since the patient is not re-positioned and r is not used, we can set it to the fictitious position z, i.e., r = z. The trivariate pdf can then be written as � m ∈ (a, b) fs (x)fm (m − x)fp (z) p2 (x, m, z) = m∈ / (a, b). fs (z + m)fm (−z)fp (x − z) In order to obtain the pdf of the corrected setup variation x and measurement m, we can integrate over z. The pdf will be m ∈ (a, b) fs (x)fm (m − x) � ∞ (1) fs (z + m)fm (−z)fp (x − z) dz m∈ / (a, b) −∞
The pdf of the corrected setup variation can be computed by integrating over all measurements m: � a � ∞ fs (z + m)fm (−z)fp (x − z) dz dm g(x) = −∞
−∞
�
b
+ a
�
∞� ∞
fs (x)fm (m − x) dm + b
−∞
fs (z + m)fm (−z)fp (x − z) dz dm. (2)
6578
K L Lam et al
If the setup uncertainty, the uncertainty in measurement and the uncertainty in re-positioning can be described by normal distributions, the corresponding pdfs are � � 1 1 (s − µs )2 , fs (s) = √ exp − 2σs2 2π σs � � 1 1 (l − µm )2 fm (l) = √ exp − 2σm2 2π σm and � � (r − µp )2 1 1 fp (r) = √ exp − 2σp2 2π σp where µs , µm , µp are means and σs , σm , σp are standard deviations of their respective distributions. Then, � � � b 1 1 1 (x − µs )2 ({m − x} − µm )2 dm + g(x) = exp − − 2π σs σm a 2σs2 2σm2 (2π )3/2 σs σm σp � � � a � ∞ (x − z − µp )2 (z + m − µs )2 (z + µm )2 × exp − − − dz dm 2σs2 2σm2 2σp2 −∞ −∞ 1 1 (2π )3/2 σs σm σp � � � ∞� ∞ (x − z − µp )2 (z + m − µs )2 (z + µm )2 × exp − − − dz dm. 2σs2 2σm2 2σp2 b −∞ +
(3) If we denote the (cumulative) normal distribution function with mean µ and standard � 2� s) deviation σ by F (x; µ, σ ), then the first term in g(x) will be √2π1 σ exp − (x−µ 2 2σ s s [F (b; x + µm , σm ) − F (a; x + µm , σm )]. By completing the squares for the variables z and m in the exponent, the second term can be integrated to
(x − µp + µm )2 1
� exp − � 2π σm2 + σp2 2 σm2 + σp2 � � σp2 σm2 σp2 + σs2 σp2 + σm2 σs2 σm2 × F a; µs + 2 µm − 2 (x − µp ), . σm + σp2 σm + σp2 σm2 + σp2 The third term is similar to the second term except for the change in integration limits:
� � σp2 (x − µp + µm )2 1 σm2
� exp − � + µ − (x − µp ), 1 − F b; µ s m σm2 + σp2 σm2 + σp2 2π σm2 + σp2 2 σm2 + σp2 �� σm2 σp2 + σs2 σp2 + σm2 σs2 σm2 + σp2 Together, the pdf for x will be
� �
g(x) = N (x; µs , σs ) − N (x; µs , σs )[1 − D(x + µm ; a, b, σm )] + N x; µp − µm , σm2 + σp2 � � �� σp2 σm2 σp2 σm2 2 × 1 − D µs + 2 µm − 2 (x − µp ); a, b, σs + 2 σm + σp2 σm + σp2 σm + σp2 (4)
Daily localization and correction on the setup uncertainty
6579
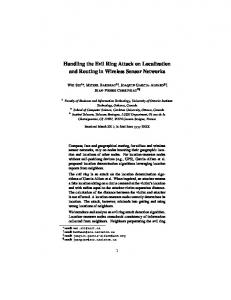
Figure 1. Normal difference distribution function (see the text) for (i) b = −a = 0.2, σ = 1; (ii) b = −a = 5, σ = 1 and (iii) b = −a = 0.2, σ = 0.1.
where
�
� � 1 (x − µ)2 N (x; µ, σ ) ≡ exp − 2π σ 2 2σ 2 D(x; a, b, σ ) ≡ F (b; x, σ ) − F (a; x, σ ).
We will designate D(x; a, b, σ ) to be the normal difference distribution function (normal ddf). For a given σ and (a, b) with b > a, D(x; a, b, σ ) starts at zero, increases to a peak value which is less than or equal to one, and reduces back to zero, when x changes from −∞ to ∞. The steepness of the rise from zero to the peak is determined by σ . The interval of x where the normal ddf stays at a high value depends on (b − a)/σ . For (b − a)/σ � 1, D(x; a, b, σ ) has a plateau close to 1 with a width ∼ (b − a). As (b − a)/σ approaches 1, the plateau region merges
with the� sloping region. For (b − a)/σ � 1, D(x; a, b, σ ) takes the shape , σ as a function of x. Figure 1 illustrates the ddf for (b − a)/σ < 1, of (b − a)N x; a+b 2 (b − a)/σ � 1 and for small σ . The expression for g(x) has an obvious interpretation. The first term is the original density function of the setup variation. The second term is the part of the density function that is removed because the measurement is above the threshold. The third term is the density function of the corrected setup that replaces the part that has been removed. If the third term is more favorable than the second term, the correction will help reduce the setup variation. 3. Effect of the action level 3.1. Dependence of the setup uncertainty on the action level The corrected setup variations for different initial patient setup uncertainties, uncertainties in patient localization, mechanical tolerance for re-positioning and the action level for making corrections can be computed from g(x). For a given treatment, the parameter that can be easily adjusted is the action level. We will also limit our study to situations that a = −b and designate an action level c ≡ b. When the measurement uncertainty and the re-positioning uncertainty are both larger than the setup uncertainty, it is not advantageous to perform localization and correction. Thus, we will only consider the following four situations: the magnitudes of the measurement uncertainty and the re-positioning uncertainty are either much less than or
6580
K L Lam et al
comparable to the setup uncertainty; the magnitude of either the measurement uncertainty or the re-positioning uncertainty is much less than the other two uncertainties. 3.1.1. Metric for the setup uncertainty. The pdf contains a lot of information. In order to compare different action levels, we need a cost which quantifies the resulting patient setup uncertainty. We have chosen to use the second moment µ�2 of g(x) as the metric e to evaluate the error in the corrected setup position x. It is a measure of how far the setup is from zero error on the average in terms of the square of the distance. The second moments of g(x) can be computed analytically: � e ≡ µ�2 ≡ g(x)x 2 dx
� � � = µ2s + σs2 + (−µs + µm − 2µp )σm2 + (−µs + µm )σs2 � �
� � N c; µs + µm , σs2 + σm2 × �
� −N c; −µs − µm , σs2 + σm2 �
+ −σs2 + σm2 c � � � �
�
� 2 2 2 2 N c; µs + µm , σs + σm + N c; −µs − µm , σs + σm � � �� �� + (−µp + µm )2 + σp2 + σm2 − µ2s + σs2 � �
�� (5) 2 − F c; µs + µm , σs2 + σm2 �
� . 2 2 −F c; −µs − µm , σs + σm We can study the dependence of the setup uncertainty metric e on the action level c for various values of (µs , σs , µm , σm , µp , σp ) using the analytical result above. We will consider several situations that are relevant clinically. 3.1.2. The magnitudes of the measurement uncertainty and the re-positioning uncertainty are much less than the magnitude of the setup uncertainty. This is the typical clinical situation where a correction can potentially reduce the resulting setup uncertainty. The dependence of the error metric on the action level for a sample parameter set is shown in figure 2. It has three distinct regions: a region where the mean and standard deviation of the corrected setup uncertainty are close to the combined mean and standard deviation of the measurement and re-positioning uncertainties for the low action level; a region where the mean and standard deviation are close to the original setup uncertainty for the high action level; and a transition region where the mean and standard deviation are changing. When the action level is low, almost every fraction is corrected. As a result, the pdf of the corrected setup uncertainty is determined only by the localization uncertainty and the re-positioning uncertainty with the corresponding setup uncertainty metric (equation (5)) of e = (µp − µm )2 + σp2 + σm2 . When the action level is high, very few fractions are corrected and the setup uncertainty metric remains the same as the original setup uncertainty metric before correction, i.e., e = µ2s + σs2 . 3.1.3. The magnitude of the setup uncertainty is comparable to the magnitude of the measurement uncertainty and the re-positioning uncertainties. When all three uncertainties are comparable, the correction does not improve the accuracy and precision of the resulting setup. An example of this kind of situation is in radiosurgery where the head frame can position the patient as accurately as the imaging system can measure position. Verification measurements are more for the purpose of eliminating gross errors. Figure 3 shows a situation
Daily localization and correction on the setup uncertainty
6581
30
error measure
25 20 15 10 e(c) rule
5 0 0
5
10
15
20
action level (mm)
Figure 2. The dependence of the setup uncertainty on the action level for σs = 5 mm, σm = 1 mm, σp = 1 mm. The action level according to equation (6) is indicated by the dotted line. 2.5
error measure
2.0 1.5 1.0 e(c) rule
0.5 0.0 0
5
10
15
20
action level (mm)
Figure 3. The dependence of the setup uncertainty on the action level for σs = 1 mm, σm = 1 mm, σp = 1 mm. The action level according to equation (6) is indicated by the dotted line.
when all three uncertainties have the same standard deviation. In this case, the least resulting setup uncertainty is achieved by setting the action level very high, i.e. no correction. 3.1.4. The magnitude of the measurement uncertainty or the re-positioning uncertainty is much less than the magnitudes of the other uncertainties. When there is an improvement in imaging technology so that the setup uncertainty can be measured more accurately and precisely, the measurements can be substantially better than the ability to correct the setup uncertainty. Also, this can be used to evaluate the potential gain during the development of new localization techniques. An example of the result for such situations is shown in figure 4(a). The parameters are the same as that in figure 3 except that the measurement uncertainty is reduced by 50%. There is now an optimal action level as the setup uncertainty changes from that limited by the combination of localization and re-position uncertainties at the low action level to that determined by the original setup uncertainty at the high action level. The existence of the minimum in the setup uncertainty can be understood by the following observation. For each treatment fraction, different setup deviations are realized as specified by the distribution of the setup uncertainty. Using the more accurate and precise localization, one can select those fractions within the distribution that will benefit from the re-positioning. For those fractions of treatment where the setup uncertainty happens to be small, the patient is
6582
K L Lam et al 1.4
1.4
(a)
1.0 0.8 0.6 0.4 e(c) rule
0.2
(b)
1.2
error measure
error measure
1.2
1.0 0.8 0.6 0.4 e(c) rule
0.2 0.0
0.0 0
5
10
15
action level (mm)
20
0
5
10
15
20
action level (mm)
Figure 4. (a) The dependence of the setup uncertainty on the action level for σs = 1 mm, σm = 0.5 mm, σp = 1 mm. The action level according to equation (6) is indicated by the dotted line. (b) The dependence of the setup uncertainty on the action level for σs = 1 mm, σm = 1 mm, σp = 0.5 mm. The action level according to equation (6) is indicated by the dotted line.
not re-positioned. By selecting an action level appropriate for the re-positioning uncertainty, one can improve the setup uncertainty beyond what can be achieved by re-positioning every fraction. This can be compared to an equivalent improvement in the re-position uncertainty instead of the localization uncertainty as shown in figure 4(b). The minimum does not exist and the error measure is higher than that in figure 4(a). 3.2. Practical rule for the action level When there is a minimum in the error metric, the action level can be set to that corresponding value. For an error metric distribution which does not have a minimum, such as that in figure 2, it is desirable to set the action level before the error metric starts to rise steeply. The exact value depends on the trade-off between accepting higher uncertainty or higher incidences of the correction. We have surveyed the error metric function for different values of (µs , σs , µm , σm , µp , σp ). For cases where the localization uncertainty and the re-positioning uncertainty are less than the original setup uncertainty so that the setup correction is potentially beneficial, we found that the following rule for the action level works well in practice: � (6) crule = µ2p + σp2 + σm2 . The action levels indicated in figures 2–4 are based on this rule. One useful characteristic of this choice of the action level is that it is independent of the distribution of the original setup uncertainty. As a result, the same action level can be used for all patients. This rule has a simple interpretation. Only setup deviations that are larger than the uncertainty of the equipment need to be corrected. 4. Approximation of the probability density function by a normal probability density function As shown in section 3, if the threshold for action is very large, the setup deviation is almost never corrected and the pdf is the same as that of the original setup uncertainty. If the threshold is very narrow, the setup deviation of almost every fraction is corrected. The corrected setup will not depend on the patient and will instead be determined only by the correction technique. The
Daily localization and correction on the setup uncertainty
6583
0.010 original corrected
0.009 0.008 0.007 0.006 0.005 0.004 0.003 0.002 0.001 0.000 -10
-5
0
5
10
setup error (mm)
Figure 5. The probability density functions of the original setup uncertainty and the corrected setup uncertainty with parameters chosen to illustrate the effect of an action level on the corrected setup uncertainty. The standard deviation for the original setup uncertainty distribution is 5 mm and those for the measurement and re-positioning are both 0.5 mm. The action level was set to 7 mm as can be seen from the steep slope at ±7 mm for the corrected setup uncertainty density function.
systematic error becomes the difference of the means of the measurement and re-positioning. The random error becomes the quadratic sum of the standard deviations of the measurement and re-positioning. In both cases, the pdf approaches a normal density function. As the action level changes from a wide window to a narrow window, the pdf changes smoothly from the original distribution to a distribution determined by the technique. For an intermediate action level, i.e. b ∼ nσs , a ∼ −mσs where 1 < m < 3, 1 < n < 3, and |µp − µm | � |µs |, σm2 + σp2 � σs2 , the ends of the normal pdf in the first term of equation (4) are clipped by the normal ddf in the second term. In the third term, the normal ddf , which has a σ ∼ σs , is much wider than the normal pdf. It determines the relative weight of the third term and the shape is mainly determined by the normal pdf in the third term. As a result, the third term has the shape of a relatively narrow normal pdf. Thus, the probability density function of the corrected setup uncertainty will have a narrow spike on a normal pdf which has clipped ends (figure 5). The clipped ends of the uncorrected pdf are above the action level and they are corrected so that they show up as the spike. Also, it can be seen from the figure that the width of the corrected pdf can be reduced by moving the action levels closer to the spike. As a result, when the optimal action levels are used, the pdf will not have √ the spike-on-a-clipped-distribution feature. In typical clinical situations, |µp − µm | and σm2 + σp2 are smaller than |µ√ s | and σs , respectively, but they are not very much smaller. For example, |µp − µm | and σm2 + σp2 may be about 1–2 mm, where as |µs | and σs may be about 5 mm. Under these conditions, the width of the two normal density functions in equation (4) is not drastically different and the pdf of the corrected setup uncertainty will not have the spike-on-a-bell-shaped-profile character. In figures 6 and 7 we have shown the corrected setup uncertainty pdf and its normal approximation for the action level based on equation (6) and parameters in figures 2 and 4(a), respectively. The expression for the first moment of the corrected distribution is � � µ1 ≡ g(x)x dx � � � � � σm2 + σs2 (c − {µm + µs })2 (c + {µm + µs })2 � �
= − exp − exp − 2π 2 σm2 + σs2 2 σm2 + σs2
6584
K L Lam et al 0.016 original corrected Normal
0.014 0.012 0.010 0.008 0.006 0.004 0.002 0.000 -10
-5
0
5
10
setup error (mm)
Figure 6. The probability density functions of the original setup uncertainty, the corrected setup uncertainty and the normal approximation to the corrected setup uncertainty. The action level (1.4 mm) was that determined by equation (6) and the other parameters are the same as that in figure 2. The normal approximation is so close to the corrected setup uncertainty that the two graphs basically overlap. 0.006 original corrected Normal
0.005 0.004 0.003 0.002 0.001 0.000 -10
-5
0
5
10
setup error (mm)
Figure 7. The probability density functions of the original setup uncertainty, the corrected setup uncertainty and the normal approximation to the corrected setup uncertainty. The action level (1.1 mm) was that determined by equation (6) and the other parameters are the same as that in figure 4(a).
� � �
�� �
+ (µm + µs − µp ) F c; µm + µs , σm2 + σs2 + F c; −µm − µs , σm2 + σs2 + 2µp − 2µm − µs . This in combination with the second moment (equation (5)) can be used to determine the mean and variance of the normal pdf approximation. In order to quantify the similarity between the corrected setup uncertainty and the normal approximation, we use the percentage of area that the overlapping region occupies as a similarity measure and name it pao for per cent area overlap. The pao of the distributions shown in figures 6 and 7 are 99.8% and 96.1%, respectively. 5. Conclusions Here, we have focused on analytical methods to study the corrected setup uncertainty. An advantage of analytical methods is that we are studying the setup distributions directly instead
Daily localization and correction on the setup uncertainty
6585
of the measured samples of the distributions, especially when the measurement uncertainty is one of the random variables in the multivariate distribution. Also one purpose of the study is to determine the pdf of the corrected setup variation so that it can be used in treatment planning. An analytical method is most suitable for the investigation of the pdf. However, assumptions need to be made in order to arrive at a solution and sometimes those assumptions can be questioned. The same assumptions may not be needed if a clinical study is used in the investigation. The results of the theoretical analysis need to be verified by future clinical studies. The analytical solution of section 2 gives the pdf of the patient setup uncertainty after correction for a given action level. It can be used in treatment planning protocols that do not use the concept of the setup margin and optimize the treatment plan using the distribution of setup uncertainties. The analytical solution for the probability density function of the setup variation is expressed in terms of the normal distribution function and the normal density function. Numerical approximations to these functions are available. The treatment planning system can potentially vary the action level and optimize the treatment plan against the action level. It may then generate an optimal treatment plan together with an optimal action level as a result of the planning session based on the analytical solution. In section 3, we have used a geometrical metric instead of a dosimetric metric to evaluate the effect of the action level. The analytical results again depend only on the normal density function and the normal distribution function. It can be implemented in a program to provide the optimal action level for specific clinical cases. We have programmed a spreadsheet to graph the error metric as a function of the action level and find it useful in exploring the effect of the changing action level for sample cases encountered in our patient population. The resulted distribution of the setup uncertainty can then be approximated by a normal distribution using the results in section 4. For current clinical practice, the simple rule for the action level is a convenient tool, when it is applicable, to select the appropriate action level with minimal computations that can be done on a calculator. For most cases, σm2 + σp2 < σs2 . The situation is similar to what is shown in figure 2 and the simple rule works well. The comparison in figure 4 indicates that it is advantageous to reduce the uncertainty in measurement for situations when σm2 + σp2 ∼ σs2 . Acknowledgment This work is supported in part by NIH grant P01-CA59827. References Amer A M, Mackay R I, Roberts S A, Hendry J H and Williams P C 2001 The required number of treatment imaging days for an effective off-line correction of systematic errors in conformal radiotherapy of prostate cancer—a radiobiological analysis Radiother. Oncol. 61 143–50 Austin-Seymour M, Kalet I, McDonald J, Kromhout-Schiro S, Jacky J, Hummel S and Unger J 1995 Three dimensional planning target volumes: a model and a software tool Int. J. Radiat. Oncol. Biol. Phys. 33 1073–80 Balter J M, Chen G T, Pelizzari C A, Krishnasamy S, Rubin S and Vijayakumar S 1993 Online repositioning during treatment of the prostate: a study of potential limits and gains Int. J. Radiat. Oncol. Biol. Phys. 27 137–43 Bel A, van Herk M, Bartelink H and Lebesque J V 1993 A verification procedure to improve patient set-up accuracy using portal images Radiother. Oncol. 29 253–60 Bijhold J, Lebesque J V, Hart A A M and Vijlbrief R E 1992 Maximizing setup accuracy using portal images as applied to a conformal boost technique for prostatic cancer Radiother. Oncol. 24 261–71 Birkner M, Yan D, Alber M, Liang J and N¨usslin F 2003 Adapting inverse planning to patient and organ geometrical variation: algorithm and implementation Med. Phys. 30 2822–31
6586
K L Lam et al
Bortfeld T, van Herk M and Jiang S B 2002 When should systematic patient positioning errors in radiotherapy be corrected? Phys. Med. Biol. 47 N297–302 Court L E, Dong L, Lee A K, Cheung R, Bonnen M D, O’Daniel J, Wang H, Mohan R and Kuban D 2005 An automatic CT-guided adaptive radiation therapy technique by online modification of multileaf collimator leaf positions for prostate cancer Int. J. Radiat. Oncol. Biol. Phys. 62 154–63 de Boer H C J and Heijmen B J M 2001 A protocol for the reduction of systematic patient setup errors with minimal portal imaging workload Int. J. Radiat. Oncol. Biol. Phys. 50 1350–65 de Boer H C J, van Os M J H, Jansen P P and Heijmen B J M 2005 Application of the No Action Level (NAL) protocol to correct for prostate motion based on electronic portal imaging of implanted markers Int. J. Radiat. Oncol. Biol. Phys. 61 969–83 de Boer H C J, van Sornsen de Koste J R, Creutzberg C L, Visser A G, Levendag P C and Heijmen B J M 2001 Electronic portal image assisted reduction of systematic set-up errors in head and neck irradiation Radiother. Oncol. 61 299–308 De Neve W, Van den Heuvel F, de Beukeleer M, Coghe M, Thon L, De Roover P, Van Lancker M and Storme G 1992 Routine clinical on-line portal imaging followed by immediate field adjustment using a tele-controlled patient couch Radiother. Oncol. 24 45–54 Enmark M, Korreman S and Nystrom H 2006 IGRT of prostate cancer; is the margin reduction gained from daily IG time-dependent? Acta Oncol. 45 907–14 Gluhchev G 1998 The magnitude of treatment field set-up parameter correction in radiation therapy Radiother. Oncol. 48 79–82 Goitein M 1983 Nonstandard deviations Med. Phys. 10 709–11 Goitein M 1985 Calculation of the uncertainty in the dose delivered during radiation therapy Med. Phys. 12 608–12 Guckenberger M, Meyer J, Vordermark D, Baier K, Wilbert J and Flentje M 2006 Magnitude and clinical relevance of translational and rotational patient setup errors: a cone-beam CT study Int. J. Radiat. Oncol. Biol. Phys. 65 934–42 Hansen E K, Larson D A, Aubin M, Chen J, Descovich M, Gillis A M, Morin O, Xia P and Pouliot J 2006 Imageguided radiotherapy using megavoltage cone-beam computed tomography for treatment of paraspinous tumors in the presence of orthopedic hardware Int. J. Radiat. Oncol. Biol. Phys. 66 323–6 Hoogeman M S, van Herk M, de Bois J and Lebesque J V 2005 Strategies to reduce the systematic error due to tumor and rectum motion in radiotherapy of prostate cancer Radiother. Oncol. 74 177–85 Keller H, Jaffray D A, Rosewall T and White E 2006 Efficient on-line setup correction strategies using plan-intent functions Med. Phys. 33 1388–97 Lauve A D, Siebers J V, Crimaldi A J, Hagan M P and Keall P J 2006 A dynamic compensation strategy to correct patient-positioning errors in conformal prostate radiotherapy Med. Phys. 33 1879–87 Li J G and Xing L 2000 Inverse planning incorporating organ motion Med. Phys. 27 1573–8 Ling C C, Yorke E and Fuks Z 2006 From IMRT to IGRT: frontierland or neverland? Radiother. Oncol. 78 119–22 L¨of J, Lind B K and Brahme A 1995 Optimal radiation beam profiles considering the stochastic process of patient positioning in fractionated radiation therapy Inverse Problems 11 1189–209 L¨of J, Lind B K and Brahme A 1998 An adaptive control algorithm for optimization of intensity modulated radiotherapy considering uncertainties in beam profiles, patient set-up and internal organ motion Phys. Med. Biol. 43 1605–28 Lujan A E, Ten Haken R K, Larsen E W and Balter J M 1999 Quantization of setup uncertainties in 3-D dose calculations Med. Phys. 26 2397–402 McKenzie A L, van Herk M and Mijnheer B 2000 The width of margins in radiotherapy treatment plans Phys. Med. Biol. 45 3331–42 McShan D L, Kessler M L, Vineberg K and Fraass B A 2006 Inverse plan optimization accounting for random geometric uncertainties with a multiple instance geometry approximation (MIGA) Med. Phys. 33 1510–21 Mohan R, Zhang X, Wang H, Kang Y, Wang X, Liu H, Ang K K, Kuban D and Dong L 2005 Use of deformed intensity distributions for on-line modification of image-guided IMRT to account for interfractional anatomic changes Int. J. Radiat. Oncol. Biol. Phys. 61 1258–66 Nuver T T, Hoogeman M S, Remeijer P, van Herk M and Lebesque J V 2007 An adaptive off-line procedure for radiotherapy of prostate cancer Int. J. Radiat. Oncol. Biol. Phys. 67 1559–67 Perkins C L, Fox T, Elder E, Kooby D A, Staley C A III and Landry J 2006 Image-guided radiation therapy (IGRT) in gastrointestinal tumors JOP. J. Pancreas (Online) 7 372–81 Remeijer P, Rasch C, Lebesque J V and van Herk M 2002 Margins for translational and rotational uncertainties: a probability-based approach Int. J. Radiat. Oncol. Biol. Phys. 53 464–74 Song W Y, Wong E, Bauman G S, Battista J J and van Dyk J 2007 Dosimetric evaluation of daily rigid and nonrigid geometric correction strategies during on-line image-guided radiation therapy (IGRT) of prostate cancer Med. Phys. 34 352–65
Daily localization and correction on the setup uncertainty
6587
Unkelbach J and Oelfke U 2004 Inclusion of organ movements in IMRT treatment planning via inverse planning based on probability distributions Phys. Med. Biol. 49 4005–29 Unkelbach J and Oelfke U 2005a Incorporating organ movements in IMRT treatment planning for prostate cancer: minimizing uncertainties in the inverse planning process Med. Phys. 32 2471–83 Unkelbach J and Oelfke U 2005b Incorporating organ movements in inverse planning: assessing dose uncertainties by Bayesian inference Phys. Med. Biol. 50 121–39 van Herk M, Remeijer P and Lebesque J V 2002 Inclusion of geometric uncertainties in treatment plan evaluation Int. J. Radiat. Oncol. Biol. Phys. 52 1407–22 van Herk M, Remeijer P, Rasch C and Lebesque J V 2000 The probability of correct target dosage: dose–population histograms for deriving treatment margins in radiotherapy Int. J. Radiat. Oncol. Biol. Phys. 47 1121–35 Yan D, Wong J W, Gustafson G and Martinez A 1995 A new model for ‘accept or reject’ strategies in off-line and on-line megavoltage treatment evaluation Int. J. Radiat. Oncol. Biol. Phys. 31 943–52