Volume 2 No. 3
ISSN 2079-8407
Journal of Emerging Trends in Computing and Information Sciences ©2010-11 CIS Journal. All rights reserved. http://www.cisjournal.org
Finding Web Log Groups with Geometric Data Analysis Nikos Koutsoupias University of W. Macedonia 3rd Km Florina – Niki, 53100 Florina, GREECE
[email protected]
ABSTRACT Researchers and marketing information specialists consider server based weblog data important grounds for studying web user behavior. This work suggests Geometric Data Analysis methods as tools for the visualization and interpretation of web page access patterns. Web-wide data logs are utilized to discover usage patterns, so to better serve the needs both of internet usage researchers and e-marketing specialists. Keywords: Web Logs, Click-Streams, Clustering, Factor Analysis, Pattern discovery
I. INTRODUCTION Click-stream data analysis applications has been useful to content providers, web hosting companies, ISP’s and researches for various reasons. Information extracted using such tools provide answers to questions relating to user behavior and interests, traffic, bandwidth and web performance [1]. In this context, numerous projects aimed in modeling user behavior and “web ecology” [6, 11, 12] and navigation [8, 9], or included metric-based approaches to disorientation on the web [4], or discuss the implications of web user’s “revisitation” behaviours [5]. Furthermore, prediction tools have been developed [7] along with commercial applications [10] for surfing activity reporting and extensive use of clustering techniques has been involved for pattern recognition [13] in various web-logs and click-streams [2, 3, 14, 15]. The methodologies proposed in this work involves the use both of Factor Analysis as presented in previous papers [16] and Cluster Analysis [28] in the context of click-stream data derived from a publicly available web catalog [17, 26].
II. METHOD AND APPLICATION Factor & Cluster analyses, along with other data analysis methods have been utilized in various fields of data visualization [21, 22, 23, 27]. Like other multidimensional scaling methods [10] Factor Analysis utilizes factorial diagrams (or factor score plots) in order to aid the interpretation of the analyzed phenomenon [18, 19]. The results of the method include, along with the plots, absolute and relative contribution tables [20]. The mere fact that Factor Analysis is not based on a canonical distribution method or any other theoretical distribution, results in the absence of restrictive technical prerequisites, which in the case of classical statistical methods lead in distorted results. The method can be applied in any table of positive numbers driven from a site's navigation pattern logs [16]. Data used in this work originated from page
visits of users who visited msnbc.com, a news portal on September 28, 1999. In this file visits where recorded at the level of URL category and in time order. Specifically, the data is drawn from Internet Information Server (IIS) logs for msnbc.com and news related portions of msn.com for an entire day. As stated from the data originator, each sequence in the dataset corresponds to page views of a user during that twenty-four hour period. Each event in the sequence corresponds to a user's request for a page. Requests are not recorded at the finest level of detail---that is, at the level of URL, but rather, they are recorded at the level of page category (as determined by a site administrator [17]). The categories are shown below, along with their codings (first 2 columns):
Table 1: Categories their coding Code
Category
1 2 3 4 5 6 7 8 9 10 11 12 13 14 15 16 17
Frontpage News Tech Local Opinion on-air Misc Weather Health Living Business Sports Summary bbs Travel msnnews msnsports.
New Code 2 6 10 4 8 7 5 4 3 3 1 9 2 2 3 2 9
New Category FP NW TE LO OP OA MI LO LI LI BU SP NW NW LI NW SP
Page requests served via a caching mechanism were not recorded in the server logs and, hence, not present in the data [17]. 126
Volume 2 No. 3
ISSN 2079-8407
Journal of Emerging Trends in Computing and Information Sciences ©2010-11 CIS Journal. All rights reserved. http://www.cisjournal.org
For the needs of the present work, a subset of the original data is used, sized 20.000 by 100, representing 20.000 records of the first 100 consecutive hits by the same visitor.
Table 2: The first records in the click-stream (category codes- See Table 1) Visitor Count 1 2 3 4 5 6 7 8 9 10 : :
ClickStream 11 2 322422233 5 1 6 11 6 6777668 : :
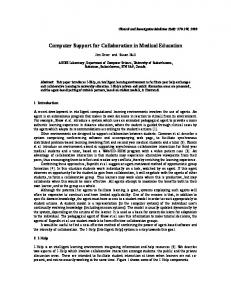
Each category is associated--in order--with an integer starting with "1". For example, "frontpage" is associated with 1, "news" with 2, and "tech" with 3. Each click-stream row describes the hits--in order--of a single user. For example, the first user hits "frontpage" twice, and the second user hits "news" once and so on [17]. For the needs of the current research the file is then preprocessed and transformed into a 12X20000 table where each visitor record Vn has a new category coding (shown in Table 1 – columns 3,4) and the following structure: Vn = {Fn, Ln, BUn, FPn, LIn, LOn, MIn, NWn, OAn, OPn, SPn, TEn} Where: n =1 … 20000, Fn, Ln the categories (see table 1 columns 3,4) of the first and the last visited page of stream n, and BUn, through TEn the visit count of the corresponding page category (see table 1 columns 3,4) visited during stream n. The next step in the pre-processing of the initial file, is a further categorization of the values of each variable into three classes, following the convention that High values (page visit counts) correspond to three or more (up to one hundred not-necessarily consecutive) clicks in the same stream, Medium values correspond to 12 clicks and Low values to no clicks at all. The corresponding upper limits for these classes are the values 0, 2 and 100. Due to the requirements of the method, the analysed table is a cross-tabulation (absolute frequencies) version of the pre-processed click-stream data and has the following form [25]:
Figure 1: The table of absolute frequencies Where: - line ii is the Category Class (i.e. High, Medium, Low) of row I, - column ji is the Category Class of column J, - the crossing of row ii with column ji, frequency value Kij representing the coinciding of Category Class i of row I and j of Column J. The software implementation of AFC97 [24] geometrical data analysis, is then applied on the table in Figure 1. As shown below (five eigenvalues in table 3) in the resulting vector space the first two axes (eigenvectors) interpret about 24% of the total information in the examined data set.
Table 3: The first five eigenvalues
With that in mind, we can use the first two factorial axes for the interpretation of the method's results. The first axis separates extreme (High-Low) values while the second axis in the analysis deals with the average. When these axes are combined into one (factorial) plane, the analyst can draw useful conclusions just by looking at possible trend formations and groupings in the plotted data points. 127
Volume 2 No. 3
ISSN 2079-8407
Journal of Emerging Trends in Computing and Information Sciences ©2010-11 CIS Journal. All rights reserved. http://www.cisjournal.org
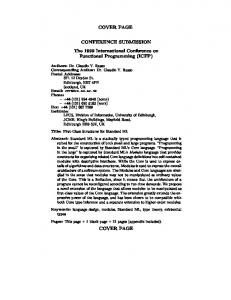
Each point on the plane (Figure 2) corresponds to a Category (for the first two columns) or a High, Mid or Low Value of a Category count (for the next ten columns). In this way, both row and column points are depicted in a concise manner on 2-dismesional space, allowing for quick estimation of general access patterns in the data. In the first factorial plane the In/Out Categories and Category Counts are shown below (Figure 2). Of course, before plotting, we selected only points that provide strong contribution to the axis formation, thus the small number of points depicted.
(minimum values). In this work the respective COR/CTR limits where set to a minimum value of 100. Generally, the methodology aided in locating which groups prevail, what are the possible related groups and what happens most commonly during the entry and the exit visits of msnbc portal users. Also, the method provides the means for more detail and more subtle patterns, such as entry and exit page visits of different categories or coexistence of extreme category counts (High/Low) inside similar groupings. This can be achieved with the use of lower minimum values of COR/CTR during the application of the method on the same data-set. Furthermore, Cluster Analysis can be utilized for the validation of the results above in terms of group formation.
III. CONCLUDING REMARKS
Figure 2: The first Factorial Plane Three distinct patterns emerge from the graph, grouped and named accordingly. The first group, GROUP_A, is more than evident that relates strongly to visitors of the “LOcal-news” (LO) category of the msnbc.com news-portal. Here, all attributes that refer to this category are present, starting from InLO to OutLO, the entry and exit page visits respectively. In between, LO2 and LO100, denoting few or many clicks on the LOcal-news links are also “strongly” present. The second clearly visible pattern is composed of two categories and their corresponding “presence” attributes. GROUP_B on the right (figure 2), incorporates news-oriented visits (news – NW and front page -FP), since these categories are plotted with all of their possible “positive” attributes: InNW, OutNW, NW2, NW100 for the NeWs and InFP, OutFP, FP2 and FP100 of the FrontPages categories respectively. The third pattern trend (GROUP_C) on the first factorial plane appears to depict users searching that day’s TV-Guide (“On-Air” category). Again, all possible nonzero attribute values are present: InOA, OutOA, OA2 and OA100, varying from the first page to the last visited page. The method provides the means for a definition of the level of importance of contribution (COR) and quality of representation (CTR) of categories and their counts, for all factorial axes. For the needs of this paper, we choose the desirable (minimum) values of the above COR/CTR indices and so the factorial axes are reproduced carrying only the category and count points that satisfy the criteria
Factor Analysis with the aid of Cluster Analysis, as presented in this work, are tools for enhanced reading and comprehension of the patterns existing in web clickstream data. They can be applied on any structured stream data set and, we believe, can boost the pattern visualization process, aiding web administrators to receive a total view of what are the main access trends and user traces for their site. In addition, when applying these geometrical analysis methods, researchers and marketers that seek more detailed feedback, are able to define pattern recognition criteria for both axes and plane points. In this way, the method promotes the interpretation process, since the plots include only significant information in the form of points that characterize each factorial axis and/or plane.
REFERENCES [1] L. Qiu, "Mining Web Traces: Workload Characterization, Performance Diagnosis, and Applications", Tutorial Session, Performance 2002, Rome 2002, (Available at http://www.cs.utexas.edu/~lili/talks/tutorialperf2002.ppt). [2] J. Borges and M. Levene, "Data Mining of User Navigation Patterns", Revised Papers from the International Workshop on Web Usage Analysis and User Profiling, pp. 92-111, 1999. [3] I. Cadez, D. Heckerman, C. Meek, P. Smyth and S. White, "Visualization of navigation patterns on a web site using model based clustering", In Proceedings of the sixth ACM SIGKDD International Conference on Knowledge Discovery and Data Mining, pp. 280-284, 2000. [4] M. Otter and H. Johnson., "Lost in hyperspace: metrics and mental models", Interact Comput 13(1), pp. 1-40, 2000.
128
Volume 2 No. 3
ISSN 2079-8407
Journal of Emerging Trends in Computing and Information Sciences ©2010-11 CIS Journal. All rights reserved. http://www.cisjournal.org
[5] A. COCKBURN and B. MCKENZIE, "What do web users do? An empirical analysis of web use", International Journal of Human-Computer Studies 54(6), pp. 903-922, 2001. [6] A. Huberman, P. L. T. Pirolli, J. E. Pitkow and R. M. Lukose., "Strong regularities in world wide web surfing", Science 280(5360), pp. 95-97, 1998. [7] M. H. Blackmon, M. Kitajima and P. G. Polson, "Tool for accurately predicting website navigation problems, non-problems, problem severity, and effectiveness of repairs", Chi Letters, 7: Proceedings of CHI 2005 (ACM Press), pp. 31-41, 2005. [8] M. Kitajima, M.H. Blackmon and P.G. Polson, "Cognitive Architecture for Website Design and Usability Evaluation: Comprehension and Information Scent in Performing by Exploration", Presented at HCI International 2005 (Available at http://www3.nibh.jp/~kitajima/English/PAPERS(E)/H CII2005_CoLiDeS.pdf). [9] C. S. Miller and R. W. Remington, "Modelling information navigation: Implications for information architecture", Human Computer Interaction, 19(3), pp. 225-271, 2004. [10] Alexa, August www.alexa.com).
2004.
(Available
at
[17] D. Heckerman, "The UCI KDD Archive Irvine, CA: University of California", (Available at http:// kdd.ics.uci.edu/databases/msnbc/msnbc.data.html) [18] J.-P. Benzécri, Pratique ed l’ Analyse des Données T.1: Analyse des Correspondances, exposé élémentaire, Dunod, Paris, 1980. [19] J.-P. Benzécri, Analyse des Données, Correspondances, Dunod, Paris, 1973.
T.2:
[20] M. Greenacre, Correspondance Analysis in Practice, Academic Press, London, 1993. [21] M. Gahegan, "Scatterplots and Scenes: Visualization Techniques for Exploratory Spatial Analysis", Comput. Environ and Urban Systems (22)1, pp. 4356, 1998. [22] G. J. Mathews and S. S. Towheed, "NSSDC OMNIWeb: The first space physics WWW-based data browsing and retrieval system", Computer Networks and ISDN Systems (27), pp. 801-808, 1995. [23] D. Leon, A. Podgurski and L. J. White, "Multivariate visualization in observation-based testing", Proceedings 22nd Intl. Conf. on Software Engineering, ACM Press, pp. 116-125, 2000.
http://
[11] P. Pirolli, W. Fu, R. Reeder and S. K. Card, Presented at Advanced Visual Interfaces, AVI 2002, (Available at http:// act-r.psy.cmu.edu /papers/491/new_pirollifu-avi-us.pdf). [12] P. Pirolli and W. Fu, "SNIF-ACT: A Model of Information Foraging on the World Wide Web", in Proc. User Modeling, pp.45-54, 2003. [13] O. Hasegawa, Special Issue on Pattern Recognition, Journal of Advanced Computational Intelligence and Intelligent Informatics (8)2, pp. 83-83, 2004. [14] I-H. Ting, L. Clark and C. Kimble, "Identifying web navigation behaviour and patterns automatically from clickstream data", Int. J. of Web Engineering and Technology (5)4, pp. 398-426, 2009. [15] A. Banerjee and J. Ghosh, "Clickstream clustering using weighted longest common subsequences", In Proceedings of the Workshop on Web Mining, SIAM Conference on Data Mining, pp. 33-40, 2001.
[24] N. Koutsoupias, "AFC97: A New Software Implementation for Correspondence Analysis", Signal Processing, Communications and Computer Science, Electrical and Computer Engineering, Mastorakis, N. (ed.), WSEAS , pp. 278-281, 2000. [25] I. Papadimitriou, Data Analysis, Gutenberg, Athens 2007 (in greek). [26] D. Dipa and M. Kiruthika, "Mining Access Patterns Using Clustering", International Journal of Computer Applications 4(11), PP.22–26, August 2010. [27] B. Leventhal, "An introduction to data mining and other techniques for advanced analytics", Journal of Direct, Data and Digital Marketing Practice (12), PP. 137–153, 2010. [28] K. Hanninen, J. Hallikas, M. Pynnonen, "Mobile internet business models in emerging markets", International Journal of Business Environment, (3)4, pp.427-444, 2010.
[16] N. Koutsoupias, "Exploring Web Access Logs With Correspondence Analysis", Proceedings of the 2nd Hellenic Conference on Artificial Intelligence (SETN02), Hellenic Association on Artificial Intelligence (EETN), pp. 229-236, 2002. 129