DAPA: Diagnosing Application Performance Anomalies for Virtualized Infrastructures Hui Kang Stony Brook University
[email protected]
Xiaoyun Zhu VMware, Inc
[email protected]
Abstract
Jennifer L. Wong Stony Brook University
[email protected]
Prior research has used inference-based techniques [1, 4, 6, 3, 10] or machine learning algorithms [7] to identify dependencies among system components and localize likely causes of faults and performance anomalies in traditional data centers and networks. However, the majority of existing methods are designed in the absence of virtualization, and hence do not utilize or account for the following characteristics of a virtualized infrastructure: (1) Application SLA violations can occur due to resource interference or contention between VMs colocated on the same physical host, a phenomenon nonexistent on traditional, dedicated infrastructure. (2) Finegrained, system-level performance counters are readily available on most virtualization platforms, requiring no customized instrumentation. (3) VMs can be migrated from one host to another, causing the same application to depend on different hardware components over time. (4) The dependency between the VMs and their hosts may lead to strong correlation between some performance metrics. This needs to be dealt with explicitly to avoid inaccurate results and wasted computation.
As cloud service providers leverage server virtualization to host applications in virtual machines (VMs), they must ensure proper allocation of resource capacities in order to satisfy the contracted service level agreements (SLAs) with the application owners. However, the ever-growing number of virtual and physical machines within such infrastructure creates greater challenges in quickly and effectively localizing the system bottlenecks that lead to SLA violations. This paper describes DAPA, a new performance diagnostic framework to help system administrators analyze application performance anomalies and identify potential causes of SLA violations. DAPA incorporates several customized statistical techniques to capture the quantitative relationship between the application performance and virtualized system metrics. We have built a prototype implementation of DAPA on a cluster of virtualized systems to diagnose a set of SLA violations for an enterprise application. Preliminary evaluation results show that DAPA is able to localize the most suspicious attributes of the virtual machines and physical hosts that are related to the SLA violations.
In this work, we present a new online Diagnostic And Performance Analysis tool (DAPA) to assist cloud system administrators in managing and diagnosing application performance on virtualized infrastructures. Figure 1 illustrates the system architecture of DAPA and its representative workflow. For example, the cloud user deploys a multi-tier web application onto the cloud provider’s virtualized infrastructure. The monitoring component of DAPA continuously collects both application and system metrics and monitors the key performance metrics as indicated by the SLA (1). The state of the SLA is also being monitored by the cloud user. When a potential SLA violation is detected, the SLA monitor sends an alarm to DAPA’s analysis engine (2). The modeling component of the analysis engine then starts building correlation models that relate application performance to observed system metrics, and the diagnosis component uses these models to produce the most suspicious system at-
1 Introduction An increasing number of businesses and organizations are deploying their business critical applications and consumer services into virtualized cloud infrastructures. In return, the cloud service providers must manage and ensure all hosted customer applications meet their contracted service level agreements (SLAs). When a hosted application experiences an SLA violation due to poor performance, the cloud provider must quickly localize the application or system component(s) causing the observed performance anomaly in order to bring the system back to its normal operation. Common performance diagnosis procedures today heavily rely on the system administrator’s domain knowledge in specific applications/platforms and associated performance best practices, which are labor intensive, error prone, and non-scalable. 1
studied in [10] to localize link failures in IP networks. Another line of work relied on machine learning techniques to model the relationships in distributed systems. For example, a Tree-Augmented Bayesian Network (TAN) model is adopted in [7] to correlate application performance states with system-level measurements, and to identify a subset of system metrics that provide the classification of the performance states. However, the computational complexity of TAN makes it unfit for online analysis in large-scale environments. Similar techniques have been applied to classify the states of hundreds of performance metrics collected in a data center and to create “fingerprints” for observed performance crises using a selected subset of relevant metrics [5]. Our work can allow the creation of similar fingerprints using the suspicious VM- and host-attributes selected. Application performance modeling. There has been a large body of work studying analytical performance models for modern multi-tier applications, for the purposes of resource provisioning, capacity planning, and performance anomaly detection. In [16] a traditional queueing network model is extended to estimate the performance of a multi-tier Internet application. Other work rely on regression-based techniques to estimate parameters in similar performance models [15, 18]. Recent work on developing analytical performance models for virtualized applications aims to build modelbased adaptive resource allocation systems. Typically, such models characterize application-level performance, e.g., throughput or response time, as a function of system-level and workload-level parameters, such as resource utilization and transaction rate. Model structure and parameter values are inferred from measurement data using statistical learning techniques [13, 11, 12]. All of the above performance models have their input parameters pre-determined by human experts. Instead, DAPA employs simple statistical learning techniques to automatically choose a set of important system-level attributes that are likely related to observed performance anomalies. This allows our approach to scale to environments with a much larger number of collected metrics and more complex infrastructures.
Cloud Provider Analysis Engine
Monitoring
Cloud User
Metric Collector
Modeling
Anomalous VM & host attributes
D Diagnosis
Cloud Infrastructure C SLA Monitor
System Administrator
Figure 1: DAPA system architecture and workflow
tributes that are associated with particular VMs and hosts (3). Based upon these outputs, the cloud system administrator determines the cause of the observed SLA violation, and then takes remediation steps, such as changing resource configurations of associated VMs or using VM migrations, to address the performance problem (4)(5). We develop an innovative application of the statistical variable selection algorithm, Least Angle Regression (LARS), in the DAPA framework for the purpose of modeling the relationship between application performance and system metrics. To the best of our knowledge, our approach is the first to adopt LARS for performance management in virtualized cloud environments. Moreover, we design two additional steps to further improve the quality of the model: (1) As relevant metrics from VMs and hosts may correlate with each other and thus jeopardize the accuracy and stability of the LARS results, we introduce a metric pre-processing step in order to mitigate the correlation noise. (2) We exploit the clustering of the models with close similarity in conjunction with model reconciliation to identify the most suspicious attributes related to the SLA violation. We have built a prototype implementation of DAPA and an example of a virtualized platform with a multitier application running in VMs deployed across multiple physical hosts. The preliminary evaluation of DAPA involves case studies of several performance bottlenecks and system anomalies. The experimental results demonstrate that our approach is able to localize the most suspicious attributes of the VMs and the physical hosts that are related to the observed SLA violations.
3 Overview and Challenges The DAPA framework has three main components: metric monitoring, online modeling, and diagnosis. In order to properly identify the system metrics which are contributing to an SLA violation, system metrics for each component are measured from both the application and system level. A sliding window of these measurements is maintained for online evaluation. Then the online modeling and the diagnosis processes of the DAPA framework work collaboratively in order to localize the most likely causes of the detected SLA violation. The application of statistical techniques to modeling
2 Related work Anomaly detection and diagnosis. Prior research has extended classical problem determination techniques to fault detection and diagnosis in distributed systems. These techniques often rely on establishing a dependency model between interacting system components [6, 4, 1, 3]. They either require heavy instrumentation of the middleware [6, 4] or need software agents to record and analyze packet traces on each host [1, 3] to infer dependencies. Similarly, a two-level dependency graph is 2
of system behavior is plagued by several challenges. The most obvious challenge is the sensitivity of the models to variation in the data, or system metrics in this case, and overtuning of the models. A related challenge is determining the proper set of metrics to build the model. Many regression-based methods fail to eliminate highly correlated metrics and therefore create undesired noise. On the other hand, brute force calculation of pairwise correlations among all system metrics is not only time consuming, but often leads to inconsistent results. Secondly, because of the system variation and workload dynamics, it is often required that the models be updated for different periods of time. Recreating models periodically can result in a collection of models being built over time, each only relevant to the workload and system behavior at the time. Clustering of these models into different groups in correspondence with the application’s SLA compliance state is challenging and requires an automated and systematic approach. For example, it may be difficult to find a clean cut between the time periods of SLA compliance and SLA violation, due to a great deal of uncertainty constantly present in a shared virtualized environment. The measurement data any model is based on may exhibit the features of both normal and abnormal states of the system.
Monitoring ng
Diagnosis
Modeling
Figure 2: Workflow of DAPA analysis engine.
lous states. We describe the details of the modeling phase and the diagnosis phase in the next two subsections. 4.1 Modeling To improve the quality of the regression models, we designed two pre-processing steps, model pre-construction and metric pre-selection, so that those highly correlated metrics can be filtered out before a final set of models are constructed. We leverage the strengths of the Least Angle Regression (LARS) technique [8] in this process. Efron [8] proved conceptual and computational similarities between three variations of LARS (i.e., stagewise selection, LAR, and Lasso). We use Lasso in our work, and for the rest of this paper, we use the terms Lasso and LARS interchangeably. Let X1 , X2 , · · · , Xm be the n-dim sample vectors of the m predictor variables and Y be the n-dim sample vector of the response variable. A candidate vector of regression coefficients β = (β1 , β2 , · · · , βm ) produces the pre! = ∑m βi Xi . Lasso chooses β dicted response vector as Y i=1 to minimize the residual sum of squares (RSS) between the measured and the predicted responses, subject to a constraint on the sum of absolute values of the regression coefficients (L1 penalty).
4 DAPA approach To address these challenges, we have developed a modeling and diagnosis workflow (Figure 2) that involves multiple key steps specifically designed to improve the quality of the data and the accuracy of the modeling process. One such step is metric pre-selection to mitigate the “correlation noise” by eliminating those correlated metrics prior to constructing model series. We also use a clustering and reconciliation strategy to identify the best data set representing the SLA violation state, so that it can be used to identify the attributes of the likely causes of the performance anomaly. The monitoring component continuously collects the application performance and system metrics at a fine time granularity (e.g., every 5 seconds). It also monitors the SLA metric and raises an alarm if an SLA violation is detected. We define another condition named potential SLA violation, which is a more stringent requirement than the true SLA requirement, as the trigger to start the modeling phase of the analysis. For example, if an SLA violation occurs when more than 10% of the response times are greater than one second within a specified period, the potential SLA violation condition is met when more than 5% are generated in the specified period. Using these more stringent conditions, the DAPA approach can begin to monitor and model the behavior of the system prior to an actual SLA violation occurring. Therefore, the characteristics of the system (closest to normal operation) can be used to compare with anoma-
! != min ! Y − Y
n
∑
j=1
"
m
y j − ∑ βi X ji i=1
#2
m
, s.t. ∑ |βi |
≤ t.
i=1
The bound t in the above equation affects the resulting coefficients in such a way that a very small t shrinks regression toward 0. As t increases, Lasso ensures that coefficients become non-zero one at a time. Every time an additional coefficient becomes non-zero is referred to as one step. For a given constraint t, only a subset of the predictor variables have non-zero coefficients. Two important features make Lasso suitable for model selection. First, by selecting an appropriate t, the predictor variables with non-zero coefficients in the Lasso 3
model are important factors affecting the response variable, leading to a simple model with good prediction accuracy. Second, for the most significant variables, Lasso retains their presence by reducing the impact (i.e., shrinking their coefficient values less). By doing so, the coefficients of the selected valuable predictor variables can provide accurate predictions of future values. In DAPA, we use the system metrics collected from each VM or host as the predictor variables, X1 , · · · , Xm , and the observed application response time as the response variable, Y. In order to use Lasso for the purpose of model construction and metric selection, we face two main issues. First, we must select an appropriate regression model learned at the kth step of the Lasso regression, where k < m, meaning only a subset of the predictor variables have non-zero coefficients. Second, as we mentioned earlier, some mutually correlated metrics will have negative effects on the model accuracy and therefore need to be eliminated. Given the basic understanding of the Lasso regression, we now describe the two pre-processing steps in modeling. Model pre-construction. We first go through a preliminary model pre-construction step using Lasso, where the inputs to the algorithm are n samples (e.g., n = 240) of the predictor variables and the response variable, collected from a time window before the potential SLA violation occurred. Lasso produces an ordered list of the predictor variables, say, {X1 , X2 , · · · , Xm }, where Xi is the variable whose regression coefficient becomes non-zero at the ith step, and a sequence of C p,i values (a statistic representing risk in including Xi [8]). These are then passed onto the next metric pre-selection phase as inputs. Metric pre-selection. The metric pre-selection algorithm presented in Algorithm 1 takes advantage of the information from the pre-constructed model and the C p,i heuristic to eliminate highly correlated metrics, instead of calculating the correlation for every pair of metrics. First, we check if C p,i is reduced (i.e., C p,i < Cmin ) after adding the metric Xi to the regression model. If so, Xi remains in the metric set X. Otherwise, Xi has undesirable consequences–unstable and inaccurate coefficients, particularly if Xi has some strong collinear relationship with metric(s) already in the set. Thus, we calculate the correlation between Xi and the earlier metrics to determine if they have strong collinearity. If the correlation is higher than corrT hreshold, Xi is then removed from the metric set X. Once a metric is removed, the remaining C p,i values for all remaining metrics are a reflection of the model with this metric included. In Algorithm 1, inc is a counter that keeps track of the number of times C p,i is increased; once inc reaches incT hreshold, the while loop stops. Rather than repeating the Lasso regression each time a metric is removed, we also use a f lag to indicate that correlations between all remaining metrics
Algorithm 1: Metric Pre-Selection X ←− Initial metrics set {X1 ,X2 ,··· ,Xm } ; incT hreshold ←− α (Stop condition); corrT hreshold ←− β ; f lag ←− false ; inc ←− 0; i ←− 1;Cmin = INT MAX; /* first metric */; while inc < incT hreshold do if Cp,i < Cmin then /* Keep this metric in the set, improve model fit and reduces risk */ if f lag == true then for ( j ←− 1; j < i && X j ∈ X; j + +) do if |corr(Xi ,X j )| > corrT hreshold then X ←− X − {Xi } ; else /* metric increases the risk, to be removed */ inc + +; for ( j ←− 1; j < i && X j ∈ X; j + +) do if |corr(Xi ,X j )| > corrT hreshold then X ←− X − {Xi } ; f lag ←− true ; Cmin ←− Cp,i ; i++ ; Remove {Xi+1 ,··· ,Xm } from X ;
must be checked. Note that this extra computation adds minimal overhead to the approach since the outer loop is bounded by incT hreshold. Model series construction. Using the pre-selected metrics, DAPA then constructs a series of models using nonoverlapping time windows prior to the potential SLA violation, each with T measurement samples (e.g., T =120) for a given period of time (e.g., 10 minutes). This model construction phase continues as time goes on. If no real SLA violation occurs two hours after the potential SLA violation is detected, the modeling phase stops and the system moves back to the passive monitoring mode; if however, a true SLA violation is detected within two hours, DAPA continues to build correlation models for at least one more hour, or until SLA violation stops. Then the series of models will be fed into the diagnosis component for further analysis. 4.2 Diagnosis Model clustering. The series of models constructed span across time periods both before and after the SLA violation. Therefore, they may exhibit different characteristics. However, the models from the potential SLA violation phase may demonstrate characteristics of both SLA compliance and SLA violation. In order to improve modeling accuracy, we must correctly classify these models into different categories representing distinct system states. In DAPA, we use the k-means clustering algorithm with k = 2 to classify the models into two clusters, characterizing the SLA compliance and violation states of the 4
Trace file
VMs
…
……
host
…
host
(a) Lasso of original metrics
Figure 3: Testbed architecture for DAPA experimentation.
(b) Lasso after metric pre-selection
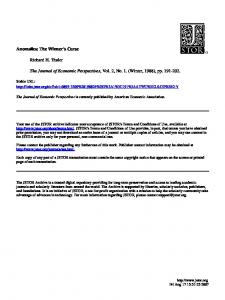
Figure 4: Lasso regression for the disk-busy case. x-axis: ∑mi=1 βi ,
system. More specifically, we represent each model by the vector of regression coefficients, [β1 , β2 , · · · , βm ], and use Euclidean distance as the distance measure. Note that k = 2 is not always the optimal setting. We leave the investigation of optimal k as future work. Model reconciliation The final stage of DAPA involves aggregating all the sample data belonging to the SLA violation cluster, and creating a reconciled LARS model. The top selected metrics from this model are then presented to the system administrator as suspicious system attributes, ordered by significance to the application performance. The higher impact a metric has on the observed performance metric, the earlier it enters the list of selected metrics. Hence, a system administrator can begin diagnosing the application performance anomaly in the order of the system metrics selected.
y-axis: standardized coefficients (βi ). Each line denotes a coefficient.
against the application performance in terms of the response time of a particular transaction type such as tag search of a social event. The response times and system metrics are collected in 5 second intervals. For each synthetic fault injection case, we use 120 data samples to construct one model using Lasso regression, and build a total of 10 models in a 100-minute run. Five of the models are built using data prior to detecting the potential SLA violation and five additional after. Fault injections. In our initial experiments, we inject one single fault at a time into one of the VMs or hosts to induce degraded performance in the storage, memory, or CPU resources, leading to an SLA violation. We inject the following three types of faults: (1) disk- intensive processes to contend the I/O resource within an application tier VM instance, (2) ballooning down the memory allocation of a database tier VM, and (3) creating a CPU-intensive VM to contend the CPU resource with a co-located application tier VM instance. Results of metric pre-selection. Figure 4 shows the Lasso regression steps of the input metrics before and after the metric pre-selection phase for the disk-busy case. Due to the space limit, we omit the regression results of the pre-selection algorithm for the other two faulty cases as they have similar results. Several key observations are presented as follows. First, in Figure 4(a) the coefficients of a subset of metrics grow more rapidly than others and in opposite directions. The cause is that as Lasso has a tendency to push the coefficients to large values as quickly as possible, it increases the coefficients for every pair of highly correlated metrics at the same time, but in opposite directions so they can cancel out. In contrast, the coefficients in Figure 4(b) does not have this property. This shows that our metric pre-selection algorithm helps to eliminate the highly correlated metrics, which makes the model coefficients unstable and sensitive to small data changes. Second, the proposed pre-selection algorithm constrains the coefficients in a small range. Because the pre-selection algorithm filters metrics with strong correlations, the coefficients of the selected metrics have much smaller values than those of the original metrics. (Notice the scales
5 Preliminary Results We now describe our preliminary experience using the DAPA analysis tool to model the application performance and system metrics and to detect the suspicious metrics related to SLA violations caused by three types of synthetic faults injected into the system. Deployment. The benchmark we choose is the Olio social network application due to its popularity in benchmarking virtualized systems such as Cloudstone [14] and VMmark 2.0 [17]. For the sake of scalability, we create more than one instance for each tier of the Olio application and deploy all instances in VMs across three physical machines. Xen 4.0.1 is used as the hypervisor. The deployment is as shown in Figure 3. We drive the Olio application with the trace-driven workloads generated by Faban [9] using the real-world trace from the world cup 98 website [2]. To feed the trace file to Olio, we have to customize the workload file format and scale down the workload intensities. The core of the DAPA tool is the model analysis engine, which we implemented in a separated machine as shown in Figure 3. The analysis engine aggregates 54 metrics collected from within the VMs and from the hosts, as well as those from the SLA monitor. These metrics include the crucial system resources such as CPU utilization, memory usage, disk activities. We use existing monitoring tools (e.g., vmstat, dstat, and virt-top) to collect these data. The SLA is defined 5
$
more, we aim to automate the process of finding the causal relationship between VM instances based upon their functionalities in the hosted application. We leverage a chained network composed of nodes representing individual VM instances. Although there were prior publications on application topology discovery, very few were specifically designed for virtualized systems. The global knowledge combining the modeling results and the network topology of VM instances can enable more comprehensive understanding of performance anomalies than local inferences alone. The incorporation of intelligence in the VM instances is work-in-progress. Finally, we plan to expand our testbed to a larger-scale multitenant environment hosting different applications for further evaluation of the DAPA framework.
# "
!
"
(
$
%
"
$
%
Figure 5: First two metrics selected by DAPA in the disk contention case: wait: CPU I/O wait, bo: block written to disk.
of the y-axis in Figure 4(a) and (b) are different.) Finally, we see that the number of metrics is reduced by around 1/3 from 54 to 32, as the pre-selection algorithm stops when C p,i reaches a relatively small value. We conclude that using the proposed metric preselection algorithm not only improves the model accuracy and stability by filtering highly correlated metrics, but also reduces the number of input metrics to the modeling function, which reduces model construction time. Diagnosis results. In addition to modeling the performance metrics of an SLA violation, we also infer the resource bottleneck that is the root-cause of the problem through the derived models. For each case, we first run the k-means clustering algorithm on the coefficient vectors of the models with k = 2. In the next step, we reconcile the data from the models of SLA violation, run LARS on the aggregated data set, and obtain the ordered metrics based on the regression steps. Figure 5 plots the response time as a function of the first two metrics selected by LARS on the reconciled data for the SLA violation caused by the disk contention case. With some domain knowledge, the system administrator can conclude that the I/O activity of VM1 becomes a resource bottleneck for the application, leading to the SLA violation.
References [1] AGUILERA , M., M OGUL, J., W IENER , J., R EYNOLDS , P., AND M UTHITACHAROEN , A. Performance debugging for distributed systems of black boxes. In SOSP (2003), pp. 74–89. [2] A RLITT, M., AND JIN , T. A workload characterization of study of the 1998 world cup web site. In IEEE Networks (May/June 2000), pp. 30–37. [3] BAHL, P., C HANDRA , R., G REENBERG , A., K ANDULA , S., M ALTZ, D. A., AND Z HANG , M. Towards highly reliable enterprise network services via inference of multi-level dependencies. In Sigcomm (2007), pp. 13–24. [4] BARHAM, P., ISAACS , R., M ORTIER , R., AND NARAYANAN , D. Magpie: Online modeling and performance-aware systems. In HotOS IX (2003), pp. 85 – 90. [5] B ODIK , P., G OLDSZMIDT, M., FOX , A., WOODARD , D. B., AND A N DERSEN , H. Fingerprinting the datacenter: Automated classification of performance crises. In Eurosys (2010), pp. 111–124. [6] C HEN , M., K ICIMAN , E., FRATKIN , E., FOX , A., AND B REWER , E. Pinpoint: Problem determination in large, dynamic internet services. In DSN (2002), pp. 595 – 604. [7] C OHEN , I., C HASE, J. S., G OLDSZMIDT, M., K ELLY, T., AND SYMONS , J. Correlating instrumentation data to system states: a building block for automated diagnosis and control. In OSDI (2004), pp. 231–244. [8] E FRON , B., H ASTIE , T., J OHNSTONE, I., AND T IBSHIRANI , R. Least angle regression. The Annals of Statistics 32 (2004), 407–499. [9] FABAN. Faban harness and benchmark framework. http://java.net/projects/faban/.
6 Conclusion and Future Work We have designed and implemented a practical and effective model-based performance diagnosis framework, DAPA. We argue the importance and necessity of assuring model accuracy in face of metric variations and improving its scalability in a large-scale environment. As part of our approach, we propose several customizations of statistical modeling techniques integrated in the DAPA framework, including a metric pre-selection algorithm and generating ranked system metrics from reconciled models related to performance degradations. Although the preliminary evaluation results are encouraging, we have several ideas to further improve the DAPA framework. One goal is to clearly differentiate causes for performance degradation due to misconfiguration of VMs and due to interference from other VMs sharing the same infrastructures. This can be achieved by incorporating the internal knowledge from various system layers of the virtualization platform into the modeling process (as in a ”gray-box” approach). Further-
[10] KOMPELLA , R. R., YATES , J., G REENBERG , A., AND SNOEREN , A. C. Ip fault localization via risk modeling. In NSDI (2005), pp. 387–390. [11] K UNDU , S., R ANGASWAMI , R., D UTTA , K., AND Z HAO , M. Application performance modeling in a virtualized environment. In HPCA (2010), pp. 1 – 10. [12] NATHUJI , R., K ANSAL, A., AND G HAFFARKHAH , A. Q-clouds: Managing performance interference effects for qos-aware clouds. In Eurosys (2010), pp. 237–250. [13] PADALA , P., H OU , K.-Y., SHIN , K., Z HU , X., AND U YSAL, M. Automated control of multiple virtualized resources. In Eurosys (2009), pp. 13– 26. [14] SOBEL, W., SUBRAMANYAM , S., AND ET. AL. Cloudstone: Multiplatform, multi-language benchmark and measurement tools for web 2.0. In Workshop on Cloud Computing and its Applications (2008). [15] STEWART, C., K ELLY, T., AND Z HANG , A. Exploiting nonstationarity for performance prediction. In Eurosys (2007), pp. 31–44. [16] U RGAONKAR , B., AND ET AL. An analytical model for multi-tier internet services and its applications. SIGMETRICS Perform. Eval. Rev. 33 (June 2005), 291–302. [17] VM WARE. VMmark 2.0. http://blogs.vmware.com/performance/. [18] Z HANG , Q., C HERKASOVA , L., AND SMIRNI , E. A regression-based analytic model for dynamic resource provisioning of multi-tier applications. In ICAC (2007), p. 27.
6