advantages over classical deformable 3D object models. Keywordsâselective data acquisition, elastic behavior, deformable objects, neural networks, growing neural gas. ... used for rendering, meaning that no separate meshing is required.
Proceedings of the 2009 IEEE International Conference on Systems, Man, and Cybernetics San Antonio, TX, USA - October 2009
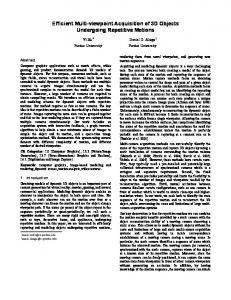
Data Acquisition and Modeling of 3D Deformable Objects using Neural Networks Ana-Maria Cretu, Emil M. Petriu, Pierre Payeur School of Information Technology and Engineering, University of Ottawa Ottawa, Canada Abstract—The goal of the work presented in this paper is to develop a novel scheme for the measurement and representation of deformable objects without a priori knowledge on their shape or material. The proposed solution advantageously combines a neural gas network and feedforward neural network architectures to achieve diversified tasks as required for data collection on one side and the modeling of elastic characteristics on the other side. Data is collected for different objects using a joint sensing strategy that combines tactile probing and range imaging. The innovative object models, built as multi-resolution point-clouds associated with “tactile patches”, present certain advantages over classical deformable 3D object models. Keywords—selective data acquisition, elastic behavior, deformable objects, neural networks, growing neural gas.
I.
INTRODUCTION
Accurate deformable object modeling raises a complex combination of issues ranging from the determination of the equipment to perform measurements, the registration of the measurements and selecting proper methods to model elastic data, to finding means to combine these measurements in composite geometric and elastic models and providing the user with ways to study or interact with the resulting models. In spite of the fact that many papers where published on the topic, the majority of researchers concentrate on real-time simulations. This time constraint implies certain assumptions on the objects under study, such as their linearity or homogeneity in order to simplify the recuperation of elastic parameters, or simply the choice of the elastic parameters is based on some a priori knowledge on the objects’ material. However, such simplifications lead to approximations in the models and the latter cannot be used in applications where accuracy is expected. Moreover, the procedure to collect vision and elastic data is complicated, often resulting in large amount of less relevant data. Appropriate data acquisition procedures should be able to select only points that are representative for the elastic and geometric characteristics, or changes thereof, over an object. From here stems the research interest into viable and easily applicable solutions to selectively measure and accurately model the elastic behavior of real world objects, without any assumptions on their shape or material. The most popular deformable object models are massspring models, the finite-element method, the boundaryelement method, modal analysis, particle systems, implicit models and the mesh-free method [1-7]. All these methods have certain limitations. In spite of being based on well-
978-1-4244-2794-9/09/$25.00 ©2009 IEEE
understood dynamics and being relatively simple to construct, the structure of the mass spring models is often applicationdependent and hard to interpret [1]. The resulting behavior often varies dramatically with different spring configurations [2] and with the values of the spring constants. Moreover, these values are not always easy to estimate or derive from measured material properties. Furthermore, it is difficult to express certain constraints like incompressibility and anisotropy in a natural way: while most of the materials found in nature maintain a constant or quasi-constant volume during deformations, mass-spring models do not have this property [3]. Finite-element method (FEM) obtains more accurate models than mass-spring models, but the high computation time implied remains an obstacle for real-time applications. Because the force vectors, mass and stiffness matrices are computed by integration over the object, they should be reevaluated when the object deforms [1]. As this evaluation is very costly, the assumption that the body undergoes only small deformation is often made and offline pre-computations are used to minimize the intensive computational requirements. Boundary-element method (BEM) handles mixed boundary conditions and can use the same boundary discretization as used for rendering, meaning that no separate meshing is required. However this also means that BEM can handle only a class of materials with homogeneous material properties [4]. Modal analysis restricts the deformable object to fewer degrees of freedom, sacrificing generality for speed. Particle systems are hard to integrate seamlessly into a complex scene [5] and it is harder to achieve exact analytic control over the surface of the modeled objects. Implicit surfaces and volumes are difficult to render efficiently as they require meshing before being rendered. As the representation is multi-valued, it may cause the real zero-contour surface to have multiple sheets, self-interactions and several other undesirable singularities [6]. Their use is thus limited by the difficulty in identifying specific locations on a surface. The creation of a mesh that is prerequisite for FEM or BEM methods is eliminated with mesh-free methods [7]. However, the framework is fairly new and therefore less explored. Most of these methods speed up the simulation by trading off accuracy for speed. They leave the choice for the selection of elastic parameters to the user or choose some values for these parameters according to some a priori knowledge regarding the deformable object model. Overall, there are few papers that employ any sort of measurement to elicit the object’s elastic behavior [8, 9]. In most cases when a measurement is performed, the probing is limited to a single point or a set of samples spread uniformly over the surface of
3483
the object being therefore unsuitable for in the case of piecewise homogeneous objects. The goal of this research is to represent geometric and elastic behavior of real world 3D deformable objects without a priori knowledge on the shape or on the material that the objects are made of. It is a continuation of our work on the topic [8, 9]. In this study, the previously proposed solution for selectively collecting vision and tactile characteristics of objects and the one proposed for the modeling of elastic behavior are joined together in a multi-resolution deformable object model based on “tactile patches”. II.
PROPOSED MODELING SCHEME
The proposed modeling solution is depicted in Fig. 1.
from the tessellation all the edges of triangles that are larger than a set threshold. The subset of nodes extracted from the growing neural gas map drives the rescanning over the regions of interest (ROI) to obtain an extra set of points at higher resolution. The same procedure can be employed for the sampling of elasticity provided that changes in the elastic behavior of the object under study are related to changes in the geometry. However, in order to ensure that the same framework can be used for all types of objects, including those where changes in the elastic behavior are not associated with changes in geometry, an elasticity component is added to the entire or to a part of the vision point-cloud V, in order to obtain the tactile point-cloud T. The elasticity component is the local compliance, computed by comparing deformation profiles collected at each point of interest using the same laser scanner employed for the fast vision scan. Such deformation profiles [8] capture the change of an object surface when different loads are applied with an ATI force-torque sensor. The compliance is introduced as the forth-dimension input parameter in the neural gas network NGt. As for the vision sampling, the resulting map Gt is used for the detection of regions of interest Rt for additional sampling. The sparse vision point-cloud V and the sparse tactile point-cloud T can therefore be selectively densified by the addition of increasingly clearer geometric and elastic features, respectively. If more accurate models are desired, the multiresolution composite object model C is built by augmenting the initial sparse vision model V and the sparse tactile pointcloud T with the points Rv and Rt collected at higher resolution over the regions of interest. If slightly less accurate but more compact models are desired, the selectively densified model can be obtained by augmenting the neural gas map Gv and Gt with the higher resolution data samples collected over Rv and Rt.
Figure 1. Proposed solution for the data acquisition and modeling of deformable objects.
The procedure starts by collecting a sparse (fast) vision scan V of the object under study using a Jupiter laser scanner. The sparse scan serves as input to a neural gas network NGv, whose purpose is to further guide the vision sampling procedure towards the areas that contain relevant information for the geometric model of the object under study. Those regions that require additional sampling in order to ensure an accurate model are detected by finding higher density areas in the neural gas map Gv that approximates the point-cloud. This is done by applying a Delaunay tessellation to the resulting growing neural gas output map and by subsequently removing
The modeling properties of the neural gas network allow at the same time for the determination of clusters of similar geometric and elastic properties. These clusters can be represented as “tactile patches”, Tp. Therefore the object pointcloud can now be seen not only as a multi-resolution pointcloud C, but also as a collection of non-connected tactile patches Tp. Feedforward neural architectures (FFp) are used to capture the elastic behavior of each of these patches. The number of neural architectures employed is equal to the number of patches. The same architecture is used for each patch to capture the complex relationship between an applied force, its magnitude, its angle of application, the point of interaction of the probe with the object, the object pose with respect to measurement equipment and the object’s deformation state on one side, and the object surface deformation on the other side. Due to their continuous output property, any of the networks will be able to provide an estimate of the elastic behavior even in those points where the behavior was not probed, therefore eliminating the need for any interpolation of values that normally occurs in any classical model for deformable objects. Moreover, the use of a neural network modeling scheme avoids the complicated and frequently impossible to solve problem of recuperating explicit elastic parameters, especially for highly nonlinear elastic materials. Third, neural networks provide an accurate and fast
3484
response once they are trained. After the elastic behavior of an object is stored in a neural network, the latter can provide realtime information about the elasticity in any point of an object. Last but not least, the scheme deals easily with piecewise homogeneous materials as well, due to the existence of tactile patches. A. Selective Sampling of Geometric and Elastic Data The framework is meant to guide, during the data acquisition procedure, the automated selection of regions of interest for the geometry and the elastic behavior, in order to obtain a more accurate description of an object under study. Starting from an initial low resolution scan of points on an object, obtained using an active triangulation line-scanning Jupiter laser range finder (V), a neural gas network is employed to model the resulting point-cloud. The detailed description of the experimental setup and of the neural gas algorithm and application procedure is available in [9, 10]. The triangle removal procedure as described in section II is illustrated in Fig. 2. A typical configuration of the nodes in the neural gas map Gv after the adaptation procedure is shown in Fig. 2a. A Delaunay triangulation is first applied over the output map in order to connect the nodes of the neural gas map. The resulting tessellation is depicted in Fig. 2b. It can be observed that two areas of high density of points are identified in the present example, both related to the existence of 3D features (due to the modeling properties of neural gas). These two areas are shown shaded in Fig. 2b. region of 3D features
region of 3D features
a)
c)
b)
d)
e)
Figure 2. Triangle removal procedure.
Such areas of high density of points are represented by small triangles (short edges) in the tessellation. Next, the triangulation is traversed successively and the length of vertices between every pair of points for every triangle is computed. The mean value of all these lengths is estimated and a threshold is set equal to this value. All the vertices longer than the threshold value are then removed from the model. The removal of the edges longer than the threshold ensures the identification of close points and therefore of dense areas. The long edges, marked with red in Fig. 2b, are removed from the tessellation. The result of the removal procedure is shown in Fig. 2c. The remaining vertices together identify the regions where changes in the geometry occur. This
subset of nodes drives the rescanning over the identified regions of interest to obtain an extra set of points at higher resolution, Rv. In the case of tactile sampling, apart from the removal of large triangles, other triangles are also removed for all those cases where the three vertices of a given triangle have the same elastic characteristics, e.g. compliance. In Fig. 2c a possible configuration of nodes after the removal of long edges is shown, with the compliance at each point depicted with different colors. The edges marked in red in Fig. 2d are removed as they connect vertices with the same compliance. Only those triangles that have different elasticity measures for one or two of the vertices are kept, therefore identifying the areas where changes in the geometry and elastic characteristics occur, as shown in Fig. 2e. Rt identifies the regions where additional points should be probed to increase the accuracy of the tactile characteristics of the model. A multi-resolution model is then built by the union of the points in the initial sparse vision model V and in the initial sparse tactile model T (or in the neural gas maps Gv and Gt) with the points Rv and Rt collected at higher resolution over the regions of interest for vision and tactile probing. The union operation ensures that possible overlapping regions identified by both sampling procedures will not be rescanned twice. B. Elastic Behavior Characterization and Modeling In order to ensure that the proposed framework operates without a priori knowledge on the material of the object under study, an evaluation was performed on the collected data to identify means to characterize elastic behavior for materials with different properties and for the different deformation stages of an object. The study led to the conclusion that a simple way to detect if a plastic or elasto-plastic deformation occurs is to compare at first the initial and final deformation profiles [10]. If the initial and final deformation profiles are different (more than a threshold that covers for the noise in the measurements), it means that either a plastic or an elastoplastic behavior occurred. The distinction between the plastic and elasto-plastic behaviors can be made by comparing the final deformation profile with the one resulting from the application of the last force on the object. If the latter pair of profiles is identical within reasonable noise limits, it implies that a plastic deformation occurred. If it is different, the material exhibits elasto-plastic properties or the object is within its elasto-plastic deformation stage. The elastic deformation stage of any object will be characterized in the context of this work by s=0 in the neural network scheme depicted in Fig. 3, the elasto-plastic stage by s=0.5 and the plastic one by s=1.The tagging of data for the different deformation stages or different material states is done during the data collection procedure by continuously monitoring the differences between the initial profile, the final profile and the profile obtained when the last force was applied. The feedforward neural network architecture employed to describe such behaviors at each of the probing points identified by the neural gas-based algorithm is shown in Fig. 3. The network has six input neurons associated with the interaction parameters namely: the magnitude of force (F) and the angle (a) of the applied force, both measured using the ATI
3485
force-torque sensor, the angle denoting the orientation of the laser scanner (p) with respect to the object as defined in Fig. 3, the coordinates of the point (u, v, w) where the force is applied as obtained by the sampling procedure in section A, and the deformation stage (s). A number of 45 neurons (H1-H45) are used in the hidden layer as, by experimentation, this number provided a good compromise between the accuracy of modeling and the length of training [10]. The output vector (Z) is the deformation profile that results for a specific combination of interaction parameters.
each other, are belonging to the same tactile patch. It is important to notice that the grouping of these patches is possible due to the fact that they are similar both from the geometry and the elasticity point of view, as the triangle removal procedure for tactile probing takes into account the geometry as well. Each feedforward neural network is associated with the location of the geometric points that belong to the corresponding tactile patches. According to the point where the interaction occurs, one of the neural networks will be selected to provide the deformation profile of the object under study, based on the specific characteristics of the interaction, e.g. (F, a, p, u, v, w, s). The application point is projected to the closest point from the model and the network that models the elastic behavior of the patch to which this closest point belongs will be selected to provide the elastic behavior. III.
Figure 3. Neural network architecture for elastic behavior modeling.
The network for each tactile patch of an object is trained for 20000 epochs using the resilient propagation algorithm. Raw data as provided by the measurement equipment is used for training, the only preprocessing applied being a normalization of the data contained in the deformation profiles to the [0 1] interval.
EXPERIMENTAL RESULTS
The composite modeling scheme is exemplified and evaluated on a plastic bottle, as shown on the left side of Fig.3. The object is representative as it is a piecewise homogeneous object with two tactile patches. The cap is rigid, while the body is made of plastic and goes through all the deformation stages: from elastic, to elasto-plastic and finally to plastic. A point-cloud of the object is first collected in a raster-like manner using the laser scanner to obtain a geometric model of the bottle, as shown in Fig. 5a.
C. Composite Elastic and Geometric Models In a final step, the data that is selectively collected and the tactile patches (along with their elastic behavior characterized by feedforward neural network architectures as described in section B) are joined together in a composite elastic and geometric model as shown in Fig. 4.
a)
c)
b)
d)
e)
Figure 5. a) Sparse point-cloud of a plastic bottle, b) detected areas for additional vision sampling in the neural gas map, c) neural gas model with compliance information, d) detected area for additional tactile sampling and e) selectively densified model.
Figure 4. Deformable object models as tactile patches.
There is a difference between what one normally understands by a patch and what tactile patches are. While a normal patch is a stand-alone entity connected to neighboring stand-alone entities, the tactile patch can be actually composed of several stand-alone entities throughout the body of an object that exhibit similar geometric and elastic properties but are not necessarily geometrically connected, as depicted in Fig. 4. The points marked in red for example, in spite of not being close to
Fig. 5b shows the areas of interest for vision sampling detected in the bottle point-cloud after the triangle removal procedure. If tactile data is also collected, the neural gas model can be employed to detect areas of interest from the elastic behavior point of view. In this case, the initial sparse point-cloud contains the same geometric points but is enhanced with a fourth dimension of compliance, meaning that
3486
Gt is in this case based on the same geometric points as Gv. The displacement of the surface is first computed by comparing the deformation profiles when no force is acting on the object and after a force acts in a point of an object. The point where the force acts can be determined by computing the difference vector between the two deformation profiles and looking for the largest component of this vector. This largest component can be considered as a measure of displacement at the interaction point. The compliance is then computed as the ratio between the displacement and the force acting on the object that causes the displacement, and its average value is stored for each measured point or tactile patch. Using this compliance, it is easy to build the 4D neural gas map that better reflects the clusters/patches of similar elastic behavior. The resulting map Gt is shown in Fig. 5c with the areas of different compliance marked with different colors. The points identified after the triangle removal procedure for tactile data are shown with red stars and are framed in a rectangle in Fig. 5d. It can be seen that the algorithm identifies the area of the boundary between the cap and the body of the bottle as a region where changes in the elastic behavior occur, as it is expected. It can be observed in this case that the area identified for additional tactile probing has already been partially identified using the geometric model only, since the change in elastic behavior is associated with a change in the geometry around the base of the bottle cap. Additional data is collected for the union of points marked within the dark red rectangles in Fig. 5b and 5d. The compressed selectively densified model can be obtained by augmenting the neural map gas Gv used for vision sampling with this additional data. The resulting model contains in this case 3215 points and is shown in Fig. 5e. Alternatively, a selectively densified model can be obtained by overlapping the higher resolution scanned areas on the initial point-cloud, resulting in a larger, but more accurate 5285 point model.
Figure 6. Measurement data /deformation profiles for bottle cap for different force magnitudes applied in normal direction (a=90ƕ) for different poses.
To model the elastic behavior, data is collected separately for the two tactile patches depicted with red and blue respectively in Fig. 5c. A sample set of collected data for the bottle cap (the tactile patch denoted with red points in Fig. 5c), on the point O is presented in Fig. 6. The bottle cap is made of a rigid plastic material therefore the profiles at different forces are very similar. A neural network as the one in Fig. 3 is
employed to model the collected deformation profiles. The average error reached during training is low, 1.66×10⁻⁵. The network generalizes well, as it can be seen in Fig. 7 that shows a subset of estimated (denoted by circles) and real measurement data (denoted with dots) and a detail of the curves for the bottle cap. The estimated profiles are provided by the neural network in response to an input sequence of interaction parameters that was not used for training. In this example, the network is tested for orientations p of the range finder that were not part of the training set.
Figure 7. Real and estimated data and a detail for the bottle cap.
It can be noticed that the estimated profile for the pose p=80ƕ, shown in magenta is situated on the depth before the one at p=90ƕ shown in blue. As well, the estimated profile at p=125ƕ shown in green, is placed after the measured profile at 120ƕ marked with red dots and closer to it (5ƕ difference) than the one at 80ƕ is from the one at 90ƕ (10ƕ difference), as one would expect. The second cluster/tactile patch is the bottle body, denoted with blue points in Fig. 5c. The error reached for training is 3.5×10⁻⁵. To evaluate the generalization capability, the network is tested with data samples that were not part of the training set. A subset of real and estimated data using the neural network at a position of the laser range scanner with respect to the object, p=90ƕ, is depicted in Fig. 8. It can be seen that the network places correctly the estimates, for all the stages of elastic, elasto-plastic and plastic deformation of the bottle. For example, in the elastic stage, the estimated displacement for a force F=8N, shown with magenta circles is closer to the non-deformed profile shown with blue dots, with a slight indentation around the middle point where the interaction occurs. The interaction in this example occurs in the point A, as defined in Fig. 8. For the point B in Fig. 8, during the elasto-plastic deformation stage, the estimated displacement curve for a force F=25N at a=80ƕ angle (depicted with yellow circles) is turned slightly to the right of the real measurement at angle of 75ƕ and the cavity is slightly deeper and towards the right side of the force of 24N (depicted with red dots). Finally, in the plastic deformation stage, that occurs for forces larger than F=70N, at point A the estimated curve for an applied normal force of 71N, shown with light blue dots is very close to the real measurement, depicted with green dots, of a normal force of 72.8N. In all cases, the network provides correct estimates for data that was not part of the training set.
3487
the cases of particle systems or implicit surfaces. As opposed to any of these models, the proposed solution is able to estimate the elastic behavior for data that was not measured and modeled. Last but not least, the proposed solution also deals naturally with the object’s volume expansion, which few of the classical solutions are able to do. CONCLUSIONS
Figure 8. Real and estimated data for bottle body for p=90ƕ, for different force magnitudes and at different angles on point A and B and a detail of the profiles.
Another interesting aspect to be noticed in Fig. 8 is that the initial non-deformed profile, shown in blue is narrower along the Y axis than some deformed profiles. This phenomenon occurs because of a volume expansion of the object under probing, due to the applied forces. This expansion is well captured in the modeled results. Therefore the proposed method of deformation measurement and modeling using neural networks captures naturally volume expansions due to loading which are a challenge to be modeled using other methods, such as mass-spring models or FEM.
The modeling properties of neural gas allow for an incremental rescanning at higher resolution of different areas of interest over the object under study. Moreover, its clustering properties allow for the determination of clusters of similar geometric and elastic properties. These clusters can be represented as “tactile patches”. Therefore objects can be built as multi-resolution models associated with distinct tactile patches, the behavior of each patch being modeled with a feedforward neural network. The same architecture is specifically employed for each cluster to capture the complex relationship between an applied force, its magnitude, its angle of application and its point of interaction, the position of the sensor with respect to the object and the deformation stage or material state, and the object surface deformation. Each such neural network is associated with the location of the geometric points that belong to the corresponding cluster. The proposed solution brings certain advantages over classical deformable object models. Future study is dedicated to the seamless incorporation of the deformation profiles into the 3D rendered model of an object. REFERENCES
Fig. 9 summarizes the whole modeling case. [1]
Figure 9. Summary of the case study presented.
The proposed solution presents certain advantages over the classical deformable object models. It eliminates all the guesses for tuning the spring constants and their configurations in mass-spring models or the requirements for small deformations imposed by FEM in order to avoid the computation of the integration when the object deforms. It also avoids the complicated models to recuperate the elastic parameters as well all the assumptions on objects’ homogeneity used by BEM. There is no restriction on the degrees of freedom on object as imposed by modal analysis, while the topology of the deformed surface is available unlike
S.F.F. Gibson and B. Mirtich, “A survey of deformable modeling in computer graphics”, Technical report, Mitsubishi Electric Research Laboratory, 1997. [2] Y. Zhuang and J. Canny, “Haptic interaction with global deformations”, Proc. IEEE Int. Conf. Robotics and Automation, vol. 3, pp: 2428 –2433, Apr. 2000. [3] D. Bourguignon and M.P Cani, “Controlling anisotropy in mass-spring systems”, Computer Animation and Simulation, pp. 113-123, 2000. [4] D. L. James and D. K. Pai, “ArtDefo: Accurate real time deformable objects”, Proc. ACM SIGGRAPH, pp. 65-72, 1999. [5] R. Szeliski and D. Tonnesen, “Surface modeling with oriented particle systems”, Proc. ACM SIGGRAPH Computer Graphics, vol. 26, issue 2, pp. 185–194, 1992. [6] G. Yngve and G. Turk, “Creating smooth implicit surfaces from polygonal meshes”, Technical Report GIT-GVU-99-42, Georgia Institute of Technology, 1999. [7] G. R. Liu, Mesh free methods. Moving beyond the finite element method, Boca Raton: CRC Press, USA, 2003. [8] A.-M. Cretu, P. Payeur and E.M. Petriu, “Selective tactile data acquisition on 3D deformable objects for virtualized reality applications”, Proc. IEEE Int. Workshop Computational Intelligence in Virtual Environments, pp.14-19, Nashville, TN, USA, Apr. 2009. [9] A.-M. Cretu, E.M. Petriu and P. Payeur, “Neural network mapping and clustering of elastic behavior from tactile and range imaging for virtualized reality applications”, IEEE Trans. Instr. Meas., vol. 57, no. 9, pp. 1918-1928, 2008. [10] A.-M. Cretu, Experimental data acqusition and modeling of 3D deformable objects using neural networks, Ph.D. Thesis, University of Ottawa, Ottawa, Canada, 2009.
3488