Indian Journal of Pure & Applied Physics Vol. 45, March 2007, pp. 204-209
Data acquisition system using Matlab for deep level transient spectroscopy studies P Narasimha Reddy*, A Ashok Kumar, K Jagadeswara Reddy & S Venkatramana Reddy Microelectronics Division, Department of Physics, Sri Venkateswara University, Tirupati 517 502 Received 24 August 2006; revised 18 December 2006; accepted 19 January 2007 A microcontroller (AT89S8252) based data acquisition system has been developed for acquiring and processing the data from a home built deep level transient spectroscopy (DLTS)system. User friendly menu driven software has been developed in Matlab for selection of different DLTS measurement modes, data acquisition modes, channels (four channels) selection and number of data points on a single transient. It can be operated in two data acquisition modes namely scan mode and continuous mode. The scan mode is used to perform online analysis and continuous mode for offline data analysis. The developed software is also useful to operate the DLTS system in any one of the two operating modes namely boxcar mode or high resolution mode. The versatility of the data acquisition system is that the software developed can be used to obtain I-V characteristics using commercially available source meters. The paper also deals with the different wavelet decomposition methods for DLTS data acquisition and processing. Keywords: Data acquisition system, Matlab, Analog to digital converter, Microcontroller IPC Code: G01J 3/28
1 Introduction Deep Level Transient Spectroscopy (DLTS) has been extensively used and turned out to be an effective spectroscopic method for determining the trap parameters such as activation energy, capture cross-section and concentration1. Many commercially available and home-built data acquisition systems (DAS) have been reported in the literature for different applications2-8. However, their performance has been limited by the resolution of the ADC, the speed of data acquisition, flexibility of the software and the complexity of the external interfaces. Using conventional programming techniques with BASIC, C (Ref.5), the development of data acquisition and control software can be a timeconsuming procedure, and the code subsequently produced can often be inflexible and rather difficult to modify in the light of changing experimental requirements. In this paper, we propose a low cost, easy to operate Microcontroller (µC) based DAS for DLTS measurements. In the normal mode, DAS acquires both the sample temperature and change in junction capacitance at regular intervals. In this DAS, data acquisition and processing being done in assembly language developed for Atmel microcontroller (AT 89S8252) and Matlab software has been used to receive data serially through COM ports and for storing it in files. Further, the data is ______________ *E-mail:
[email protected]
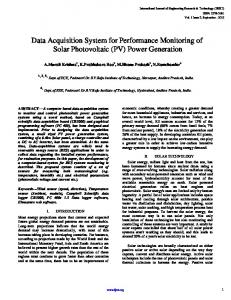
analyzed and plotted in PC to obtain the physical parameters of the deep traps. 2 Hardware The block diagram of the DLTS system is shown in Fig. 1. The system consists of three sub units: (i) Measurement and control system, (ii) Data acquisition system, and (iii) Computer system. 2.1 Measurement and control system
The measurement and control system includes (i) a Boonton capacitance meter, (ii) a cryostat fitted with a heater and a T-type thermocouple with a signal conditioner (2B 50) for measuring the sample temperature, (iii) HP 8112A pulse generator, and (iv) a rate window generator and signal averager. In this technique, to the semiconductor junction which is normally under reverse bias, a pulse of short duration is applied at suitable intervals from HP8112A pulse generator. During the pulse, a forward bias exists on the junction and the charge carriers from both sides of the semiconductor junction occupy the deep levels in the band gap of the semiconductor. Once, the pulse is removed, the charge carriers trapped in the deep levels will be emitted back as the device temperature increases. The resulting transient capacitance of the diode after the pulse is measured with Boonton capacitance meter at selected times (t1 and t2) with respect to the falling edge of the bias pulse. The difference in capacitance
REDDY et al. DATA ACQUISITION SYSTEM
205
Fig. 1 — Block diagram of the DLTS system
at t1 and t2 (c(t1)-c(t2)) is estimated with double boxcar integrator and plotted as a function of sample temperature. The sample temperature is varied and the resulting signal called a DLTS spectrum9 is recorded. Temperature controller has been developed using digital to analog converter (DAC) and programmable power supply. An 8-bit DAC (AD 7524) from analog devices has been interfaced to AT89S8252 through port 2. This DAC has settling time of 250 ns. It can be configured in unipolar or bipolar modes. The output voltages of AD 7524 vary from 0-10V in the unipolar range and ± 10 V in the bipolar range. The output of the DAC is applied to the power supply to control its output current. The hardware part of DAS has been developed using Atmel microcontroller AT 89S8252, a 12-bit ADC (AD574A) and CMOS analog multiplexer (MUX) CD4052. The MUX CD 4052 has been used to select one of the analog inputs10. The MUX is a dual 4-channel analog MUX/Demultiplexer with two TTL compatible select inputs. Depending on the logic levels on channel select inputs, a signal on one of the channels will be selected. It has very fast switching times (around 5 ns), and is capable of handling analog input voltages within ± 10 volts range. In the present work, the inputs to the MUX are: sample temperature, change in junction capacitance signal [c(t1)−c(t2)] from rate window generator and the capacitance transient [c(t)] from capacitance meter. AT89S8252
Fig. 2 — Microcontroller based Data Acquisition System (DAS)
generates the channel select signals. The MUX output is digitized using a 12-bit A/D converter (AD 574A). AD 574A is a successive approximation A/D converter with 3-state output buffers11. Its conversion time is 25µs. It is configured in bipolar mode with an analog input voltage range ±10 V. 2.2 Data acquisition system design using AT89S8252
The AT 89S8252 has 256 bytes of RAM, 8K bytes of Flash Memory, 2K bytes of EEPROM, three 16-bit timers/counters, one programmable serial port (UART), and four parallel I/O ports. It can be operated at 11.059 MHz to generate standard baud rates. Data acquisition system designed using AT89S8252 is shown in Fig. 2. The functions of AT89S8252 are to control the different modes of data
206
INDIAN J PURE & APPL PHYS, VOL 45, MARCH 2007
acquisition and to select one of the two different DLTS measuring modes using reed relays. The two different data acquisition modes are scan mode and continuous mode. In the scan mode, Matlab can develop two way communication with the AT89S8252. Initially, Matlab sends command to the microcontroller through COM ports and then it receives the acquired data from AT89S8252. This mode is useful to view the temperature and capacitance data on the monitor in online. In the continuous mode, Matlab stores the acquired data on the PC memory continuously without any interruption. The process of data acquisition in continuous mode can be terminated by the user at any time by pressing key. Two modes of operation are available in the existing DLTS system. The first mode is selected by setting the reed relay switch (S1) position to 1 with AT89S8252. The first mode involves, obtaining the difference in capacitance (∆C) at two times t1 and t2, acquisition of capacitance from the rate window generator and its storage in the PC. The times t1 and t2 are set on the rate window generator. The second mode can be selected by changing the switch (S1) position to 2. In this method, total capacitance transient C(t) has been sampled and stored on the PC with respect to change in sample temperature. The later method can be used with some algorithms (Fourier, Laplace transforms, method of moments, etc) to estimate the emission time constants of closely spaced energy levels accurately than the rate window method. The sample temperature is measured with a T-type thermocouple. A high performance signal conditioner (2B50 from analog devices) has been used to amplify the low level analog signal from thermocouple in the presence of high common mode voltages. The thermo e.m.f after necessary conditioning is applied to the A/D converter through channel 0 of the MUX. When the start of conversion signal (SOC) is applied to R/ C pin of the A/D converter, the sample temperature at that particular time is sampled and hold during the conversion time. The A/D converter generates an output signal (STS) indicating the status of conversion and is used to interrupt the microcontroller upon completion of conversion. Then the valid 12-bit digital data is acquired through parallel ports of the microcontroller and stored in the internal memory. Similarly the capacitance signal on channel 1 of MUX (CD 4052) is acquired and stored in internal memory. Microcontroller stores the acquired 12-bit data in the
form of two bytes after padding. After acquiring both the sample temperature data and change in capacitance signal data, they are transmitted serially to the PC for further processing. 3 Software 3.1 Programming the AT89S8252
Figure 3 shows the flow diagram of the data acquisition process and transferring the data using serial port. A better resolution of the DAS has been achieved with high resolution ADC compared to DAS reported recently8. The relevant software for system setting and data acquisition has been developed in the assembly language and the code is downloaded into the flash memory of AT89S8252 using a universal programmer. Initially AT89S8252 is programmed to select the DLTS system mode i.e. either boxcar mode or capacitance transient mode by using reed relay switches. Then the multiplexer selects either DLTS signal or sample temperature, depending on the channel select bits from AT89S8252. AT89S8252 initiates data acquisition with issuing SOC to ADC to acquire temperature and polls end of conversion signal (EOC). When EOC is active, AT89S8252 reads converted 12-bit data and stores in its internal RAM temporarily. In a similar way, DLTS signal can also be acquired. The sampled data corresponding to
Fig. 3 — Flow diagram of the Data acquisition sequence
REDDY et al. DATA ACQUISITION SYSTEM
sample temperature and DLTS signal have been transferred serially to the PC COM ports through programmable UART module in AT89S8252. Atmel microcontroller has a built-in UART which contains transmit (TxD) and receive (RxD) pins for transmission as well as reception respectively12. The baud rate is software selectable with the help of timers. In this work, Timer1 is used to set the baud rate. The timer is programmed in mode 2, that is, 8bit, auto-reload mode. The data is sent serially to PC in asynchronous format. The asynchronous format has been selected by programming the bits in SCON register of the microcontroller. The baud rate is set to 9600 which is compatible to the PC data receiving rate. 3.2 Data acquisition using Matlab
Matlab is a commercially available mathematical software package developed and distributed by the Mathworks, Inc13. Matlab is a powerful software package that allows for plotting in multiple dimensions. Matlab 6.1 and higher support serial communications with the external interfaces. User friendly menu driven program has been written in Matlab software for the selection of DLTS measurement modes, type of acquisition, number of channels, number of data points for a single transient. After selecting the particular mode, control will be transferred from Matlab to the AT89S8252, which controls the external interfaces according to the menu selected by the user. The non-linearity in the thermocouple characteristics has been linearized using Matlab software with polynomial equation of 7th order after storing the sample temperature data in the files. The error in the temperature measurement with this linearization process is about ± 0.01°C. The data has been arranged in the form of a table and plots are drawn in the offline. In one total temperature scan (77K-300K), 6000 samples are obtained. Each sample consists of capacitance data as well as temperature data of 12-bits each. The maximum data rate achieved with this system is 1050 samples/second with 9600 baud rate. This data rate is also sufficient to design high resolution DLTS like Fourier transform DLTS which is reported by Kousuke Ikeda et al.14. The Matlab based serial communication to the external interfaces can also be useful to perform I-V measurements with some commercially available source meters, which does not have any GPIB card and its associated software.
207
3.3 Salient features
(i) The system is low cost, easy to operate and programmable. (ii) User friendly menu driven software has been developed in Matlab for selection of DLTS measurement modes, data acquisition modes, selection of channels (four channels), and number of data points on a single transient. (iii) Real time plotting, online and offline DLTS data analysis is possible with Matlab software but this facility may not be available with some currently existing softwares2. (iv) DLTS operating modes (boxcar or high resolution DLTS) can be selected through the developed software. (v) Different signal processing algorithms (FFT, Wavelet transforms) can be implemented using the data acquisition software. (vi) The developed software uses serial COM ports to communicate with the microcontroller AT89S8252 very efficiently and requires less hardware comparing to other interfaces like GPIB and PCI cards4, 5. (vii) The software developed in Matlab is also applicable to measure I-V characteristics from commercially available source meters. 4 Experimental Results and Discussion The results obtained for a metal doped n-Si semiconductor sample using the DAS is shown in Fig. 4. A major part of DLTS data evaluation is the exponential analysis of capacitance transients. The increasing requirements for resolving closely spaced deep energy levels with similar decay time constants necessitated the development of advanced numerical algorithms for DLTS data analysis. Wavelets are powerful tools in signal processing applications such as noise reduction. A technique called wavelet denoising is useful for this purpose. Before denoising, the capacitance data have been
Fig. 4 — DLTS spectrum
208
INDIAN J PURE & APPL PHYS, VOL 45, MARCH 2007
Fig. 5 — Extrapolation of change in capacitance signal
Fig. 7 — Regression estimate of the change in capacitance signal
decomposition technique and hard thresholding through wavelet toolbox. The plot after denoising the capacitance data through regression estimate is shown in Fig. 7. After comparing the plots, it is evident that regression estimate method reduces the noise much more effectively than the stationary wavelet transform method. This enables to calculate the activation energies of the defect centers or traps more accurately.
Fig. 6 — Stationary Wavelet Transform of the change in capacitance data
extrapolated using the wavelet tool box in the Matlab. The symmetric mode has been used to extend the capacitance data on both sides symmetrically as shown in Fig. 5. After extending the signal, two denoising techniques namely stationary wavelet transform and regression estimate have been used to analyze in order to compare and to find which technique is better suited for DLTS work. The stationary wavelet transform (SWT) averages some slightly different denoised signals. This method is applied to the capacitance data through wavelet tool box15. The decomposition of the signal has been carried out with Haar wavelet technique. Thresholding has been performed with fixed and hard method. The stationary wavelet transform of the denoised data has been plotted with respect to number of points and is shown in Fig. 6. For the comparison, the data for fixed regression technique is applied to capacitance data with Symlet
5 Conclusions The simple and inexpensive DAS is best suited to acquire slowly varying signals. The user-friendly menu driven software offers flexibility not only in selection of various DLTS measuring modes but also in selection of various channels to be monitored online. The hardware is best suited to develop temperature controlling system by implementing different PID algorithms on Matlab. One of the main constraints of the system is operating with low data acquisition rates. It can be improved by using high speed ADCs and high speed microcontrollers with enhanced serial port interface techniques like I2C, SPI. Acknowledgement The authors are thankful to Dr K S R Koteswara Rao, Principal Research Scientist, Department of Physics, Indian Institute of Science, Bangalore for providing the facilities to make the sample. References 1 Lang D V, J Appl Phys, 45 (1974) 3023. 2 Kirkman I W & Buksh P A, Rev Sci Instrum, 63 (1992) 869. 3 Imaino W, Munce C, Yerry M, Mc Donald N & Tran N, Rev Sci Instrum, 62 (1991) 516.
REDDY et al. DATA ACQUISITION SYSTEM
4 Sawhney K J S & Lodha G S, Indian J Pure & Appl Phys, 28 (1990) 664. 5 Charless I Umeagukwu, Walter H Peters, III & John R Dickerson, Rev Sci Instrum, 58 (1987) 2324. 6 Rajagopal Reddy V, Venkatramana Reddy S, Reddy P N & Reddy B P N, Indian J Eng Mater Sci, 5 (1998) 117. 7 Holzlein K, Pensi G, Schulz M, & Stolz P, Rev Sci Instrum, 57 (1986) 1373. 8 Arun Venkatesh K, Shikha Chauhan, Hiranya Bhatta S G & Mathivanan N, J Instrum Soc India, 36 (2006) 1. 9 Schroder D K, Semiconductor Material and Device Characterization, (Wiley, New York), 1990, chap.7.
209
10 Motorola CMOS Logic Data Book, Motorola Series C, p.133. 11 Analog Devices Data Acquisition Data Book, Vol. 1, p.10-55. 12 Jan Axelson, Serial Port Complete (Penram International, India Pvt. Ltd.), 1998, p. 91. 13 Matlab User’s Guide (The MathWorks Inc.,) Version 6.5.1, 2004. 14 Kousuke Ikeda & Hidetoshi Takaoka, Jpn J Appl Phys, 21 (1982) 462. 15 Wavelet Toolbox User’s Guide (The MathWorks Inc.,) Version 2.1, 2001.