Data Collection and Normalization for Building the Scenario-Based Lexical Knowledge Resource of a Text-to-Scene Conversion System Masoud Rouhizadeh1, Margit Bowler2, Richard Sproat3, Bob Coyne4 1,2,3
Center for Spoken Language Understanding, Oregon Health and Science University 4 Department of Computer Science, Columbia University 1
[email protected] 2
[email protected] 3
[email protected] 4
[email protected] Abstract
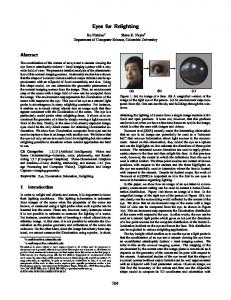
WordsEye is a system for converting from English text into three-dimensional graphical scenes that represent that text. It works by performing syntactic and semantic analyses on the input text, producing a description of the arrangement of objects in a scene. At the core of WordsEye is the Scenario-Based Lexical Knowledge Resource (SBLR), a unified knowledge base and representational system for expressing lexical and real-world knowledge needed to depict scenes from text. This paper explores information collection methods for building the SBLR, using Amazon’s Mechanical Turk (AMT) and manual normalization of raw AMT data. The paper follows with manual review of existing relations in the SBLR and classification of the AMT data into existing and new semantic relations. Since manual annotation is a time-consuming and expensive approach, we also explored the use of automatic normalization of AMT data through logodds and log-likelihood ratios extracted from the English Gigaword corpus, as well as through WordNet similarity measures.
1. Introduction Today, semantic analysis in natural language processing is usually restricted to the identification of predicate-argument structure and semantic role labeling. Recent experiments in textual entailment, however, have shown that such a “surfacy” semantic analysis does not come close to capturing the kinds of meaning humans obtain from natural language text. What is missing is the pragmatic context: when we read that John made a meatloaf, we also know much that was not said, for example, that the event probably occurred in a kitchen, that John performed many specific actions in the process of ‘making’, such as
mixing and shaping, that he used utensils such as a bowl and possibly a spoon, and that he probably used an oven in the final stage. The text-to-scene conversion system WordsEye [1] seeks to bridge the gap between language, graphics, and knowledge by developing new theoretical models and technology to enable the automatic conversion of text into a new type of semantic representation – a virtual 3D scene. 3D scenes provide an intuitive representation of meaning in an extended sense by making explicit the contextual elements implicit in our mental models. The text-to-scene conversion mechanism centers on a new type of lexical knowledge representation, which we call a Scenario-Based Lexical Knowledge Resource (SBLR). The SBLR is a unified knowledge base and representational system for expressing lexical and real-world knowledge needed to depict scenes from text.
2. Prior work Some systems exist for producing 3D graphics from natural language sources including [2], [3], [4] that used language to control animated characters in a closed virtual environment, Put system [5], CarSim [6] and AVis [7] which are domain-specific systems to create animations from natural language descriptions of accident reports, [8] a system for transforming text sourced from popular fiction into corresponding 3D animations without prior language simplification, 3SVD [9] a 3D scene creation system using storybased descriptions, [10] that is an ontology-driven generation of 3D animations for training and maintenance and CONFUCIUS [11] which is a multimodal text-to-animation system that generates animations of virtual humans from single sentences containing an action verb. In these systems the referenced objects, attributes, and actions are typically
relatively small in number or targeted to specific preexisting domains.
3. The WordsEye system and ScenarioBased Lexical Knowledge Resource WordsEye [1] is a system for converting from English text into three-dimensional graphical scenes that represent that text. WordsEye works by performing syntactic and semantic analyses on the input text, producing a description of the arrangement of objects in a scene. An image is then generated from this scene description. Once WordsEye inputs are transformed into semantic representations by identifying entities, their semantic ‘types’, and their relationships, these inputs are disambiguated using the knowledge of semantic classes and relations between entities which is stored in the SBLR.
3.1. The WordsEye system The natural language component in the current incarnation of WordsEye is built in part on several already existing components, including a stochastic part of speech tagger, a statistical parser and the WordNet semantic hierarchy [12]. The parsed sentence is first converted into a dependency representation. Then lexical semantic rules are applied to this dependency representation to derive the components of the scene description. The depiction module of WordsEye interprets the scene description to produce a set of low-level depictors representing poses, spatial relations, color attributes, etc. The resulting depictors are then used (while maintaining constraints) to manipulate the 3D objects that constitute the final, renderable scene. Figure 1 indicates the general architecture of the WordsEye system. The WordsEye system contains a library of 2,000 3D objects and 10,000 textures and a lexicon of approximately 15,000 nouns. It supports languagebased control of spatial relations, textured and colored surfaces, collections and cardinality, and it handles anaphora resolution, allowing for a variety of ways of referring to objects.
One problem that arises in such a system is how to derive the large amount of knowledge that is needed in order to give reasonable depictions. Suppose we say: John was driving to the store. In understanding this sentence and visualizing what it means, a human would probably assume that John was in the driver’s seat of a car, on a road, possibly passing buildings, and so forth. Some of this knowledge is represented in WordsEye as part of the word’s meaning. For example, the depiction phase of WordsEye knows that, given the verb drive, the driver should be using some sort of vehicle, and will select an appropriate vehicle and place the driver in the driver’s seat. But other common-sense knowledge is more tenuously linked: if John is washing his face, he is probably in a bathroom, but need not be: there is nothing in the meaning of wash face that implies a bathroom. This latter type of common sense knowledge is represented within the SBLR.
3.2. The Scenario-Based Lexical Knowledge Resource (SBLR) The SBLR is a unified knowledge base and representational system for expressing lexical and realworld knowledge needed to depict scenes from text. It is used in conjunction with the WordsEye system to semantically interpret input text. The SBLR will ultimately include information on the semantic categories of words; the semantic relations between predicates (verbs, nouns, adjectives, and prepositions) and their arguments; the types of arguments different predicates typically take; additional contextual knowledge about the visual scenes various events and activities occur in; and the relationship between this linguistic information and the 3D objects in our objects library.
3.3. Building the SBLR Alternative methods for building the SBLR have included mining information from external semantic resources such as WordNet, FrameNet, and PropBank,
Figure 1. General architecture of the text-to-scene conversion system
as well as the use of information extraction techniques on other corpora. This paper explores information collection methods using Amazon’s Mechanical Turk (AMT) and manual normalization of raw AMT data. The paper follows with manual review of existing relations in the SBLR and classification of the AMT data into existing and new semantic relations. Then we compare these manual results with automatic normalization of the data through log-odds and loglikelihood ratios extracted from the English Gigaword corpus, as well as through WordNet similarity measures.
4. Data collection from AMT Amazon’s Mechanical Turk is an online marketplace for work. Amazon describes its web service as “artificial artificial intelligence”. AMT provides a way to pay people small amounts of money to perform tasks that are simple for humans but difficult for computers. Examples of these Human Intelligence Tasks (HITs) range from labeling images to moderating blog comments to providing feedback on relevance of results for a search query [13]. The highly accurate, cheap and efficient results of several NLP tasks including word sense disambiguation, word similarity, textual entailment, temporal ordering of events [14] and evaluation of machine translation by AMT [13] have encouraged us to explore using AMT to extract this kind of information.
4.1. AMT tasks and results We collected information about several hundred objects in WordsEye's database, including information about their typical parts, typical location and typical objects around them. We designed three separate tasks for collecting such information about each target object. Each of the three tasks was performed on more than 300 nouns from our object library with 2 assignments per HIT (Human Intelligence Task). In all tasks the Turkers (i.e. workers participating in our Mechanical Turk tasks) had to meet two criteria to work on these HITs: they had to be inside the US and have HIT approval rate greater than or equal to 99%. In the next three paragraphs we briefly review the three tasks: Task 1: Objects around or near the given objects: For this task, we asked the Turkers to name 10 common objects that they might typically find around or near a given object. We also requested that the Turkers not name any items inside the given object. We collected 6850 nearby objects for 342 objects of our 3D library.
Task 2: Typical locations of the objects: For this task, we asked the Turkers to name 10 locations in which they might typically find a given object. We collected 6850 locations of 342 objects. Task 3: Typical parts of the objects: In this task, we asked the Turkers to list 10 parts of a given object. Given that some objects might not consist of 10 parts, (i.e. they are very simple objects), we wanted the worker to name as many parts as possible and then put their reasons for doing so in the comment box. We also we took out the simpler objects from the library. We collected 3500 parts for 245 objects. We collected 17,200 responses from the AMT tasks and paid $106.9 overall for competition of the three tasks. Table 1 below shows a summary of the AMT tasks, payments, and completion time. The data that we collected in this step was in raw format. The next step was normalizing the data; that is, mapping data entered by the Turkers into entities and relations contained within the SBLR. In the next sections we discuss our methodologies for normalizing the raw data. We began by manually normalizing the AMT data and then classifying the data via new and pre-defined semantic relations. Due to the time-consuming nature of the manual annotation task, we also explored the ability to automatically normalize AMT data.
5. Manual normalization of the data Data collected from AMT tasks was manually normalized via removal of uninformative target itemresponse item pairs and definition of the relations between the remaining target item-response item pairs. Response items given in their plural form were lemmatized to the singular form of the word. Definition of the relation between the target item from the SBLR library and the response item provided by AMT workers focused on labeling concrete relationships that could feasibly be graphically depicted via WordsEye.
5.1. Definition of the relations Table1. Summary of AMT tasks, payments and the completion time Task
TW
UI
AA
RPA
EHR ACT
Location
342
6850
2'
$0.05
$1.26
5
Parts
245
3500
1'
$0.07
$2.29
5
Objects
342
6850
2'
$0.05
$1.54
5
TW: # of target words; UI: # of user inputs; AA: Average time per assignment; RPA: Reward per assignment; EHR: Effective Hourly Rate; ACT: Approximate completion time (days)
A total of 34 relations were defined for the complete sets of Mechanical Turk data. Defining relations was completed manually and determined by pragmatic and/or cultural cues about the relationship held between the target item-response item pair. Screening Mechanical Turk workers to confirm that they were from the United States ensured that actions or items which might differ in their typically found location by cultural or geographical context (e.g. eat breakfast) were restricted to the location(s) generally agreed upon by English speakers within the United States. Relation definition focused primarily on defining concrete, graphically depictable relationships. Generic, widely applicable relations were used in the general case for all sets of Mechanical Turk data (e.g. the containment relation containing.r was used for generic instances of containment; the next-to.r relation was used for target item-response item pairs for which the orientation of the items with respect to one another was not a defining characteristic of their relationship). Finer distinctions were made within these generic relations, e.g. habitat.r and residence.r within the overarching containment relation, which specified that the relation held between two items was that of habitat or residence, respectively. More semantically explicit relations were used for target item-response item pairs that tended to occur in more specific relations. Specific relations of this type included those spatial relations from the following target item-response item-relation triples: javelin – dirt – embedded-in.r mobile – ceiling – attached-to.r binoculars – case – true-containing.r Another subsection of relations included functional relations such as those within the following triples: harmonica – hand – human-grip.r earmuffs – head – wearing.r owl – perch – support-for.r Relation labels for meronymic (part-whole) relations were based off of already defined part-whole classifications [15].
5.2. Data and results for each AMT task Target item-response item pairs were usually rejected for misinterpretation of the potentially ambiguous target item (e.g. misinterpreting mobile as a cell phone rather than as a decorative hanging structure, prompting mobile - ear as an object-nearby object pair). Target item-response item pairs were also discarded if the interpretation of the target item, though viable, was not contained within the SBLR library. This was especially prevalent in instances where the target item was a plant or animal (e.g. crawfish) that could be interpreted as either a live plant/animal or as
food. With the exception of mushroom, the SBLR does not contain the edible interpretation of these nouns; in the object-nearby object task, target item-response item pairs such as crawfish - plate were discarded. In the object-location task, the most common relation labels were derivatives of the generic spatial containment relation. The containing.r relation accounted for 38.01% of all labeled target-response pairs; habitat.r accounted for 11.02%, and on-surface.r accounted for 10.6%. In the part-whole task, AMT workers provided responses that were predominantly labeled by partwhole relations. When AMT responses were not relevant for part-whole relations, they tended to fall under the generic containment relation. The objectpart.r relation accounted for 79.12% of all labeled target-response pairs; stuff-object.r accounted for 16.33%, and containing.r accounted for 1.48%. As with the part-whole task, responses in the nearby objects task that were not relevant for the next-to.r relation usually fell under the generic spatial containment relation. In the object-nearby object task, the next-to.r relation was the most frequently utilized relation label, accounting for 75.66% of all targetresponse pairs labeled. The on-surface.r relation was the second most common relation, with 5.69%, and containing.r accounted for 4.44% of all labeled targetresponse pairs.
6. Automatic normalization of the data As stated before manual normalization of the data is a time-consuming and expensive approach. As a result, we are investigating different automatic techniques to normalize the data. We are using current manually annotated data as a gold standard for evaluation of the outcomes of automatic approaches.
6.1. Association measures of sentential cooccurrence One of the ways we normalized our raw data and filtered out the uninformative outputs from AMT was by finding association measure from each target word of our object library and the received outputs of the AMT tasks based on their sentential co-occurrences. To do this, we first counted the number of sentences in which the target word and each AMT output occur separately and the number of sentences in which both words occur together. We then used log-likelihood and log-odds ratio [16], [17], [18] to compute the association measure between the two words. To compute sentential co-occurrences we used the English Gigaword corpus (LDC2007T07); which consists of SGML marked-up articles from the New
York Times, Agence France Press English Service, Associated Press Worldstream English Service, and The Xinhua News Agency English Service, totaling approximately 1 billion words.
6.2. WordNet Similarity measures The next approach for normalizing our raw data was scoring our target words based on WordNet similarities. The first score we computed was WordNet path similarities betwen each target word of our object library and the received outputs of the AMT tasks. We also computed Resnik similarity between the two words, which returns a score denoting how similar the two word senses are, based on the Information Content (IC) of the Least Common Subsumer (most specific ancestor node) [19]. The next score to compute was the average pairwise similarity score based on WordNet path similarity. To illustrate this further, if we assume W1, W2, W3, W4, W5, W6 and W7 as the AMT outputs for target word T and Sij as the WordNet path similarity score between Wi and Wj , then the average pair-wise similarity score for W1 will be S12 + S13 + … + S17, divided by the number of AMT outputs. Our next scores were derived from a bag of words similarity matrix based on WordNet path similarities. We have the following similarity matrix for target word T: W1
W2
W3
W4
W5
W6
W7
W1
1
S12
S13
S14
S15
S16
S17
W2
S21
1
S23
S24
S25
S26
S27
W3
S31
S32
1
S34
S35
S36
S37
W4
S41
S42
S43
1
S45
S46
S47
W5
S51
S52
S53
S54
1
S56
S57
W6
S61
S62
S63
S64
S65
1
S67
W7
S71
S72
S73
S74
S75
S76
1
where Sij is the WordNet path similarity score between Wi and Wj. Each row of the matrix is the similarity vector of the word in its first column. For instance, V1 is the similarity vector of W1 and represented as [S12 , S13 , … , S17]. We use cosine similarity to calculate the similarity measure of two words. For example, similarity measure of W1 and W1 is the cosine of V1 and V2 (CS12) and is computed by this formula: V1 .V2 CS12 = cos(θ) = || V1 || . || V2 || Finally, the WordNet matrix similarity of W1 will be CS12 + CS13 + … + CS17 divided by the number of inputs which is 7 in this example. €
6.3. Evaluation of automatic normalization techniques Data collected from each Mechanical Turk test was classified into both a higher-scoring and lower-scoring set of target item-response item pairs by log-likelihood and log-odds of sentential co-occurrences, WordNet path similarity, Resnik similarity, WordNet average pair-wise similarity and WordNet matrix similarity. The higher-scoring pairs were predicted to be relevant AMT outputs; conversely, the lower-scoring set of target item-response item pairs were predicted to be uninformative AMT outputs. We evaluated the accuracy of each automatic normalization approach by computing the precision and recall against the manually normalized data (table 2). Since collecting data by using AMT is rather cheap and fast, we are more interested to achieve higher precision rather than higher recall. In other word, higher precision means we achieved highly accurate data by our automatic normalization techniques and lower recall means we lose some data, which is not so expensive to collect. As can be seen in table 2, the baseline accuracy of the objects-nearby object task is quite high (precision= 0.8934, recall= 1.0) but we gained the best precision by using WordNet average pair-wise similarity (0.9764) by losing a noticeable part of AMT outputs (recall =0.2659). The high precision in all automatic techniques is due primarily to the fact that the openended nature of the task resulted in a large number of target-response pairs that, while not pertinent to the next-to.r relation, could be labeled by other relations. Again, the open-ended nature of the nearby objects task resulted in the lowest percentage of rejected highscoring pairs (high recall in most of the measures). In the part-whole task, the best precision (0.8935) Table 2: The accuracy of automatic normalization approaches BL
LL
LO WS RS WP WM Objects Nearby Object P 0.8934 0.8947 0.9048 0.9076 0.9085 0.9764 0.8795 1.0 0.8917 1.0 1.0 0.2659 1.0 R 1.0 Parts P 0.7887 0.7832 0.8231 0.7963 0.7974 0.8823 0.8935 1.0 0.2621 0.2367 R 1.0 0.4129 0.4622 1.0 Locations P 0.5527 0.7502 0.7715 0.5462 0.5562 0.6014 0.4782 R 1.0 0.7945 0.6486 0.9649 0.9678 0.3454 1.0 P: Precision; R: Recall; BL: Baseline; LL: Log-likelihood; LO: Log-odds; WS: WordNet Path Similarity; RS: Resnik similarity; WP: WN average pair-wise similarity; WM: WN Matrix Similarity
was achieved by using WordNet matrix similarities but again we lost a noticeable portion of data (recall= 0.2367). Rejected target-response pairs from the higher-scoring part-whole set were often due to responses that named attributes, rather than parts, of the target item (e.g. croissant – flaky). Many responses were too general (e.g. gong – material). Many targetresponse pairs would have fallen under the next-to.r relation rather than any of the meronymic relations. The majority of the approved target-response pairs from the lower-scoring part-whole set were due to obvious, “common sense” responses that would usually be inferred rather than explicitly stated, particularly body parts (e.g. bunny – brain). Within the object-location data set we gained the best precision (0.7715) by using log-odds with rather high recall (0.6486). Target-response pairs that were approved or rejected contrary to automatic predictions were due primarily to the specificity of the response location. Within the higher-scoring set, responses that were too generic (e.g. turntable – store) were rejected. Within the lower-scoring set, extremely specific locations that were unlikely to occur within a corpus or that were not present in WordNet synsets were accepted (e.g. caliper – architect’s briefcase).
7. Conclusions In this paper we investigated the use of information collection methods for building our SBLR, using AMT. Manual evaluation of AMT outputs, which are shown as baseline results in table 2, confirms that we can collect highly accurate data, in a cheap and efficient way by using AMT. Comparison of manually normalized target-response pairs collected from all three AMT tests with the automatic normalization approaches—based on the Gigaword corpus co-occurrences and WordNet similarities—revealed that in order to achieve more accurate data (high precision) we will lose a portion of out AMT outputs (low recall). Although collecting new data is fast and cheap by using AMT, we are planning to optimize our automatic normalization techniques by computing word associations on much larger web corpora such as Google's 1 trillion web corpus (LDC2006T13), query expansion based on WordNet synonyms and hypernyms and using Latent Semantic Analysis to build the word similarity matrices.
References [1] Coyne, Bob and Sproat, Richard. 2001. WordsEye: An Automatic Text-to-Scene Conversion system, SIGGRAPH 2001, Los Angeles, CA.
[2] Adorni, G., Di Manzo, M., Giunchiglia, F. 1984. Natural language driven image generation. COLING 1984. [3] Simmons, R. 1998. The clowns microworld. Proceedings of TINLAP pp. 17–19. [4] Badler, N., Bindiganavale, R., Bourne, J., Palmer, M., Shi, J., Schule, W. 1998. A parameterized action representation for virtual human agents. Workshop on Embodied Conversational Characters, Lake Tahoe. [5] Clay, S.R., Wilhelms, J. 1996. Put: Language-based interactive manipulation of objects. IEEE Computer Graphics and Applications. [6] Dupuy, S., Egges, A., Legendre, V., Nugues, P. 2001. Generating a 3D simulation of a car accident from a written description in natural language: The carsim system. Proceedings of ACL Workshop on Temporal and Spatial Information Processing. [7] O’Kane, M., Carthy, J. and Bertolotto, M. 2004. Text-toScene Conversion for Accident Visualization. International Conference on Computer Graphics and Interactive Techniques. Los Angeles, California. [8] Glass, K. and Bangay, S. 2008. Automating the creation of 3D animation from annotated fiction text. International Conference on Computer Graphics and Visualization. [9] Zeng, X., Mehdi, Q. and Gough, N. 2005. From visual semantic parameterization to graphic visualization. International Conference on Information Visualization. [10] Parisi, S., Bauch, J., Berssenbrügge, J. and Radkowski R. 2007. Ontology-driven Generation of 3D Animations for Training and Maintenance. 2007 International Conference on Multimedia and Ubiquitous Engineering. [11] Ma, M. 2006. Automatic Conversion of Natural Language to 3D Animation. Ph.D. thesis, University of Ulster. [12] Fellbaum, Christian (editor). 1998. WordNet: An Electronic Lexical Database. MIT Press, Cambridge, MA. [13] Callison-Burch, Chris. 2009. Fast, Cheap, and Creative: Evaluating Translation Quality Using Amazon's Mechanical Turk. In Proceedings of EMNLP. [14] Snow, Rion, O’Connor, Brendan, Jurafsky, Daniel and Ng, Andrew Y. 2008. Cheap and fast - but is it good? Evaluating non-expert annotations for natural language tasks. In Proceedings of EMNLP. [15] Priss, Ute. 1996. Classification of meronymy by methods of relational concept analysis. Online proceedings of the 1996 Midwest Artificial Intelligence Conference, Bloomington, Indiana. [16] Dunning, T. E. 1993. Accurate methods for the statistics of surprise and coincidence. Computational Linguistics, 19(1):61–74. [17] Manning, C. and Schuetze, H. 1999. Foundations of Statistical Natural Language Processing. MIT Press, Cambridge, MA. [18] Sproat, Richard. 2001. Inferring the Environment in a Text-to-Scene Conversion System. First International Conference on Knowledge Capture (K-CAP '01), Victoria, BC, Canada. [19] Resnik, Philip. 1999. Semantic Similarity in a Taxonomy: An Information-Based Measure and its Application to Problems of Ambiguity in Natural Language. Journal of Artificial Intelligence Research.