We build a prototype .... panded without having to build a whole dataset from scratch. .... Unfortunately this web server is not the best analogy to the individual.
Synthetic Data Generation and Defense in Depth Measurement of Web Applications? Nathaniel Boggs, Hang Zhao, Senyao Du, Salvatore J. Stolfo Columbia University, New York, NY {boggs, zhao, du, sal}@cs.columbia.edu
Abstract. Measuring security controls across multiple layers of defense requires realistic data sets and repeatable experiments. However, data sets that are collected from real users often cannot be freely exchanged due to privacy and regulatory concerns. Synthetic datasets, which can be shared, have in the past had critical flaws or at best been one time collections of data focusing on a single layer or type of data. We present a framework for generating synthetic datasets with normal and attack data for web applications across multiple layers simultaneously. The framework is modular and designed for data to be easily recreated in order to vary parameters and allow for inline testing. We build a prototype data generator using the framework to generate nine datasets with data logged on four layers: network, file accesses, system calls, and database simultaneously. We then test nineteen security controls spanning all four layers to determine their sensitivity to dataset changes, compare performance even across layers, compare synthetic data to real production data, and calculate combined defense in depth performance of sets of controls.
Keywords: Metrics, Defense in Depth, Web Application Attacks, Measuring Security
1
Introduction
To develop a science of security, at a minimum researchers need a convenient means to run repeatedable scientific experiments. To design a defense in depth security architecture, system security enginners benefit from a useful workbench to compare and place different security controls. In this work, we use security control as a broad label to include anything that hinders an attacker, including ?
This work is sponsored in part by Air Force Office of Scientific Research (AFOSR) grant FA9550-12-1-0162 “Designing for Measurable Security” and DARPA grant FA8650-11-C-7190 “Mission-oriented Resilient Clouds.” The views and conclusions contained herein are those of the authors and should not be interpreted as necessarily representing the official policies or endorsements, either expressed or implied, of AFOSR or DARPA.
any security product, network, host, or database sensor, as well as more emphemerial controls such as user security training or corporate policies. Both goals require tools to mearure security properties. Measuring and comparing effectiveness of security controls is a difficult task the security research community faces. Researchers usually want to repeat other experiments, so they can compute on the same dataset and verify the accuracy of the analysis to ensure that security controls are compared fairly. For experiments to be repeatable, datasets and algorithms used must be made available to others. However, legal, privacy and logistic issues often prevent data sharing. The present solution is to acquire as many security controls as possible locally, so one could test them against datasets she has access to in order to measure and compare their effectiveness. Since no single dataset could contain all the security problems to be assessed, as we learn from now famous TLS Bug1 , this approach at best provides only a partial view into the effectiveness of these security controls. In order to gain a fuller picture of these security controls, we need quality shareable datasets. Unfortunately, anonymizing real user data is not a trivial matter[1][2].So we have to look for the alternative–Synthetic Data, data generated through using existing user models. It offers advantages besides being shareable. The forms of these data will be close, if not identical to those from real users. Less realism is traded for more precise control of different parameters, e.g. content length. By adjusting these parameters, we can find exactly what changes each security control is sensitive to. In addition, by controlling when and what attacks are introduced, we have a clear view of ground truth, whereas in real user data, attacks are hard to identify, resulting in additional unknown false negatives. In fact, even in real user data, synthetic attack data is often injected for testing, as labeling the datasets with often sparse attacks is a cumbersome and potentially inaccurate process. In this paper, we propose a modular synthetic dataset generation framework for web applications, and a monitoring infrastructure that is capable of recording data from multiple layers, including TCP packets on the network, database queries, and even host system calls, so that security controls at different layers can be compared to each other. We call this system Wind Tunnel. By limiting the scope of Wind Tunnel to one important attack vector, remote attacks on web applications, we can better model the content and measure security controls designed to defend against it. In order to incorporate more realism in the synthetic dataset, we use publicly available content, such as known usernames, passwords, English text, and images as the fundamental data sources in Wind Tunnel. For a particular web application, we first create use cases and then drive multiple instances of Firefox via Selenium [3] based on these use cases to simulate users. Each dataset has configurable distributions for each parameter and has all the network traffic, system calls, and database queries recorded. For attack data, we write scripts using Metasploit [4], launch the attacks, and execute post-compromise data exfiltration. 1
http://heartbleed.com/
With a modular design and focus on the ease of data generation, one can easily change a parameter or substitute different user content to determine how that change affects all the security controls tested. Collecting data from multiple layers at the same time allows us to compare security controls operating at different layers directly to one another. For instance, we can determine if a web content anomaly detector and a file access sensor each detect the same attack. In later sections, we describe Wind Tunnel and how we use it to generate nine datasets representing three separate web applications, varieties of user content, changes in length parameters, and two different servers. We then test nineteen security controls at four different layers, using the results to discover what changes affect different types of security controls. We illustrate how we can compare security controls from different layers including web content anomaly detectors, database sensors, file access sensors, and more with this multilayer dataset, as well as perform analysis on how such security controls could be optimized in a defense in depth architecture by showing their overlap. Furthermore, we compare our generated data to that of a production web server dataset and another synthetic dataset published previously [5]. The remainder of the paper is layed out as follows. In Section 2, we describe our board approach. Section 3 details our implementation. All results are presented in Section 4. In Section 5, we discuss related work. Finally, we remark on future goals and conclusions in Sections 6 and 7.
2
Data Generator Framework
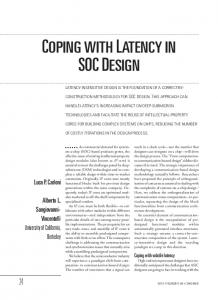
The goals of Wind Tunnel is to generate realistic synthetic data across multiple layers in a modular, repeatable, and automated manner. We want the synthetic data to be realistic enough that measurements of security control performance are predictive of at least relative performance of security controls on real production data. We focus on modeling web application content rather than network connection information, source reputation, volumetrics, or fine grain timing. In the future, with the modular nature of Wind Tunnel, we can integrate more sophisticated models of user behavior. By generating multiple layers of data, we can test security controls that protect against a particular attack vector regardless of the layer at which they operate. A modular framework allows individual components such as new sources of user content, new web applications, or new attacks to be quickly integrated. Rather than just generating data once, Wind Tunnel is designed to repeatedly create a dataset either for use with inline defenses that cannot be tested against a static dataset or to adjust various parameters in order to explore what effect certain changes have on various security controls. Wind Tunnel consists of seven steps any of which can be reconfigured or expanded without having to build a whole dataset from scratch. A visual overview can be seen in Figure 1. – Set up a web application server – Program use cases with Selenium [3]
– Choose existing or create additional raw content data sets for user submitted content – Create attacks and define permutations – Start recording on server and start clients – Launch attacks – Test security controls against data – Process, analyze and visualize results
Wind Tunnel
Aggregate Reports
Web Anomaly Detectors
System Calls
Metasploit Attacks
File Accesses
Exploits and Evasions
Database Queries
Selenium Client
Web Requests
User Generated Data
Web Server
File Access Sensors
Database Sensors
System Call Sensors
Fig. 1. Wind Tunnel System Overview.
2.1
Normal Traffic Generation
Use cases in Wind Tunnel are Java code that use the Selenium library to drive a Firefox web browser to perform actions on and submit to the chosen web application that simulate a user completing some typical use of the website. These can range from simply visiting the home page to performing a complex series of actions such as logging in, page navigation, filling out and submitting a form, and uploading a file. Similar to using such tools as a testing framework, we want a variety of use cases that cover all the major functionality of the web application, especially vulnerable ones. Anytime a choice has to be made in the course of executing use cases, such as what content and how much or which image to upload, a configurable parameter is provided to the security researcher. Each use case has access to a set of usernames, image files, English text, etc. The use case can be configured to use a particular distribution of content such as using a Zipf distribution when choosing from available usernames or a normal distribution with a specific mean for choosing the number of English sentences to post in a form field. These types of distributions and their parameters can all be reconfigured. For instance, it would be important to know during evaluation
if even minor changes in the average length of blog posts affects the false positive rate of a content-based anomaly detector. We focus on modeling user submitted content as this is where web applications are typically vulnerable. Content anomaly detectors in particular are sensitive to normal data as that is what their models are built on and if that data is unrealistically regular they can have unrealistically high performance. To bring the messiness of real user data to Wind Tunnel, we reuse existing real user data from public sources. To add realism, the data should be as closely related to what the web application is expecting. For instance, any English text could also be used for usernames and password fields, but gathering samples from real world usernames and passwords and using those should add realism as character distributions are likely drastically different from standard English text.
2.2
Launching Attacks
For attack data, we leverage the Metasploit Framework [4] to use existing attacks, evasions, and payloads as well as the ability to add new attacks, evasions, and payloads as needed without having to recreate each piece of an attack chain from scratch. We take a set of attacks, evasions, and post compromise exfiltration actions and generate a Metasploit script for each permutation. Attacks can vary from already known vulnerabilities, induced zero-days where we modify a web application to be vulnerable, to actual zero-day attacks against the web application. Attacks can be chosen from common web application attacks such as SQL injection, file upload attacks, code inclusion, etc. Evasions can include simple encoding schemes, advanced polymorphic code rewrites, padding attacks and others. Post compromise data exfiltration actions can be modeled as well.
2.3
Labeling the Data
After sufficient normal data is sent to the web application server, attacks are all launched in sequence while collecting their start and end times in order to label the data. At the network layer simply launching attacks from distinct IP addresses gives an easy labeling mechanism as in this attack vector we are not modeling source IP address patterns. We take a sliding window approach and treat the system call security controls as a warning system so any alert during an attack time windows counts as a true positive while alerts during only normal traffic count as false positives. File accesses are much rarer events, and since we know what the attacks are scripted to do, compromises are much easier to label. Malicious database queries launched as part of the attacks can be labeled based on timing when launched.
3 3.1
Prototype Implementation Dataset Generation
Web Applications We generate data for three PHP based web applications: Wordpress, Tikiwiki, and Testlink. All of the web applications run PHP 5.3.3, and both the web application version and PHP version were selected intentionally since known vulnerabilities exist in these versions. Wordpress is a widely used platform for running personal websites or blogs. We run Wordpress 3.3 with plugins Buddypress 1.5.4 and Foxypress 0.4.2.1. Buddypress is a plugin for social networking, and Foxypress is an ecommerce plugin. Tikiwiki is an open sourced ‘all in one’ content management system. We use Tikiwiki version 8.3 for these experiments. Testlink version 1.9.3 is a management system for tracking software quality. Data Sources In general, there were five different types of data that the use cases require: text, username, password, images, and files. We use three English text corpora the nonredundant Usenet corpus [6], the Wikipedia corpus from WetburyLab [7] and post data from Stackoverflow [8]. The text data is used to fill in titles, descriptions, posts, among other text data that users send to servers. The benefits of these publicly available data sets is that the text is actual data generated by real users. This has the following implications: 1) Text that is close by tends to be contextual and related 2) the text is representative of user text in online contexts 3) data from a particular site could have different properties. The usernames and passwords that we use during experiments are from a Stack Exchange Data Explorer [9] query for 20 thousand usernames and the Rockyou password leak file containing millions of unencrypted passwords [10]. These two data sets provided actual examples of usernames and passwords that were used historically on public websites, and provide us with representative data of both. Images were used in file uploads and incorporated into the user generated data for many applications. Images were taken from Wiki Commons public domain images [11]. This image source provides us with a freely usable and distributable repository of images. Some applications expect to have text files uploaded as part of a description. In general, we seed these text files with data from Stackoverflow [8]. Steps were taken to ensure that the data used in the files did not overlap with the data that was used in the user submitted text since that could result in duplication of POST data to the server. A variety of use cases composing typical normal user behavior are created. Care is taken to ensure that any function of the application targeted by an exploit in the attack dataset has a corresponding normal use case so that an anomaly detector does not simply detect the attack because user behavior was incorrectly modeled. In the configuration file, each use case had an associated weight. When running a use case, Wind Tunnel chooses one at random with weight of use case . probability sum of all use case weights
Data Volume For each dataset generated we capture enough HTTP requests with user submitted parameters to be able to train the network content anomaly detection sensors, which as described in Section 3.2, require 100,000 such requests to build their models. In order to have sufficient variety of data for testing false positives, we generate data until we have at least 25% more requests with arguments. Many more HTTP requests without user arguments are sent, often three to six times as many, in the synthetic datasets depending on the web application. Each dataset generates full packet content on the order of tens of gigabytes of uncompressed PCAP files, tens of gigabytes of compressed system call logs, and gigabytes of uncompressed SQL query logs. Such data generation takes between ten and twenty-four hours to complete in our laboratory environment. Attack Data For attack exploits, we use four known vulnerabilities and edit the applications to add two additional vulnerabilities. We utilize a corresponding Metasploit module for three of them and build new Metasploit modules for the three that did not already have one. For TikiWiki, we use CVE-2012-0911 which is a vulnerable PHP unserialize() allowing arbitrary code execution. For Testlink, we use OSVDB 85446 [12] an arbitrary file upload vulnerability which is then called to execute arbitrary code. For Wordpress we use two vulnerabilities in the add-ons FoxyPress and BuddyPress. For FoxyPress, we use OSVDB 82652 [13] that is another arbitrary file upload vulnerability leading to arbitrary code execution. In BuddyPress we use CVE-2012-2109 a SQL injection vulnerability that we use to gain arbitrary code execution. For TikiWiki and Testlink, we add an additional SQL injection vulnerability to the login page and exploit it. We provide Metasploit modules for these last three SQL injection exploits. We add two basic evasion techniques to these base exploits, PHP base64 encoding and normal data padding. PHP base64 encoding transform the bulk of the payload code into alphanumeric text to obscure any alerts based on strange characters or naive code patterns. Normal data padding is where we take a sample of normal traffic to the website and extract typical user submitted data to concatenate to the malicious HTTP POST data in order to fool content anomaly detection models using a straightforward mimicry attack. Once the attack establishes a shell connection to the server, we create two scenarios of data exfiltration. Both read the web application database configuration file to obtain the database login credentials. The first simply exfiltrates the user tables with usernames and passwords while the second scenario queries the entire database table by table to represent a more noisy attacker. Metasploit establishes a reverse shell on a separate port for these later attack stages so not all of the attack is exposed to the network security controls operating on HTTP requests. Each attack script is run in its own time window. Real Web Server Data In order to compare the synthetic data to production user data, under institutional review board approval, we acquire network traffic to a department web server for just over six days time. In the period, we collected 156GB of HTTP traffic representing of over 1.5 million HTTP requests. A main
advantage of this data is that we can calculate realistic “in the wild” false positive rates. Unfortunately this web server is not the best analogy to the individual web applications as it runs many web applications on the same server forcing the content anomaly detectors to model them all at once. While significant attack traffic is seen, most (hopefully all) of those attacks fail to compromise the server so only the initial attack request is seen whereas in the synthetic datasets all the attacks consist of multiple requests lasting over the initial compromise and data exfiltration. Labeling Ground Truth For the production data server, which is exposed to the internet, all manner of attack data can be mixed in so establishing ground truth becomes a difficult task. We use the same method as used in prior work [14] to label the attack data as best we can via clustering and manual inspection. Some unknown number of false negatives may certainly be present. For the synthetic data as we have control of the attacks, we are able to better label ground truth. As discussed in Section 2, as different layers will see different aspects of the attacks, we label attack data at the network layer by determining whether it came from the attack machine IP address or not. For determining whether a security control detects an attack we check for any alerts during the attack time period. This is useful as no security control can see all the aspects of the attack at different layers and even without detecting all parts of the attack at a certain layer, by alerting, a security control brings attention to the attack. 3.2
Security Controls
We acquired and installed 19 sensors across the network, file access, system call, and database layers to test against the datasets. All of the sensors in this prototype are run in offline mode testing on the data after it has been collected; however, the sensors are designed for and capable of running in real time. Network Layer We run six content anomaly detection (CAD) sensors operating on user submitted argument strings in HTTP GET and POST requests that they extract from reassembled TCP streams from raw network traffic. For POST requests this is all the content after the HTTP header and for GET requests this is the string following the ? in the URI and is typically made up of attribute value pairs. For instance, in a GET request like GET /index.php?username=alice HTTP/1.1, username=alice is the content modeled by the CAD systems. The six CADs used for network layer detection are Spectrogram [15], Anagram [16], and four models previously developed by Kruegel and Vigna [17] attribute length, attribute existence, attribute character distribution, and attribute tokens. All of these are implemented on top of STAND [18] a data sanitization framework to build sanitized AD models from a sliding windows of 25 submodels built on time slices of content. STAND is configured to use the content normalization developed for Spectrogram [15]. For our synthetic data sets each detection model is computed on 100,000 HTTP requests with user arguments before testing starts.
For the production web server data, we use the calibrator feature of STAND described in [19] that is time aware and ended up building its models on about 3 days worth of data. Database Layer We run six sensors on MySQL queries captured during the data generation process. We implement five content anomaly detection sensors operating on user specified inputs in those queries using a similar approach discussed in related work [20]. For each MySQL query, we extract all user specified inputs and insert them into a list in the order they appeared in the query. Then we replace each occurrence of user input in the original query with an empty placeholder token to generate a query skeleton. Similar to the web layer detection, we use five CADs including Spectrogram, Anagram, and three models from related work [20] attribute length, attribute character distribution, and attribute tokens. For all the attribute-based sensors, models are built separately for each type of query skeleton. Attribute existence sensor is ineffective for MySQL inputs because any given query skeleton pre-defines a list of user specified inputs as well as the relative order of them. Besides the five CAD security controls, we also implement an offline sensor on top of an open source version of GreenSQL [21], a well-known unified solution for detecting database layer intrusions. We use the source code from an open source version (1.3.0) for these experiments. While the methodology to use greensql is to integrate it along with the running database, we have extracted the part that does the rule based pattern matching on the sql commands issued in order to generate alerts. This provides us with a mechanism to compare the efficiency of an open source sensor using the same datasets, on an offline basis. We use the default rule set and compute the anomaly scores based on the number of rules being fired for each MySQL query. File Accesses Layer We implement a anomaly detector that monitors file system calls to detect anomalous accesses based on prior work [22]. We use Auditd [23], the default Linux auditing system, to audit file system accesses, and an unsupervised machine learning system to compute normal models for those accesses. The anomaly detection engine utilizes the Probability Anomaly Detection (PAD) algorithm [24] and trains the normal models on a selected set of features associated with each file access, namely, UID, WD (current working directory), CMD (command being executed), Syscall Number, File Name, and Frequency. PAD calculates first order and second order probability for each of the 6 features giving a total of 36 probability values for each file access entry. An alert score is then computed using a multinomial model with a hierarchical prior based on dirichlet distribution, and log probabilities are used at each step to avoid underflows [22]. System Calls Layer We run six sensors on system calls collected during the data generation process. Due to the negative impact on system performance
when training an extreme large volume of system calls, we carefully select a subset of system calls that are audited by Snare’s audit facility [25, 26] to train the CAD sensors. Those system calls cover the most suspicious activities at the system call level when a large set of intrusions are observed. We therefore implement five content anomaly detectors operating on system call parameter and value pairs, including Spectrogram, Anagram, attribute length, attribute character distribution, and attribute token. Similarly, the attribute existence sensor is omitted as the presence of system call arguments are predefined. For those attribute-based sensors, normal models are built separately for each unique system call. We also experiment with an anomaly detector called Stide on system call sequences that studies the short-range correlations in system calls for each process [27, 28]. The algorithm builds the normal model using short sequences of system calls of length N for each process, and store the model information in a tree structure for efficient access. Thus an intrusion is detected when unseen sequences are observed for that process within certain locality window. In these experiments, we run the detector against the entire set of collected system calls with system call length of 6 and locality window of length 20 [27, 28].
4
Experiments and Results
The goals of our experiments are fourfold. We want to determine the sensitivity of each security control to various dataset changes, compare security control stand alone performance across layers, determine whether performance on synthetic datasets predicts performance on a production dataset, and analyze how total performance of security controls scales when combined together. To this end, we use Wind Tunnel to generate nine synthetic datasets with normal and attack data using various parameters described below in addition to the real user production web server dataset described in Section 3.1. 4.1
Datasets Dataset Name Application Content Length Run wp usenet base Wordpress USENET Normal host machine A wp usenet base2 Wordpress USENET Normal repeated on host A wp usenet base3 Wordpress USENET Normal repeated on host B wp wiki Wordpress Wikipedia Normal host machine A wp stack Wordpress Stackoverflow Normal host machine A wp usenet short Wordpress USENET Halved host machine A wp usenet long Wordpress USENET Doubled host machine A tiki usenet TikiWiki USENET Normal host machine A tk usenet Testlink USENET Normal host machine A Table 1. Comparison of the nine generated datasets.
We experiment with four changes that security controls could be sensitive to in the underlying data. First, we test the natural variance between data
generation with the same configuration both on the same server and then when changing to another host machine. Second, we look at the effect of content source by running the same configuration but changing from the USENET corpus [6] to a Wikipedia corpus [7] of English text or forum post data from Stackoverflow [8]. Third, we vary the length of user content inputs by changing the distribution of the length of English text submitted by doubling it for one dataset and halving it for another dataset. Fourth, we generate datasets with three different web applications thus changing all the use cases as well. See Table 1 for a summarized comparison of the datasets. To compare these changes in datasets, we start with a baseline dataset using the Wordpress web application with the USENET corpus of English text. Data sources and use case distribution parameters are described in Section 3.1. In addition to the datasets generated with this prototype, we add two additional web layer only datasets in order to compare results, a private dataset from the Columbia University Computer Science (CUCS) department web server and the publicly available ISCX 2012 Intrusion Detection Dataset [5]. The CUCS web server dataset consists of over 1.5 million HTTP requests, 60 thousand of which contain user argument strings which are processed by the web layer sensors. In manually labeling the resulting alerts, 1257 attack requests are seen. From the ISCX 2012 dataset, we use only the HTTP traffic destined to the web server that is attacked with web application attacks. This leaves us with over 3 million HTTP requests, 18 thousand of which contain user argument strings processed by the web layer sensors. Of these 18 thousand, 77 are labeled malicious constituting various web application attacks. 4.2
Comparison Experiments
With 19 sensors being tested across eleven different datasets, concise summation of data is key. In Table 2, we present the area under the curve (AUC) of each receiver operating characteristic (ROC) curve for each sensor and dataset pair. Note that for the department web server dataset CUCS and the ISCX dataset that only network traffic is available so file access, host, and database sensors are not tested. Note that the low scores for database sensors are in large part due to the fact that for the Wordpress and TikiWiki attacks only one of the two exploits leaves traces in the database layer after the preprocessing normalization. This makes the maximum AUC that a database sensor can achieve for a Wordpress dataset 0.5 and 0.33 for TikiWiki. The TikiWiki SQL exploit does not function without the PHP base64 encoding leaving twice as many instances of the other exploit. The metric AUC gives a good general first impression of the performance of a sensor in terms of its detection rate and false positive rate trade off; however, deeper analysis is often needed to fully understand a sensor’s performance. At first glance, many of the host sensors appear to dramatically outperform everything else. While this is the case in terms of false positive rate, one must remember that the raw count of system calls is high compared to the number of web requests with user parameters or database queries. In practice, this means
tk usenet
tiki usenet
wp usenet base
wp usenet long
wp usenet short
wp usenet base
wp stack
wp wiki
wp usenet base
wp usenet base3
wp usenet base2
wp usenet base
CUCS
ISCX 2012
webAnagram 1.00 0.84 0.98 0.98 0.99 0.98 0.98 0.98 0.98 0.98 0.98 0.98 1.00 1.00 webSpectrogram 0.96 0.98 0.98 0.97 0.98 0.98 0.98 0.98 0.98 0.98 0.98 1.00 1.00 webAttCharDist 1.00 0.76 0.97 0.97 0.97 0.97 0.97 0.94 0.97 0.96 0.96 0.97 0.98 1.00 webAttExistence 1.00 0.76 0.98 0.98 0.99 0.98 0.98 0.98 0.98 0.97 0.98 0.98 0.00 0.60 webAttLength 0.98 0.81 0.32 0.51 0.39 0.32 0.40 0.45 0.32 0.38 0.41 0.32 0.99 0.97 webAttToken 1.00 0.77 0.30 0.39 0.34 0.30 0.53 0.51 0.30 0.50 0.49 0.30 0.82 0.99 mysqlAnagram 0.50 0.50 0.50 0.50 0.50 0.50 0.50 0.50 0.50 0.50 0.33 1.00 mysqlSpectrogram 0.49 0.49 0.50 0.49 0.49 0.50 0.49 0.49 0.49 0.49 0.33 1.00 mysqlAttCharDist 0.50 0.50 0.50 0.50 0.50 0.50 0.50 0.50 0.50 0.50 0.33 1.00 mysqlAttLength 0.48 0.48 0.48 0.48 0.48 0.48 0.48 0.48 0.48 0.48 0.33 0.99 mysqlAttToken 0.50 0.50 0.50 0.50 0.50 0.50 0.50 0.50 0.50 0.50 0.31 0.97 mysqlGreensql 0.50 0.50 0.50 0.50 0.50 0.50 0.50 0.50 0.50 0.50 0.33 0.70 hostAnagram 0.95 0.96 0.94 0.95 0.97 0.96 0.95 0.95 0.97 0.95 0.99 0.97 hostSpectrogram 1.00 1.00 1.00 1.00 1.00 1.00 1.00 1.00 1.00 1.00 1.00 1.00 hostAttCharDist 0.99 0.91 1.00 0.99 0.97 1.00 0.99 0.95 0.91 0.99 1.00 1.00 hostAttLength 0.97 1.00 1.00 0.97 0.96 1.00 0.97 1.00 1.00 0.97 1.00 1.00 hostAttToken 0.84 0.83 0.77 0.84 0.82 0.79 0.84 0.84 0.83 0.84 0.93 0.89 hostFileAccess 1.00 1.00 1.00 1.00 1.00 1.00 1.00 1.00 1.00 1.00 0.99 0.98 hostSyscallSeq 1.00 1.00 1.00 1.00 1.00 1.00 1.00 1.00 1.00 1.00 1.00 1.00 Table 2. Area under the curve (AUC) of the receiver operating characteristic (ROC) curve for each security control and dataset pair.
that even for a false positive rate that rounds off to zero when computing the AUC, the host sensors can still have tens of thousands of individual alerts per dataset. This turns out to be the case here for all host sensors. These high raw counts of alerts may or may not translate to high costs for running the sensors depending on what sort of alert triage approaches are deployed. See Section 4.5 for further discussion of approaches for reducing the costs of false positives. Sensor performance on the real world production dataset differs substantially from the synthetic datasets. Some significant portion of this difference could be due to the nature of the CUCS dataset. The CUCS server hosts many different web applications at once, whereas the synthetic datasets all model one web application. The CUCS dataset has requests for many more different individual pages instead of the handful of specific use cases we see in the synthetic datasets. Further research into different categories of real world web application servers is needed. If this noise turns out to typical, the use cases should be adapted to produce such additional variance. With Wind Tunnel, such modifications can be integrated seamlessly into the data generation process as more data becomes available describing typical usage of web applications.
Experiment with Natural Variation For the first experiment, we generate two separate datasets against the same server with the same configuration. For these baselines we use the USENET corpus as the source of English text and generate traffic against the Wordpress web application. Additionally, we run the same configuration against a separate server running the same Wordpress application. For the most part, AUC scores of the sensors stay fairly stable across these three datasets. The host layer character distribution sensor does fluctuate due to a large amount of normal data scoring just below the scores the sensor gives to the SQL exploit attack variations. For this reason a slight change in attack scores significantly affects the number of false positives thus changing the AUC. Experiment with Varying Content Source To test the sensitivity of sensors to changes in the distribution of English text, we conduct a second experiment reusing the same baseline of the Wordpress application with USENET data compared to the same configuration but with Wikipedia text and StackOverflow text respectively. This change in data source seems to have little overall impact on the sensors. The most apparent effect comes in the web layer character distribution sensor which has a reduction in its AUC for the StackOverflow dataset. Rather than just a small change in attack scores raising false positives, Figure 2 suggests that the general distribution of normal data score differs for the StackOverflow dataset for this sensor. As the sensor models the portion of characters often used and rarely used perhaps the StackOverflow text has higher variance in such text patterns with its often technical forum posts referencing code.
Percentage
Experiment with Varying Con1 0.9 tent Length In the third exper0.8 iment, we vary the content length 0.7 when sending English text data as ti0.6 0.5 tles, paragraphs, posts, etc.. We halve 0.4 the mean of the length distribution for 0.3 short texts and double it to make the 0.2 wp_usenet_base wp_wiki 0.1 long text configuration. Any impact wp_stack 0 this change had if any is within the 0 10 20 30 40 50 60 70 80 90 100 Anomaly Score natural variance between data generation. Only the host layer Anagram Fig. 2. CDF for the scores of normal data sensor increases its AUC from short for web layer attribute character distributo normal to long lengths. It is corre- tion sensor for three web applications. lated only to one other sensor and the only negative correlation increasing AUC from long to short is the host layer attribute token sensor, which only shows change between long and normal. Experiment with Varying Applications Next we generate data against different web applications. We generate datasets for TikiWiki and Testlink in
addition to the Wordpress baseline. As one might expect, changing the web application makes the largest impact on sensor performance out of the variations we show. As noted above, the Testlink attacks all have database level components so the database layer sensors are able to detect all attacks. The largest outlier we see occurs in this experiment in the web layer where the attribute existence sensor scores all the TikiWiki attacks as perfectly normal achieving 0 AUC. This is due to the simplistic nature of the sensor which checks whether it has seen all the variable name attributes in a request before. The TikiWiki exploits both only use attributes that are also used in normal operation so the sensor correctly performs just with a flawed detection mechanism. We also see a large increase in the performance of the web layer length and token sensors compared with their Wordpress performance.
Percentage
0.9 0.8 0.7
wp_usenet_base wp_tiki wp_tk ISCX 2012 CUCS
0.6 0.5 0
10 20 30 40 50 60 70 80 90 100 Anomaly Score
Fig. 3. CDF for the scores of normal data for web layer anagram sensor for three web application, production web server and ISCX dataset.
Detection Rate
1
1 0.9 0.8 0.7 0.6 0.5 0.4 0.3 0.2 0.1 0
wp_usenet_base wp_tiki wp_tk ISCX 2012 CUCS 0
0.1
0.2 0.3 False Positive Rate
0.4
0.5
Fig. 4. ROC curves for web layer anagram sensor for three web applications, production web server and ISCX dataset.
Synthetic and Production Dataset Comparison In order to visualize the differences in datasets, we graph the performance in detail of the web layer Anagram sensor for each separate web application that is the Wordpress, TikiWiki and Testlink datasets, the ISCX 2012 dataset, and the CUCS department web server dataset. In Figure 3, we plot the cumulative distribution of the Anagram anomaly scores for the legitimate data. For any given score (x-axis), the percentage of the normal data that scores at or below that score is given (y-axis). Note that a higher score means that Anagram describes that data as more abnormal with 100 meaning that no ngrams from the data are present in the Anagram model. This graph gives a visual representation of the distribution of the scores of the nonattack data. The CUCS department web server dataset, while sharing the pattern of a large portion of data being completely normal at score zero, has a large spike at score 100 meaning that many legitimate requests are never before seen by the Anagram model. Many of these are short searches with unique enough terms that they score high. Another large component of these score 100 legitimate requests are rarely used application features. With the model sanitization phase of STAND, requests seen only rarely in the training set are discarded to reduce model poisoning from widespread but low volume attacks.
We also plot the receiver operator characteristic (ROC) curve for Anagram across these five datasets in Figure 4. This plots the detection rate against the false positive rate for Anagram run on each dataset. Again the CUCS web server dataset is distinct as with so many legitimate requests receiving a score of 100 the false positive rate is correspondingly high. Additional use cases could be created from this insight to model a server where some features are rarely accessed to the point where sensors have trouble modeling them. More high scoring use cases such as image uploads or short random searches could also be added. Further research into the typical use cases in production datasets from web servers with only a single web application server is needed to determine whether these patterns of high scoring alerts are typical or an artifact of the one production dataset we have. Sensor Performance 1 0.9 0.8 0.7 0.6 0.5 0.4 0.3 0.2 0.1 0
Detection Rate
Detection Rate
4.3
webAnagram webSpectrogram webAttCharDist webAttExistence webAttLength webAttToken 0
0.1 0.2 0.3 0.4 0.5 0.6 0.7 0.8 0.9 False Positive Rate
1
0.05 0.1 0.15 False Positive Rate
Fig. 7. ROC curves for seven host/file access layer sensors for the wordpress baseline dataset.
0.05 False Positive Rate
0.1
Fig. 6. ROC curves for six database layer sensors for the wordpress baseline dataset.
hostAnagram hostSpectrogram hostAttCharDist hostAttLength hostAttToken hostFileAccess hostSyscallSeq 0
mysqlAnagram mysqlSpectrogram mysqlAttCharDist mysqlAttLength mysqlAttToken mysqlGreensql 0
Detection Rate
Detection Rate
Fig. 5. ROC curves for six web layer sensors for the wordpress baseline dataset. 1 0.9 0.8 0.7 0.6 0.5 0.4 0.3 0.2 0.1 0
1 0.9 0.8 0.7 0.6 0.5 0.4 0.3 0.2 0.1 0
0.2
1 0.9 0.8 0.7 0.6 0.5 0.4 0.3 0.2 0.1 0
webAnagram webSpectrogram webAttCharDist WebAttExistence webAttLength webAttToken 0
0.1
0.2 0.3 False Positive Rate
0.4
0.5
Fig. 8. ROC curves for six web layer sensors for the production server dataset.
In addition to Table 2, we present a brief sample of the results visually as ROC curves for the wp usenet base dataset with all 19 sensors tested as well as
the web layer sensors for the CUCS web server in Figures 5, 6, 7, and 8. Note that each graph has different x-axis scales. In Figure 5, the web layer attribute length and attribute token sensors experience a large false positive rate. In Figure 6, we see plainly the effect of one of the Wordpress exploits leaving no trace in the database layer bounding all the sensors at 50% detection rate. The CUCS web server data shown in Figure 8 shows a clear winner in the Spectrogram sensor, which achieves the same detection rate at less than half of the false positive rates of the closest contender. 4.4
Correlation and Overlap Between Sensors
The main advantage of Wind Tunnel is to generate, link, and test data across different layers. Rather than independent evaluation and detection rates, we can identify which sensors detect the same or different attacks regardless of layer. We can also compute a total detection rate for any set of sensors, overlapping detections, and find sensors that add the largest marginal increase in total detection rate to a set of existing sensors. Figure 9 visually illustrates this ability. Each ring or concentric circle presents a particular sensor. Each arc represents an attack, which in this case is a particular exploit possibly Fig. 9. Concentric circles represent each of permuted with various evasion tech- the 19 sensors in the same order as Table 2. niques. Think of the circles as many Each arc represents one attack permutation walls surrounding a castle. Each at- for the Wordpress synthetic data set. Green tack then starts outside the walls and indicates that the attack is detected by the attacks each wall in turn proceeding sensor at a false positive rate of at most 1% directly to the center of the castle. on the wp usenet base dataset. All walls ‘destroyed’ are in red. Those walls that still stand (detecting the attack) are in green. The goal of the defender would be to have walls (sensors) such that no single attack knocks them all down (all red along a single arc), which would mean that each attack is detected by at least one sensor. In this figure, the bottom half shows attacks using the SQL injection exploit with the top half showing attacks using the file upload exploit. At this false positive rate some sensors detect all of the attacks. Also observe how certain sensors detect half and especially that some of those detect a different half than others such that those two sensors each with a 50% detection rate together would detect all the attacks. Access to this type of data instead of only a raw detection rate with little insight into how a set of sensors overlap is important for architecting defense in depth.
4.5
False Positive Analysis
In the experiments, content anomaly detectors perform quite well on user posts containing large amounts of previously unseen English text implying that these anomaly detectors are able to learn English well enough to label new English text as fairly normal. To verify that this is indeed the case, we run a stand alone version of Anagram on the raw English text sources used. The anomaly detector builds a Bloom Filter from a training set using sliding n-grams of the HTTP request (ie, if n = 5, then the first two sliding 5-grams of “abcdef” are “abcde” and “bcdef”). In Wind Tunnel, Anagram running on STAND uses n = 5. We then built a training set of posts to train the anomaly detector, and then tested it on a set of 10000 posts to see how it performed. The results are shown in Figure 10. The graph has the number of posts that the anomaly detector is trained on for the x-axis and the average percentage of new n-grams seen in the test set on the y-axis. Since the anomaly detectors use a threshold on the percentage of new ngrams as its measure of whether or not the request is an anomaly, this tests should accurately predict how the anomaly detector will react to each data set. The graph has exponentially decaying curves with respect to the training size and more new n-grams as the number n increases as ex- Fig. 10. Anagram training on usenet pected. After a short amount of training, raw text data directly to test learning the dataset shows relatively low anomaly of English with a small sample of text. scores during the testing phase showing that content anomaly detectors are flexible enough especially at small sliding window sizes to roughly learn English. To make sure we model data that is content anomaly detectors have trouble with, we add image upload use cases. Any compressed, random, or encrypted data is difficult for these sensors to model unlike English text. A large portion of the false positives from Anagram and Spectrogram come from such image uploads. Other common false positives we see include short high entropy strings such as session identifiers and to a lesser amount usernames and passwords. False positive rates and counts in general best serve as a relative metric between sensors on the same dataset. Much more external data is needed in order to evaluate whether a sensor is useable at a certain false positive rate or raw false positive count. The strategy of managing false positives has a large impact on the actual cost incurred. For instance, automated methods of filtering false positives such as a shadow server [16] will have drastically lower costs than relying on a human analyst. Correlation between cooperating organizations can further filter out alerts to only require a human analyst for a small portion as previously demonstrated [14]. Even if a human analyst is required, many false positives or at least types of false positives repeat over time so an initial effort
of labeling and creating filtering rules could drastically change the consequential costs. The data generated by Wind Tunnel and tested by sensors can be further filtered by any of these methods in order to provide organizations with a better idea of what costs would be incurred by any set of security controls tested. 4.6
Attack Evasion
In addition to testing the effect of variations in normal data generation, we have evasion mechanisms applied to attack data. The most targeted of these is the padding attack, which aims to bypass content anomaly detectors by appending normal data to attack content in order to reduce the score of the overall request. All the Wordpress datasets had padding attacks launched as one of their attack permutations. The effect is most seen in the two sensors Anagram and Spectrogram, which look at the full stream of user submitted data for each request without breaking it down into attribute value pairs as the other web layer sensors do. The score given to attacks with padding is significantly lower. For example Anagram goes from scoring the attacks at over 90 to scoring them in the mid 40s. Despite this, the AUC of each of these sensors suffers only by a few hundredths at most when looking at only padding attacks compared to attacks without padding. This is due to the large majority of the normal data being scored by both sensors at such low scores that lowering the threshold to still detect padding attacks does not induce too many more false positives.
5
Related Work
There have been a number of efforts to generate quality synthetic data in the past. Arguably the most famous, the 1999 DARPA dataset contained serious flaws [29]. A more recent data set from ISCX [5] attempts to address those flaws by collecting all traffic including attack traffic at once and using more recent multistage application level attacks in addition brute force and denial of service. Our focus differs in that we focus on one attack vector, web application attacks, and try to model user content whereas the ISCX data represents a broad array of attack data at only the network level and focuses on modeling volumetrics and other connection level details. The DETER testbed [30] [31] provides a secure and scalable remote test environment. The goals of the DETER project to push the state of the art of experiments in computer security are similar to ours. DETER focuses on network scaling and containment of dangerous experiments in a remotely accessible testbed. Wind Tunnel is complementary to DETER as we focus on modeling content with multilayer data collection. Wind Tunnel could be deployed in a large scale network environment such as DETER to model larger scale systems such as large cloud environments with realistic content. Others have addressed aspects of comparing sensors and measuring defense in depth. In related work [32], the authors compare a variety of anomaly detectors against a set of real user data while injecting synthetic attack data. Such effort illustrated the need for better comparison and tests against baseline datasets.
We use similar sensors in Wind Tunnel, but expand to additional layers and focus on creating shareable datasets. Others [33] suggest an empirical approach to measuring defense in depth assuming each layer is independent and combining detection rates to infer total security. A more direct measurement approach is suggested for defense in depth in prior work [34] without assuming independence between layers by linking attack data directly. This is the type of approach we utilize here, by linking attack data across layers since we have the ground truth of when attacks begin and end.
6
Future Work
The modularity of Wind Tunnel lends itself to many useful future endeavors. We hope to add more Selenium use cases, attacks, and security controls to grow the usefulness of Wind Tunnel. We plan to leverage this modularity to generate new datasets to model different usage scenarios and test various hypothesis without having to construct such experiments from scratch. In particular we wish to test inline security controls such as various server side taint tracking techniques. To support inline sensors, which will require the same dataset to be generated once for each inline security control as well as once for all the out of band security controls, we plan to add significant determinism to regenerating data sets. In order to make Wind Tunnel more usable, we plan to create a web front-end with a fully automated dataset generation process for any new use cases, web application servers, and attacks are created. The goal would be for anyone with an experiment idea to be able to add any components not currently included and then generate a dataset from that configuration. Over time this could evolve into a repository of interchangeable experiment components saving significant time and opening up more rigorous evaluation of new security controls.
7
Conclusion
We present Wind Tunnel, a framework and working prototype for generating synthetic datasets across multiple layers suitable for testing security controls defending against web application attacks regardless of the layer of data they operate on. We provide the ability to evaluate security controls not against ones of the same type, but also against security controls operating at entirely different layers. In addition, by tracking which individual attacks or attack permutations each security control detects at a certain false positive rate, we are able to compute a total detection rate for any arbitrary set of security controls. Instead of making assumptions of independence about how security control overlap, we can directly measure the overlap. The modularity of Wind Tunnel will allow future research to perform performance evaluation and comparison of new security controls against a wide array of previous research and either generate or reuse synthetic datasets, which can be widely shared. This reduces the effort required to independently setup each security control or undertake the task of generating
or acquiring datasets. Our synthetic datasets, source code, and instructions for others to be able to use and expand this syetem are available for all researchers (http://ids.cs.columbia.edu/content/windtunnel).
References 1. L. Sweeney, “k-anonymity: A model for protecting privacy,” International Journal of Uncertainty, Fuzziness & Knowledge-Based Systems, vol. 10, no. 5, p. 557, Oct. 2002. [Online]. Available: http://ezproxy.cul.columbia.edu/login?url=http://search.ebscohost.com/ login.aspx?direct=true&db=bah&AN=8584293&site=ehost-live&scope=site 2. C. Dwork, “Differential privacy,” in Automata, languages and programming. Springer, 2006, p. 112. [Online]. Available: http://link.springer.com/chapter/10. 1007/11787006 1 3. “Selenium,” http://seleniumhq.org. 4. Rapid 7 Open Source Projects, “Metasploit framework,” http://www.metasploit. com/. 5. A. Shiravi, H. Shiravi, M. Tavallaee, and A. A. Ghorbani, “Toward developing a systematic approach to generate benchmark datasets for intrusion detection,” Computers & Security, vol. 31, no. 3, pp. 357–374, 2012. [Online]. Available: http://dx.doi.org/10.1016/j.cose.2011.12.012 6. C. Shaoul and C. Westbury, “A reduced redundancy usenet corpus (2005-2011),” http://www.psych.ualberta.ca/∼westburylab/downloads/westburylab.wikicorp. download.html, 2013. 7. ——, “The westbury lab wikipedia corpus,” http://www.psych.ualberta.ca/ ∼westburylab/downloads/westburylab.wikicorp.download.html, 2010. 8. “Stack exchange data dump,” https://archive.org/details/stackexchange. 9. “Stack exchange data explorer,” http://data.stackexchange.com/. 10. “Skull security wiki rockyou password file,” https://wiki.skullsecurity.org/ Passwords. 11. “Wikimedia commons public domain images,” http://commons.wikimedia.org/ wiki/Category:PD-user, 2013. 12. OSVDB, “Testlink ... arbitrary file upload weakness,” http://osvdb.org/show/ osvdb/85446, 2012. 13. ——, “Foxypress plugin for wordpress ... file upload php code execution,” http: //osvdb.org/show/osvdb/82652, 2012. 14. N. Boggs, S. Hiremagalore, A. Stavrou, and S. J. Stolfo, “Cross-domain collaborative anomaly detection: So far yet so close,” in Proceedings of the 14th International Conference on Recent Advances in Intrusion Detection, ser. RAID’11. Berlin, Heidelberg: Springer-Verlag, 2011, pp. 142–160. [Online]. Available: http://dx.doi.org/10.1007/978-3-642-23644-0 8 15. Y. Song, A. D. Keromytis, and S. J. Stolfo, “Spectrogram: A mixture-of-markovchains model for anomaly detection in web traffic,” in NDSS ’09: Proceedings of the 16th Annual Network and Distributed System Security Symposium, 2009. 16. K. Wang, J. J. Parekh, and S. J. Stolfo, “Anagram: A Content Anomaly Detector Resistant to Mimicry Attack,” in Symposium on Recent Advances in Intrusion Detection, Hamburg, Germany, 2006. 17. C. Kruegel and G. Vigna, “Anomaly Detection of Web-based Attacks,” in ACM Conference on Computer and Communication Security, Washington, D.C., 2003.
18. G. Cretu, A. Stavrou, M. Locasto, S. Stolfo, and A. Keromytis, “Casting out demons: Sanitizing training data for anomaly sensors,” in Security and Privacy, 2008. SP 2008. IEEE Symposium, may 2008, pp. 81 –95. 19. G. Cretu-Ciocarlie, A. Stavrou, M. Locasto, and S. Stolfo, “Adaptive Anomaly Detection via Self-Calibration and Dynamic Updating,” in Recent Advances in Intrusion Detection. Springer, 2009, pp. 41–60. 20. F. Valeur, D. Mutz, and G. Vigna, “A learning-based approach to the detection of sql attacks,” in In DIMVA (2005, 2005, pp. 123–140. 21. “Greensql opensource database firewall,” http://www.greensql.net/ download-dot-net. 22. S. J. Stolfo, F. Apap, E. Eskin, K. Heller, A. Honig, and K. Svore, “A comparative evaluation of two algorithms for windows registry anomaly detection,” in OF JOURNAL OF COMPUTER SECURITY, 2005, pp. 659–693. 23. “The linux audit daemon,” http://linux.die.net/man/8/auditd. 24. E. Eskin, “Anomaly detection over noisy data using learned probability distributions,” in In Proceedings of the International Conference on Machine Learning. Morgan Kaufmann, 2000, pp. 255–262. 25. D. Mutz, F. Valeur, G. Vigna, and C. Kruegel, “Anomalous system call detection,” ACM Trans. Inf. Syst. Secur., vol. 9, no. 1, pp. 61–93, Feb. 2006. [Online]. Available: http://doi.acm.org/10.1145/1127345.1127348 26. “System intrusion analysis reporting environment(snare) for linux,” http://www. intersectalliance.com/projects/snare/. 27. S. Forrest, S. A. Hofmeyr, A. Somayaji, and T. A. Longstaff, “A sense of self for unix processes,” in Proceedings of the 1996 IEEE Symposium on Security and Privacy, ser. SP ’96. Washington, DC, USA: IEEE Computer Society, 1996, pp. 120–. [Online]. Available: http://dl.acm.org/citation.cfm?id=525080.884258 28. “Sequence-based intrusion detection,” http://www.cs.unm.edu/∼immsec/ systemcalls.htm. 29. M. Tavallaee, E. Bagheri, W. Lu, and A. A. Ghorbani, “A detailed analysis of the kdd cup 99 data set,” in Proceedings of the Second IEEE International Conference on Computational Intelligence for Security and Defense Applications, ser. CISDA’09. Piscataway, NJ, USA: IEEE Press, 2009, pp. 53–58. [Online]. Available: http://dl.acm.org/citation.cfm?id=1736481.1736489 30. “The DETER testbed: Overview,” http://www.isi.edu/deter/docs/testbed. overview.pdf, Aug. 2004. [Online]. Available: http://www.isi.edu/deter/docs/ testbed.overview.pdf 31. T. Benzel, R. Braden, D. Kim, C. Neuman, A. D. Joseph, and K. Sklower, “Experience with deter: A testbed for security research,” in TRIDENTCOM. IEEE, 2006. 32. K. Ingham and H. Inoue, “Comparing anomaly detection techniques for http,” in Recent Advances in Intrusion Detection, ser. Lecture Notes in Computer Science, C. Kruegel, R. Lippmann, and A. Clark, Eds. Springer Berlin Heidelberg, 2007, vol. 4637, pp. 42–62. [Online]. Available: http://dx.doi.org/10.1007/978-3-540-74320-0 3 33. H. Cavusoglu, B. Mishra, and S. Raghunathan, “A model for evaluating it security investments,” Commun. ACM, vol. 47, no. 7, pp. 87–92, Jul. 2004. [Online]. Available: http://doi.acm.org/10.1145/1005817.1005828 34. N. G. Boggs and S. Stolfo, “Aldr: A new metric for measuring effective layering of defenses,” in Fifth Layered Assurance Workshop (LAW 2011), Orlando, Florida, December 5-6, 2011, 2011.