Data Cube Approximation and Mining using Probabilistic Modeling Cyril Goutte1 , Rokia Missaoui2 , Ameur Boujenoui3 1
Interactive Language Technologies, NRC Institute for Information Technology 101, rue St-Jean-Bosco, Gatineau, QC, K1A 0R6, Canada 2 D´epartement d’informatique et d’ing´enierie, Universit´e du Qu´ebec en Outaouais C.P. 1250, succ. B, Gatineau, QC, J8X 3X7, Canada 3 School of Management, University of Ottawa 136 Jean-Jacques Lussier, Ottawa, ON, K1N 6N5, Canada
[email protected],
[email protected],
[email protected]
Abstract On-line Analytical Processing (OLAP) techniques commonly used in data warehouses allow the exploration of data cubes according to different analysis axes (dimensions) and under different abstraction levels in a dimension hierarchy. However, such techniques are not aimed at mining multidimensional data. Since data cubes are nothing but multi-way tables, we propose to analyze the potential of two probabilistic modeling techniques, namely non-negative multi-way array factorization and log-linear modeling, with the ultimate objective of compressing and mining aggregate and multidimensional values. With the first technique, we compute the set of components that best fit the initial data set and whose superposition coincides with the original data; with the second technique we identify a parsimonious model (i.e., one with a reduced set of parameters), highlight strong associations among dimensions and discover possible outliers in data cells. A real life example will be used to (i) discuss the potential benefits of the modeling output on cube exploration and mining, (ii) show how OLAP queries can be answered in an approximate way, and (iii) illustrate the strengths and limitations of these modeling approaches. Key Words : data cubes, OLAP, data warehouses, multidimensional data, non-negative multiway array factorization, log-linear modeling.
1
Introduction
A data warehouse is an integration of consolidated and non volatile data from multiple and possibly heterogeneous data sources for the purpose of decision support making. It contains a collection of data cubes which can be exploited via online analytical processing (OLAP) operations such as roll-up (increase in the aggregation level) and drill-down (either decrease in the aggregation level or increase in the detail) according to one or more dimension hierarchies, slice (selection), dice (projection), and pivot (rotation) [10]. In a multidimensional context with a set D of dimensions, a dimension (e.g., location of a company, time) is a descriptive axis for data presentation under several perspectives. A dimension hierarchy contains levels, which organize data into a logical structure (e.g., country, state and city for the location dimension). A member, or modality, of a dimension is one of the data values for a given hierarchy level of that dimension. A fact table (such as Table 1) contains numerical measures and keys relating facts to dimension tables. A cube X = hD, M i is a visual representation of a fact table, where D is a set of n dimensions of the cube (with associated hierarchies) and M is a corresponding set of measures. For simplicity reasons, we assume that M is a singleton, and we represent X by X = [xi1 i2 ...in ]. In many database and data warehouse applications, data cubes are generally numerous and large, hence users tend to (i) be drowning in data and even in knowledge discovered from data, (ii) use more dimensions (variables) than necessary to explain a set of phenomena and check predefined hypotheses, and (iii) analyze a generally heterogeneous population of individuals. In order to reduce the memory overload and working space induced both by the tendency for over-dimensioning and the inherent heterogeneity and huge volume
of data, we propose to use two complementary techniques: non-negative multi-way array factorization (NMF) and log-linear modeling (LLM). We highlight their potential in handling some important issues in mining multidimensional and large data, namely data compression, data approximation and data mining. A comparative study of the two techniques is also conducted. The paper is organized as follows. First, we provide in Section 2 some background about the two selected probabilistic modeling techniques: NMF and LLM. Then, an illustrative and real-life example about corporate governance quality in Canadian organizations is described in Section 3 and will serve, in Section 4, to illustrate the potential of the selected techniques for cube mining, exploration and visualization. Section 5 highlights the advantages and limitations of the two techniques. Section 6 describes some related work. Conclusion and further work are given in Section 7. In the sequel we will use the terms contingency table, variable, modality, and table tuple to mean respectively data cube, dimension, member, and cube cell in data warehousing terminology.
2
Probabilistic Models
Any statistical modeling technique has two conflicting objectives: (i) finding a concise representation of the data, using a restricted set of parameters, and (ii) providing a faithful description of data, ensuring that the observed data is close to the estimation provided by the model. The challenge is to automatically find a good compromise between these two objectives. The first objective will help reduce both storage space and processing cost, while the second one ensures that the generated model yields accurate answers to queries addressed to the data. Formally, let us assume in the following that we analyze an n-dimensional cube X = [xi1 i2 ...in ]. Without loss of generality, and to simplify notations, let us assume that n = 3, and denote the 3-dimensional cube X = [xijk ], where (i, j, k) ∈ [1 . . . I] × [1 . . . J] × [1 . . . K]. The purpose of the probabilistic models we describe below is to assign a probability, denoted P (i, j, k), to the observation of each tuple (i, j, k). For example, if (i, j, k) refers to the income, education and occupation respectively, then P (i, j, k) is the probability to observe a particular combination of the (income, education, occupation) modalities in the observed population. Assuming that the data cube records the counts xijk of the observations of each combination of the modalities in the data, the (log) likelihood of a given model θ is: X (1) L = − log P (X|θ) = − xijk log P (i, j, k), ijk
assuming independent and identically distributed observations. The most flexible, or saturated, model consists of estimating each P (i, j, k) based on the data. The Maximum Likelihood solution for the saturated model is obtained for Pb(i, j, k) = xijk /N , with N = P ijk xijk the total number of observations. The main issue is that there are I × J × K − 1 free parameters in that model, i.e., as many adjustable parameters as there are cells in the cube.1 This means that: first, the parameters may be poorly estimated; and second, the model does not provide any “compression” of the data since it just reproduces it without modeling any interesting or systematic effect. At the other end of the spectrum, one of the simplest models implements the independence assumption, i.e., all dimensions are independent. In such a case, P (i, j, k) = P (i)P (j)P (k) and we only have I + J + K − 3 P P free parameters. The maximum likelihood estimates are Pb(i) = jk xijk /N , Pb(j) = ik xijk /N and P Pb(k) = ij xijk /N . That parsimonious model is usually too constrained. For example, due to the independence assumption, it is impossible to model any interaction between dimensions. In other words, the behavior along dimension i is the same regardless of values j and k, e.g., the distribution of income is identical regardless of the education and occupation. This makes the independence assumption unable to model interesting effects, and often too restrictive in practice. A useful model will usually be somewhat in between these two extremes. It needs to strike a balance between expressive power and parsimony. A useful model may also be seen as a compressed version of 1 Assuming
that the total number of observations is known.
2
the data trading off size versus approximation error: a good model provides a (lossy) compression of the data cube, which approximates its content. One potential application is that it may be faster to access an approximate version of the cube content through the model, than an exact version through the data cube itself. The quality and relevance of this approximation will be addressed later in Section 4. The quality of the model is also crucially dependent on its complexity. We will also suggest methods to select the appropriate model complexity based on the available data. This may be done for example using likelihood ratio tests [11] or information criteria such as the AIC [1] or BIC [37]. Moreover, the overall process of selecting a parsimonious model in LLM can be handled using backward elimination, forward selection or some variant of these two approaches (see Subsection 2.2). The two models described below (Sections 2.1 and 2.2) try to reach this balance in different ways. The nonnegative multi-way array factorization approach models the data as a mixture of conditionally independent components, the combination of which may model more complicated dependencies between dimensions. Log-linear modeling tries to include only relevant variable interactions (and discard weak interactions), in order to represent dependencies between dimensions in a compact way. 2.1
Non-negative Multi-way Array Factorization
In Non-negative Multi-way array Factorization (or NMF), complexity is gradually added to the model by including components in a mixture model. Each component has conditionally independent dimensions, which means that all observations modeled by this component “behave the same way” along each dimension. In the framework of probabilistic models, this means that the resulting model is a mixture of multinomial distributions: (2)
P (i, j, k) =
C X
P (c)P (i|c)P (j|c)P (k|c)
c=1
Each component c = 1 . . . C adds (I − 1) + (J − 1) + (K − 1) + 1 parameters to the model. For C = 1, this simplifies to the independence assumption, and by varying C, the complexity of the mixture model increases linearly. Note that although within each component the dimensions are independent, this does not mean that the overall model is independent. It means that the data may be modeled as several homogeneous components. To come back to our previous example, one component may correspond to high income and education, and another to low income and education. All members of the former component will tend to have both high income and high education, while all members of the latter component will have both low income and low education. Within each component these dimensions are therefore independent. However, the combination of these two components will clearly reveal a dependency between the level of education and the income. This is similar to modeling continuous distributions with Gaussian mixtures: although each component is Gaussian, the overall model can in fact approximate any distribution with arbitrary precision. The probabilistic model in Equation 2 is linked to factorization in the following way. Organizing the “profiles” P (i|c), P (j|c) or P (k|c) as I × C matrix W = [P (c)P (i|c)], J × C matrix H = [P (j|c)] and K × C matrix A = [P (k|c)] respectively, we may rewrite Equation 2 as (3)
X 1 X≈ Wc ⊗Hc ⊗Ac , N c
where Wc , Hc and Ac are the c-th columns of W, H and A. The observed array X is thus approximated by the sum of C components, each of which is the product of b = N P Wc⊗Hc⊗Ac . Note that the first three factors. The estimate from the factorization is denoted by X c factor W contains the joint probability P (i, c) = P (c)P (i|c), while the other factors contain conditional probabilities, P (j|c) and P (k|c). Equivalently, we may keep all factors conditional by appropriately multiplying by a diagonal matrix of P (c). One advantage of conditional probabilities is that the associated “profiles”, e.g., P (i|c = 1) and P (i|c = 2) may be compared directly, even when the corresponding components (c = 1 and c = 2 in our example) have very different sizes (and, as a consequence, different P (c)). Given that the factors contain probabilities, we are restricted to positive values. The mixture model ap3
proach is therefore a particular case of Non-negative Multi-way array Factorization, or NMF,2 cf. [42, 32]. There are two specificities in this probabilistic model. First, the factors are not only positive, they form probabilities. This means that their content (for W) or their columns (for H and A) sum to one. Second, the estimation of the parameters is different. For the probabilistic model, the traditional approach is to rely on Maximum Likelihood estimation. In the context of mixture models, this is conveniently done using the Expectation-Maximization algorithm (EM, [13]). For the more general NMF problem, the approximation in Equation 3 will minimize a divergence between the data X = [xijk ] and the factorization b = [b X xijk ]. Different expressions of the divergence potentially yield different parameter estimation procedures. However, it turns out that the use of a generalized form of the Kullback-Leibler divergence is actually equivalent to Maximum Likelihood on the probabilistic model. Let us define the Kullback-Leibler divergence as: X b = (4) KL(X, X) (xijk log x bijk − xijk + x bijk ) i,j,k
Going back to the expression of the log-likelihood (Equation 1), and using P (i, j, k) = x bijk , we have b = −L − N + P x b . In addition, it turns out that at the minimum of the divergence, KL(X, X) ijk ijk b X has the same marginals, and same global sum, as X. As a consequence, minimizing the divergence between the factorization and the observations is exactly equivalent to maximizing the likelihood of the probabilistic model (see also [16] for the 2D case). One outcome of this equivalence is that in the factorization view, we are not limited to working with an observed array X that contains only integer counts. Any positive3 array X may be factorized. This opens the possibility to use NMF directly on data cubes containing for example averages rather than simply frequencies. On the other hand, in the strictly probabilistic formulation, X contains counts of observations sampled from a multinomial random variable.4 Another advantage of the factorization setting is that the approximation may be expressed using different costs [40]. For example the squared error divergence, or Frobenius norm, X 2 b = SE(X, X) (xijk − x bijk ) ijk
will produce a true sparse representation of the data, while the KL divergence will produce many small, but not quite zero, approximations in the array. On the other hand, in the probabilistic view, the parameter estimation typically uses maximum likelihood or penalized versions of it (such as the maximum a posteriori, or MAP, estimate). Other types of costs may be handled after parameter estimation, or using awkward noise models on top of the model in Equation 2. Parameter estimation: The link between the probabilistic mixture model and NMF also has an implication on the parameter estimation procedure. First, it suggests that NMF has many local minima of the divergence. This fact is not widely acknowledged in the NMF literature (for D = 2 or higher). Second, there have been many attempts in statistics to devise strategies that would both stabilize the EM algorithm and promote better maxima. One such approach is the use of deterministic annealing [35]. The parameters of the probabilistic model may be estimated by maximizing the likelihood using the EM algorithm[13, 23]. It turns out that the resulting iterative update rules are almost identical to the NMF update rules for the KL divergence. The details of the iterative EM procedure, and its links to the NMF update rules, are given in Appendix A. Model selection: The crucial issue in factorization is to select the rank of the factorization, i.e., the number of columns in each factor. Similarly, in mixture modeling, the equivalent problem is to select the proper number of components. This is traditionally done by optimizing various information criteria over the number of components, e.g., AIC [1], BIC [37], NEC [5] or ICL [6]. Note that a mixture of multinomial 2 This
generalizes the 2-dimensional Non-negative Matrix Factorization[27]. fact, one can even compute a NMF of an array with negative values, although the best non-negative approximation of negative values will obviously be 0—and the KL divergence would clearly not work as it is. 4 Note however that it is usually possible to obtain an arbitrarily close integer approximation by multiplying fractional values by a suitably large constant. 3 In
4
does not really fit the assumptions behind these criteria. However, as an approximate answer, we will rely on the first two information criteria. In the context of this study, and to stay coherent with the following section, we will express these criteria in terms of the (log) likelihood ratio G2 and a number of degrees of freedom df . G2 is defined as twice the difference in log-likelihood between the fitted, maximum likelihood model for the investigated model structure and the saturated model: X xijk b = 2(KL(X, X) − KL(X, X)). (5) G2 = 2 xijk log x bijk ijk
The number of degrees of freedom is the difference in number of free parameters between the fitted model and the saturated model: df = IJK − (I + J + K − 2) × C. The two information criteria we consider are: AIC = G2 − 2df
(6)
BIC = G2 − df × log N
and
The value of C that minimizes either criterion may be considered the “optimal” number of components. Note that BIC tends to favor a smaller number of components than AIC, because the penalty for each component is larger whenever N ≥ 8. This effect is especially pronounced with mixtures of multinomial, because both the number of parameters and the number of free cells in the observation table can be very large. Note that there are a number of issues associated with the use of AIC and BIC for selecting the proper number of components, e.g., model completeness (i.e., whether the model class contains the true model) or underlying assumptions. The optimal number of components selected by these criteria must be viewed as an indication rather than an absolute truth. 2.2
Log-Linear Modeling
Log-linear modeling (or LLM, [25, 11]) is commonly used for the analysis of multi-way contingency tables, i.e., tables of frequencies of categorical variables. Therefore, it seems natural to use LLM to analyze and model data cubes whenever such multidimensional data can be expressed as contingency tables. Without loss of generality and for simplicity reasons, let us consider a contingency table with three variables A ∈ {a1 , . . . ai , . . . aI }, B ∈ {b1 , . . . bj , . . . bJ } and C ∈ {c1 , . . . ck , . . . cK }, where xijk is the count of the number of observations for which the three variables have values (ai , bj , ck ). The idea behind LLM is to approximate the observed frequencies xijk by the expected frequencies x bijk as a linear model in the log domain: B C AB AC BC ABC log(b xijk ) = λ + λA i + λj + λk + λij + λik + λjk + λijk
(7)
The parameters of the LLM are the lambdas in Equation 7. λ is the overall mean and the other parameters represent the effects of a set (or subset) of variables on the cell frequency. For example, λA i represents the main effects of observing value ai for variable A, while λBC represents the two-way (or second-order) effect jk of observing B = bj and C = ck . The model in Equation 7 contains all n-ways effects among A, B, and C, for 1 ≤ n ≤ 3. It is called saturated since it is exactly equivalent to estimating one parameter per cell as discussed earlier in Section 2. In order to make the parameters identifiable, the following constraints (called effect coding) are imposed. X X X λA λB λC i = j = k =0 X j
(8)
λAB ij
=
X i
λAB ij
=
X k
λAC ik
=
X
X
i
λAC ik
i
λABC ijk
=
=
X j
k
X
j
k
λBC jk
=
λBC jk = 0
j
k
λABC ijk
X
=
X
λABC =0 ijk
i
The most popular models are hierarchical models: all the lower-order effects contained within higherorder ones are necessarily included. Based on this definition, a common notation for hierarchical loglinear models consists of only specifying the terms with the highest order interactions. For example, 5
{A ∗ B, A ∗ C} will denote a hierarchical model containing A ∗ B and A ∗ C effects as well as any subset of these (in that case, A, B and C) and the overall mean. For the saturated model corresponding to a 3-way table, the number of parameters is the sum of the following values: • 1 for the main effect (overall mean) λ B C • (I − 1) + (J − 1) + (K − 1) for the 1-way effect parameters: λA i , λj and λk . AC • (I − 1) × (J − 1) + (I − 1) × (K − 1) + (J − 1) × (K − 1) for the 2-way effect parameters: λAB ij , λik BC and λjk .
• (I − 1) × (J − 1) × (K − 1) for the 3-way effect parameters: λABC ijk . Assuming for example that the number of categories in A, B, and C is I = 2, J = 3, and K = 4, respectively, the model {A∗B, A∗C} has 15 parameters: 1 for the main effect, (I −1)+(J −1)+(K −1) = 6 for the one-way effects, and (I − 1) ∗ (J − 1) + (I − 1) ∗ (K − 1) = 8 for the two-way effects. The reasons for using a hierarchical model are threefold: (i) ease of interpretation, as it would make little sense to include higher-order effects without including the underlying lower-order interactions; (ii) lighter computational burden, as it makes model selection more tractable (see below); (iii) convenience of use of the generated model in aggregation operations, such as roll-up, common in OLAP applications. Parameter estimation: There are a number of techniques for estimating LLM parameters. The meanbased estimates and variants [22, 36] provide closed-form expressions for the parameters by assuming that the logarithms of the frequencies follow Gaussian distributions with the same variance. Although it offers the convenience of an analytical and explicit expression for the parameter estimates, this assumption is usually unreliable, especially when there are many extreme values, which is precisely one situation of interest. It is therefore more common to rely on iterative maximization of the likelihood. One method for doing this is the Newton-Raphson algorithm [20], a standard unconstrained optimization technique that is implemented in many optimization packages. In the context of modeling frequencies in a multi-way array, another popular technique is the Iterative Proportional Fitting (IPF) procedure [12]. IPF works by iterating over the data and refining the estimated values in each cell of the table while maintaining the marginals. The algorithm is simple to implement and has a number of attractive properties [33]. Note that the SPSS software used in our experiments uses IPF for estimating and selecting hierarchical LLM and Newton-Raphson for general log-linear models. Model selection: Model selection consists of finding the best compromise between parsimony and approximation, i.e., the model which contains the smallest set of parameters and for which the difference between observed and expected frequencies is not significant. This is a tricky issue because an exhaustive n search of the best parsimonious model among the 22 possible models can be very time-consuming. For example, a 3-dimensional table will give rise to 256 possible models. Although the number of hierarchical models is much smaller (e.g., there are 19 hierarchical models for a 3-way table), exhaustive search is still impractical in most cases. The discrepancy between the observed cell values, xijk , and the estimated ones, x bijk , is measured either globally or locally (i.e., cell by cell). The global evaluation may be conducted based on the likelihood ratio statistic (or deviance) or the Pearson statistic. The deviance G2 is defined according to Equation 5 as twice the difference in log-likelihood between the maximum likelihood model and the saturated model. For nested models, and under the null hypothesis (no difference between the two models), the likelihood ratio approximately follows a chi-square distribution with degrees of freedom df equal to the number of lambda terms set to zero in the tested model (i.e., the difference between the number of cells and the number of free parameters). Model selection in LLM is commonly performed using backward elimination. Starting from the saturated model, one successively eliminates interactions, as long as the associated increase in G2 is not significant at a pre-specified level (usually 95%). Interactions are examined from higher to lower order, starting from the smallest resulting increase in G2 . Backward elimination stops when none of the remaining interactions can 6
be eliminated without a significant increase in G2 . Forward selection proceeds the opposite way, by starting with a small model (generally the independence model) and then adding interactions of increasing order as long as they yield a significant decrease in G2 . A combination of both, also called stepwise selection, is used when after each addition in a forward step, one attempts to remove unnecessary interactions using backward elimination. Note however that backward elimination is more straightforward when dealing with hierarchical models and seems to be the preferred method in the LLM literature [11]. The likelihood ratio also allows the comparison of two models θ1 and θ2 , as long as they are nested, i.e., θ2 contains all the terms in θ1 . The likelihood ratio between the models is G2 (θ2 , θ1 ) = G21 − G22 . Under the null hypothesis of no difference, it is approximately chi-square distributed with df = df1 − df2 degrees of freedom. If the computed ratio is higher than the value of χ2 (1 − α, df ) for an appropriate significance level α, then θ1 is significantly worse than θ2 and the smaller model is discarded. Besides stepwise methods, information-theoretic criteria such as the AIC [1] or BIC [37] can be used for model selection. These criteria are computed as in Equation 6, and models are selected by minimizing the criterion. This may also be done using backward elimination or forward selection. Note that in the context of LLM, AIC seems to be preferred [11]. As indicated above, the goodness-of-fit may also be evaluated locally, i.e., for each cell. This can be done by computing the standardized residuals SRijk in each cell (i, j, k) as follows: SRijk =
xijk − x bijk p x bijk
A large absolute value of the standardized residual in a given cell is a sign that the selected model may not be appropriate for that cell. It can also be interpreted as signaling an outlier in the data.
3
A Case Study
We will now introduce the running example that will be used in the second half of this report to illustrate the use of probabilistic models to integrate Data Mining (DM) and Data Warehousing (DW) technologies. It is based on a study conducted on a sample of 214 Canadian firms listed on the Stock Market and aimed at establishing links between corporate governance practices and other variables such as the shareholding structure [7]. In the context of this study, governance is defined as the means, practices and mechanisms put in place by organizations to ensure that managers are acting in shareholders’ interests. Governance practices include, but are not limited to, the size and the composition of the Board of Directors, the number of independent directors and women sitting on the Board as well as the duality between the position of CEO and the position of Chairman of the Board. The data used in this study were mainly derived from a survey published in October 7, 2002 in the Canadian Globe and Mail newspaper[34], which discussed the quality of governance practices in a sample of firms. More precisely, the mentioned article provided a global evaluation of corporate governance practices of each firm by assessing five governance practices: the composition of the Board of Directors, the shareholding system (or control structure which includes internal shareholders, blockholders and institutional investors), the compensation structure for managers, the shareholding rights and the information sharing system. Data related to the types of shareholding systems, the associated percentage of voting rights and the total assets of each firm were obtained from the “StockGuide 2002” database. Data related to the size of the Board, the number of independent directors and women sitting on the Board, as well as the duality between the position of CEO and the position of Chairman of the Board were extracted from the “Directory of Directors” of the Financial Post. Based on the collected data, a data warehouse has been constructed with sixteen dimensions and an initial set of fact tables for data cube design and exploration. Table 1 is a fact table which provides the number of firms according to four dimensions: USSX, Duality, Size, and QI. USSX∈ {Yes, No} indicates whether the firm is listed or not on a US Stock Exchange. Duality ∈ {Yes, No} indicates whether the CEO is also the Chairman of the Board. Size ∈ {1, 2, 3, 4} represents the size of the firms in terms of the log of their assets. The values are 1 (< 2), 2 (≥ 2 and < 3), 3 (≥ 3 and < 4) and 4 (≥ 4). QI expresses the index of corporate governance quality (or simply quality index) and takes one of the following values (from worst to best quality): Low (< 40%), Medium (≥ 40 and < 70%), and High (≥ 70%). Before applying the two probabilistic modeling techniques to this running example, we first experimented 7
USSX No
Yes
Size 1 2 3 4 1 2 3 4
Duality: No QI:Low Med 0 7 7 21 11 13 0 3 0 4 4 0
1 12 4 3
High 0 12 11 1
Low 4 6 4 0
Yes Med 3 12 4 2
High 0 4 2 0
2 0 14 7
0 7 5 0
0 10 8 2
0 1 2 1
Table 1: Contingency table for the case study: each cell of the 4-dimensional data cube contains the number of companies with the corresponding attributes, according to the four considered dimensions.
with simple statistical techniques [7]. This revealed that the control structure is negatively correlated to the quality of the internal governance mechanisms. In other words, as the concentration of the control mechanisms (i.e., the total shares held by the three types of shareholders) increases, the number of effective internal governance mechanisms sought by an organization decreases. Furthermore, the statistical study showed that internal shareholders and block holders both have a negative impact on the quality of governance while institutional investors have a positive impact. These results, obtained by correlation analysis, were confirmed by a linear regression using the quality index as a dependent variable and taking the control structure and the size of the firm as independent variables. The preliminary statistical analysis helped us construct the most relevant cubes, such that we can focus on mining the most promising tables, i.e., those which contain correlated variables.
4
Experimental Results
In this section, we show and interpret the results produced by NMF and LLM techniques on our case study, illustrated by Table 1. 4.1
NMF results
With the 3 × 4 × 2 × 2 data cube from our case study, each additional component adds 8 parameters to the model. We consider all models from one component, i.e., the independence model (7 parameters) to five components (39 parameters). For each value of C, we optimize the parameters of the NMF model by maximizing the likelihood. For consistency with the log-linear model, we report results using the likelihood ratio, Equation 5, and calculate AIC and BIC [1, 37] accordingly: (9)
AIC = G2 − 2 × (48 − 8 × C)
and
BIC = G2 − (48 − 8 × C) log 47
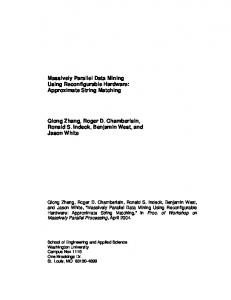
where G2 is the likelihood ratio for the maximum likelihood model with C components, 47 is the number of independent cells in the table (the value of the last cell may be deduced from the total cell count), and the number of degrees of freedom df , as defined in the previous section, is (48 − 8C). Figure 1 shows that the optimal number of components could be C = 2 or C = 3, with BIC favoring the more parsimonious model. As for the LLM, we rely on the AIC and will therefore focus on the 3component model. The NMF obtained using C = 3 components yields estimated frequencies that differ from the observed frequencies on average by ±1.2, with a maximum difference of 4 units (8 estimated vs. 4 observed). This sizable difference is quite unlikely in itself, however, considering that the data cube contains 48 cells, we can expect to observe a few differences that, taken in isolation, have low (sub 5%) probability. With a three component model, the original data cube may be represented as the superposition of three cubes, each corresponding to one component. The first component represents only 16% of the observations and simplifies to a subset of modalities on each dimension, see Table 2. In fact, with minimal loss in approximation, we could simplify this component to 2 dimensions with few modalities: QI ∈ {M ed, High} and Size ∈ {3, 4}, with the other two dimensions instantiated as Duality=No and USSX=Yes. This 8
0
Lo
Hi
1
2
3
4
N
Y
N
Y
Lo
Hi
1
2
3
4
N
Y
N
Y
Lo
Hi
1
2
3
4
N
Y
N
Y
3
2
Components
50
1
L2 AIC BIC
−50
Deviance / IC
100
Model selection for QI data
1
2
3
4
5
No. components
0.0
0.6
QI
SIZE
DUALITY
USSX
Figure 1: Left: Likelihood ratio, AIC and BIC versus number of components. This suggests that C = 2 (BIC) or C = 3 (AIC) are reasonable choices for the number of components. Right: Parameters of the 3-component NMF model. The tall, left pane shows P (c); Each row shows P (QI|c), etc., (rescaled) for each c. first component obviously corresponds to companies with no duality (i.e., they have distinct CEO and Chairman of the Board), listed in a US Stock Exchange and, as a consequence, with high governance quality. This component thus represents what we could call the “virtuous” companies. Bold numbers in Table 2 represent cells where this component dominates. For example, a cell (i, j, k) is in bold in the first component if the posterior for this component, P (c = 1|i, j, k) is larger than the posteriors for the other two components.5 This means that companies falling in those cells are more likely to belong to that component than to others. The second component explains around 27% of the observations. Clearly (see the right side of Figure 1 and Table 2), it corresponds to medium-sized companies (mostly Size=2 or 3) which are listed on a US Stock Exchange (USSX=Yes), yet have medium or low governance quality. These companies predominantly have their CEO as Chairman of the Board, and this seems to impact the governance quality negatively. This is apparent by contrasting the QI panes for Components 1 and 2 in Figure 1 (top and middle rows). The last component corresponds to most of the population (59%). It contains only companies not listed in the US (USSX=No). In that way, it is complementary to the first two components which represent all companies listed in the US. The parameters associated with this component are illustrated on Figure 1 (bottom right part) and the corresponding sub-cube is shown in Table 2. Overall, there is a clear separation between the three components. The first is small and very localized on a subset of modalities corresponding to large and virtuous companies. The second component represents the rest of the companies listed on a US Stock Exchange, for which the governance quality is lower than in Component 1. Finally, the last and largest component contains small to moderate-sized companies which are not listed in the US. This separation corresponds to a clustering of companies into three homogeneous groups. In addition, all three components are sparse to some extent (81% sparse for Component 1, down to 54% sparse for Component 3). Note, however, that there may be some overlap between the groups (or components). For example, both Component 1 and Component 2 contain companies in cell (QI=Med, Size=3, Duality=No, USSX=Yes), and both Component 1 and Component 3 are represented in cell (QI=Hi, Size=4, Duality=No, USSX=No). 5 Note
that even in cells with an expected count of 0, one of the components will be dominant.
9
Comp2 Comp1 USSX =No
=Yes
Duality:No Size QI:Md Hi 1 0 0 3 0 1 4 0 1 1 0 2 3 3 13 4 1 7
Yes Md Hi 0 0 0 0 0 0 0 0 0 1 0 1
USSX =Yes
Size 2 3 4
Duality=No QI:Lo Md 5 9 3 5 0 1
Hi 0 0 0
Lo 7 4 1
=Yes Md Hi 12 1 7 0 1 0
Size 1 2 3 4
Duality=No QI:Lo Md 2 5 11 22 7 15 1 2
Hi 2 9 6 1
Lo 1 5 4 0
=Yes Md Hi 2 1 11 5 7 3 1 0
Comp3
USSX = No
Table 2: Components of the 3-component NMF model. Cells where each component dominates are in bold. Cells in non represented rows and columns are uniformly equal to 0.
In summary, NMF identifies (i) a set of homogeneous components, (ii) a number of smaller, locally dense sub-cubes inside a possibly sparse data cube, and (iii) relevant subsets of modalities for each dimension and each component. The user may then explore the data cube by “visiting” the spatially localized subcubes associated with each component. Some queries may then be applied only to the components that have the impacted variable modalitites. Other operations like roll-up may be naturally implemented on the probabilistic model by marginalizing the corresponding variables. This is illustrated in Section 4.3 on three kinds of queries. 4.2
LLM results
We recall that the main objectives of probabilistic modeling of data cubes are data compression, approximation and mining. A parsimonious probabilistic model may be substituted for the initial data cube in order to provide a faster and more intuitive access to the data, by exhibiting for example the strongest associations discovered by LLM or the components generated by NMF. Using Table 1 we will now illustrate how a parsimonious log-linear model is selected and how the output of the modeling process can be interpreted. We show also how the selected model and its by-products, such as residuals may be exploited in a data warehouse environment to replace the initial data cube of n dimensions with a set of data cubes of smaller dimensionality. Finally, we may highlight cells with abnormal values, indicated by high absolute values of standardized residuals. We get a parsimonious model by applying backward elimination, as explained in Section 2.2, to the data cube shown on Table 1. Table 3 displays the successive steps in the algorithm. Interactions between variables are tested starting with higher order interactions and in increasing order of G2 . We see that removing the fourth-order effect and all but one third-order effects yields a non-significant difference on the modeling (the p-value from the chi-square test is larger than 5%). Because of the hierarchical model constraint, keeping QI*Size*USSX prevents us from removing the three underlying second-order effects. Out of the three remaining second-order effects, Size*Duality and Duality*USSX may be removed with no significant loss. Because of the hierarchical model constraint, no first-order effect is candidate for removal as they are all included in the retained second- and third-order effects. As a consequence, the resulting parsimonious model is {QI*Size*USSX, QI*Duality}. The deviance for this model is G2 = 23.06, with 21 degrees of freedom, which corresponds, according to the chi-square test, to a p-value of 0.341. This means that this parsimonious model is not significantly different from the saturated model in terms of approximation, but it uses only 27 free parameters instead of 48. This is summarized and compared to other models in Table 4. As the final selected model is {QI ∗ Size ∗ USSX, QI ∗ Duality}, this means that the link between QI, Size and USSX needs a three-way interaction, expressing the fact that the relation of governance quality to USSX is not the same for each value of firm size. However, Duality is only involved in a two-way interaction with QI, indicating that the presence or absence of duality in governance quality are the same
10
Effect QI*Size*Duality*USSX QI*Duality*USSX Size*Duality*USSX QI*Size*Duality QI*Size*USSX Duality*USSX QI*Duality
G2 4.38 0.23 2.20 11.36 19.92 2.88 14.11
df 6 2 3 6 6 1 2
Decision: discard discard discard discard keep discard keep
p-value 0.626 0.891 0.533 0.078 0.003 0.089 0.001
Table 3: Backward elimination in action: all effects of decreasing order are tested and discarded if their removal does not yield a significant (at the 5% level) decrease in approximation. The resulting model is {QI*Size*USSX,QI*Duality}. For each effect, we report the likelihood ratio statistic G2 , the number of degrees of freedom df, the corresponding p-value (from the χ2 distribution) and the resulting decision. 1. 2. 3. 4.
Model Independence All 2-order terms Parsimonious model All 3-order terms NMF (best AIC)
G2 98,99 42.41 23.06 4.38
df 40 23 21 6
p-value 0.000 0.008 0.341 0.626
AIC 18.99 -3.59 -18.94 -7.62
39.46
25
n/a
-8.54
Table 4: Goodness-of-fit statistics for a set of log-linear models, and comparison with the 3-component NMF. The “parsimonious” model is {QI ∗ Size ∗ USSX, QI ∗ Duality} (see text). The p-value for the NMF is not available as the test only compares models within the same family.
for all Size groups and USSX values. Table 4 shows that the likelihood ratio G2 for the independence model (Model 1) is high which means that it does not fit the data well. Although this model uses very few parameters, the test shows that the hypothesis that all variables are independent is rejected, i.e., there are associations among the four variables. The model using all second-order effects (Model 2 in Table 4) is also rejected at the α = 0.05 level, which confirms that at least one third-order effect is necessary to fit the data. The remaining models shown in Table 4 have smaller G2 and do not depart significantly from the saturated model. Note that we can compare the selected parsimonious model and the “all-3-order” model (Models 3 and 4, respectively, in Table 4) by computing the deviance G2 (M odel4 , M odel3 ) = 23.06 − 4.38 = 18.68. The corresponding df is equal to 21-6=15. Since the likelihood ratio statistic is smaller than χ2 (0.95, 15) = 25, this suggests that the parsimonious model does not fit the data significantly worse than the “all-3-order” model. As it is more parsimonious, it should be preferred. Using the AIC, the parsimonious model is also the preferred one among the four identified models since its AIC value is the smallest. The 3-parameter NMF indicated for comparison in Table 4 has clearly a worse fit to the data than the best log-linear model. However, because it is slightly more parsimonious, it yields the second best AIC. The frequencies of the 4-way table, as estimated by the parsimonious log-linear model, are given in Table
USSX No
Yes
Size 1 2 3 4 1 2 3 4
Duality: No QI:Low Med 2 6 7 20 8 10 0 3 0 6 5 0
1 13 7 3
High 0 13 11 1
Low 2 7 8 0
Yes Med 4 13 7 2
High 0 3 2 0
2 1 13 7
0 6 5 0
0 9 5 2
0 0 3 1
Table 5: Estimated contingency table for the parsimonious log-linear model {QI ∗ Size ∗ USSX, QI ∗ Duality}. 11
USSX =No
=Yes
Size 1 2 3 4 1 2 3 4
Lo 4 13 15 0 0 11 9 0
QI Me 10 33 17 5 1 22 12 5
Hi 0 16 13 1 2 1 16 8
QI: Low Med High
Duality No Yes 26 26 64 41 47 10
Table 6: The two sub-cubes identified by LLM as substitutes for the original data cube: QI*Size*USSX, left, and QI*Duality, right.
5. The estimated frequencies are within ±3.5 of the data, and within ±0.9 on average. The standardized residuals allow to detect unusual departures from expectation, which may indicate outliers or cells that would require further investigation. With this model, the highest standardized residual is 1.969 for the cell that corresponds to QI= High, Size=2, Duality=Yes and USSX=Yes. This is due to the fact that this is a low-frequency cell in which the residual is small, but due to the standardization, the standardized residual becomes borderline significant. None of the cells with higher frequencies display any sizeable standardized residuals. To sum up, LLM allows us to (i) identify the variables with the most important higher-order interactions, (ii) select a parsimonious model that fits the observed data well with a minimum number of parameters, and (iii) confirm the fit and detect potential outliers using standardized residuals. Whenever the user is interested in conducting a roll-up operation or a simple exploration of the initial cube, then the identified parsimonious model will be used to provide an approximation of the observed data. Moreover, we believe that the highest-order effects can be exploited to notify the user/analyst of the most important associations that hold among dimensions. They can also be used for cube substitution as follows: • Take the highest-order effects retained by the model selection technique • Build as many sub-cubes as there are highest-effect terms in the hierarchical parsimonious model. • Replace the initial data cube with the defined sub-cubes. 4.3
Example queries
In order to illustrate the impact of the probabilistic models on cube exploration and approximation, let us apply the following OLAP queries to our illustrative example and show how the two models, NMF and LLM, handle them. The first query illustrates the way each probabilistic model may replace the original data cube with smaller and more manageable sub-cubes while the last two queries show dimension selection and a roll-up operation, respectively. 1. Substitution: Counts of firms according to Size, USSX, QI and Duality (the original cube). 2. Selection: Counts according to Size and USSX, for firms with low governance quality (QI= Low), where the CEO is not also Chairman of the Board (Duality= No). 3. Roll-up: Counts of firms according to QI and USSX, aggregated over all other variables. In the case of LLM, the first query will trigger the visualization of two sub-cubes corresponding to the highest-order terms of the parsimonious model, namely QI*Size*USSX and QI*Duality, instead of the original 4-dimensional data cube. Table 6 shows these two sub-cubes. Any query involving only variables from one of the sub-cubes may be applied to that sub-cube only, instead of the original cube, saving both space and computation time.
12
(Data) Size: 1 2 3 4
USSX No Yes 0 0 7 4 11 4 0 0
(NMF) Size: 1 2 3 4
USSX No Yes 2 0 11 5 7 3 1 0
(LLM) Size: 1 2 3 4
USSX No Yes 2 0 6 6 8 4 0 0
Table 7: Results from the selection query: Size × USSX for QI=Low and Duality=No. Left: Results on original data; Middle: NMF; Right: LLM.
For the 3-component NMF model, the query triggers the visualization of three sub-cubes corresponding to the three components (see Table 2), each representing one cluster. As noted earlier, only a subset of modalities are represented, and the remaining modalities have an estimated count of 0. With minimal loss in approximation, the first component may in fact be represented along USSX and the subset of Size ∈ {3, 4}, with the remaining dimensions set to QI=High and Duality=No. The second component is also localized and corresponds to another subset of modalities. With minimal loss of approximation it corresponds to a 3-dimensional cube along QI ∈ {Low, M ed}, Size ∈ {2, 3, 4} and Duality, with USSX set to Y es. Both components are sparse, with only 9 and 12 (respectively) non-zero values out of the original 48 cells, that is 81% and 75% sparsity, respectively (see Table 2). Accordingly, since some rows and columns are zero, this greatly simplifies the description of sub-cubes as locally dense components. The third component is essentially the half of the original cube corresponding to USSX=No. It is less sparse than the first two components, but still less than half the size of the original data cube. Note that although there is some overlap between the sub-cubes corresponding to the three components, most cells are represented in one (and at most two) components. This means that queries involving a subset of modalities may query one or two smaller sub-cubes rather than the original data cube. The second query is a selection query: for specific modalities of some dimensions, the distribution of the population along the remaining dimensions is sought. In our example, we are interested in characterizing companies which take the virtuous step of keeping their CEO and Chairman separate (Duality=No), yet, have a low governance quality (QI=Low). For NMF, this query falls outside the range of Component 1. As a consequence, only Components 2 and 3 are invoked. Their values for the relevant cells are simply added to form the answer to the query (Table 7, middle). In LLM, it is necessary to reconstruct the entire data cube from the model, and select data from the estimated cube (Table 7, right). Both models (middle and right) differ somewhat from the original data (left), especially in high frequency cells. The LLM gets a few more cells “right”, but the two active components of the NMF model use only 15 (that is, 8 × 2 − 1) parameters while the log-linear model has 27 parameters. This means that NMF trades off a slightly looser fit for increased compression, while the LLM provides better fit but less compression. Overall, the results of the second query suggest that companies that have low governance quality despite enforcing no duality are medium-sized firms which are typically not listed in a US stock exchange (in about two thirds of cases). The final query is an aggregation query. It can be answered using LLM by conducting a roll-up operation on the first sub-cube shown in Table 6. In the case of NMF, and when the sub-cubes generated by LLM are not materialized, we need to compute the overall data cube estimated from the probabilistic model (LLM or NMF) and perform the aggregation specifically. We illustrate this process on the QI × USSX distribution, aggregated over the other two dimensions. Table 8 displays the results. It is notable that both the 3-component NMF and LLM provide an exact estimation of the observed data. For LLM, this is a side effect of the parameter estimation and model selection procedure. The IPF algorithm ensures that marginals are identical in the model and in the data, and therefore that the answer is exact for any pure (i.e., without any selection on dimensions) roll-up operation. Although there is no such guarantee for the NMF, the results in Table 8 suggest that the approximation can also be excellent. This is because roll-up operations sum over all modalities from one or several dimensions. The approximation errors will then tend to cancel out in the sum. In fact, it is expected that the accuracy will improve with the number of dimensions that are involved in the roll-up. For the same reason, we expect that the approximation will also improve when the aggregation is performed over subsets of modalities rather than full dimensions 13
(Data) QI: Low Med High
USSX No Yes 32 20 65 40 30 27
(NMF) QI: Low Med High
USSX No Yes 32 20 65 40 30 27
(LLM) QI: Low Med High
USSX No Yes 32 20 65 40 30 27
Table 8: Aggregation query for the original data cube (left), NMF (middle) and LLM (right): distribution of firms according to QI and USSX.
(e.g., through a roll-up in a dimension hierarchy). The results obtained for this last query are identical, and excellent, for both models. As illustrated on Table 8, the link between QI and USSX is weak. There appears to be a slightly higher proportion of “High” QI for firms with USSX=Yes versus USSX=No, but this effect is tenuous at best (compare, e.g., with the link between QI and Duality in the second sub-cube in Table 6). In summary, we can see that NMF provides a slightly more parsimonious model but slightly less precise approximation than LLM. Moreover, thanks to its sparse components, NMF seems more suitable for selection queries while LLM seems more appropriate for aggregation queries. Both LLM and NMF may suggest a substitution of an original data cube into sub-cubes that represent either strong higher-order interactions among dimensions in the case of LLM, or clusters of the initial data within the same set of dimensions in the case of NMF. We elaborate on these differences in the next section.
5
Discussion
Both NMF and LLM offer ways to estimate probabilistic models of a data cube. As such, they share some similarities, e.g., Maximum Likelihood estimation and the need to rely on model selection to optimize the trade-off between approximation and compression. However, they implement this trade-off in different ways. They also display a number of key differences. As a consequence, NMF or LLM may be a better choice in some situation, depending on the type of data and the kind of analysis that is conducted. We have seen that essentially all probabilistic models may be positioned between two extremes: the independence model, which offers great compression (i.e., very few parameters) at the expense of approximation quality, and the saturated model, which simply reproduces the data, hence offers perfect approximation but no compression. In our illustrative example, NMF yields a slightly more parsimonious model than LLM, with 23 versus 27 parameters, but the approximation is not as close—the deviance is 39.46 for NMF and 23.06 for LLM. The trade-off is apparent in Figure 2: the independence and saturated models are two extremes and other probabilistic models are positioned in between. The parsimonious log-linear model has essentially the same deviance as the 4-component NMF, with fewer parameters, hence a better AIC. As both models are probabilistic models, they associate a probability to each cell in the data cube. This is very helpful to detect outliers by comparing the observed count in one cell with the expected frequency according to the modeled probability. One way to capture this is to compute the standardized residuals. This is commonly done in log-linear modeling packages. Another possibility is to use the fact that both models yield a multinomial probability distribution. One can then compute the probability associated with the count in each cell, according to the model. Outliers correspond to very improbable counts. NMF and LLM have some significant differences. LLM is designed to identify interactions between dimensions, so that weak interactions may be discarded from the working space of the user. With NMF, the initial data cube may be expressed as a superposition of several homogeneous sub-cubes, so that the user may identify clusters in the data and focus on one particular group at a time rather than the population as a whole. With both models, we break down a complex data analysis problem into a set of smaller sub-problems. Users thus have a reduced set of data to analyze, and may be able to better capture the knowledge behind the manipulated data. In the data warehousing framework, this reasoning means that the initial data cube to be explored would be replaced by a set of sub-cubes that may help reduce distracting and irrelevant elements. These sub-cubes reflect the strongest associations discovered by LLM or the components generated by NMF. This was illustrated by our first query in Section 4.3.
14
100 40
60
NMF (C=2)
NMF (C=3) NMF (C=4)
log−linear
20