Florentina I. Popovici. A dissertation submitted in partial fulfillment of the
requirements for the degree of. Doctor of Philosophy. (Computer Sciences) at the.
DATA-DRIVEN MODELS IN STORAGE SYSTEM DESIGN
by Florentina I. Popovici
A dissertation submitted in partial fulfillment of the requirements for the degree of
Doctor of Philosophy (Computer Sciences)
at the
UNIVERSITY OF WISCONSIN–MADISON
2007
i I would like to thank to my advisors Andrea Arpaci-Dusseau and Remzi Arpaci-Dusseau for guiding me through the graduate studies program. Those who have gone through the same process know very well how invaluable is the role of the advisor. I have been very lucky to benefit from advice from two excellent ones. David DeWitt and Mark Hill, the other members of my committee offered great support and guidance, and for that I thank them also. Having them on my committee helped me think more about my research outside of the operating system umbrella. The classes I took here at University of Wisconsin-Madison gave me a solid base to build on when doing research. Thank you Bart Miller, Charles Fisher, David DeWitt (after taking your classes I will always have a soft spot for databases), Guri Sohi, Ras Bodik for a wonderful teaching job and for unveiling numerous insights. A special thank you to Irina Athanasiu, my advisor in my undergraduate studies, for planting the early seeds of my interest in doing research. You will be missed by all the students you wisely advised and by many others who would not be able to benefit from your guidance. Life in graduate school would have been so much different without colleagues and friends here in Madison. Brainstorming sessions, all nighters before deadlines, ice cream breaks, terrace outings, updates about the Packers and Badgers, to name a few, all were invaluable. Not lastly, I thank you my family for continuous and unconditional support.
DISCARD THIS PAGE
ii
TABLE OF CONTENTS Page LIST OF TABLES . . . . . . . . . . . . . . . . . . . . . . . . . . . . . . . . . . . . . . .
v
LIST OF FIGURES . . . . . . . . . . . . . . . . . . . . . . . . . . . . . . . . . . . . . .
vi
ABSTRACT . . . . . . . . . . . . . . . . . . . . . . . . . . . . . . . . . . . . . . . . . .
xi
1
Introduction . . . . . . . . . . . . . . . . . . . . . . . . . . . . . . . . . . . . . . . .
1
1.1 1.2 1.3 1.4 1.5 1.6
1 2 3 4 8 9
2
. . . . . .
. . . . . .
. . . . . .
. . . . . .
. . . . . .
. . . . . .
. . . . . .
. . . . . .
. . . . . .
. . . . . .
. . . . . .
. . . . . .
. . . . . .
. . . . . .
. . . . . .
. . . . . .
. . . . . .
. . . . . .
Application Specific Data-Driven Models . . . . . . . . . . . . . . . . . . . . . . . . 11 2.1 2.2 2.3
2.4 3
The Problem: Complex Layers, Simple Interfaces A Strawman Solution: Better Interfaces . . . . . A Better Solution: Data-Driven Models . . . . . Case Studies . . . . . . . . . . . . . . . . . . . . Summary of Contributions . . . . . . . . . . . . Overview of the Dissertation . . . . . . . . . . .
Motivation and Definition . . . . . . . . . . . . . . Disk Background . . . . . . . . . . . . . . . . . . Input Parameters for a Data-Driven Model of a Disk 2.3.1 History of Requests . . . . . . . . . . . . . 2.3.2 Inter-request Distance . . . . . . . . . . . 2.3.3 Request Size . . . . . . . . . . . . . . . . 2.3.4 Think Time . . . . . . . . . . . . . . . . . 2.3.5 Operation Type . . . . . . . . . . . . . . . Summary . . . . . . . . . . . . . . . . . . . . . .
. . . . . . . . .
. . . . . . . . .
. . . . . . . . .
. . . . . . . . .
. . . . . . . . .
. . . . . . . . .
. . . . . . . . .
. . . . . . . . .
. . . . . . . . .
. . . . . . . . .
. . . . . . . . .
. . . . . . . . .
. . . . . . . . .
. . . . . . . . .
. . . . . . . . .
. . . . . . . . .
. . . . . . . . .
11 14 15 17 18 19 19 20 20
File System Level I/O Scheduling . . . . . . . . . . . . . . . . . . . . . . . . . . . . 21 3.1 3.2 3.3
I/O Scheduling Background . . . . . . . . . . . . . . . . . . . . . . . . . . . . . 21 A Different Approach . . . . . . . . . . . . . . . . . . . . . . . . . . . . . . . . . 23 The SMTF Scheduler . . . . . . . . . . . . . . . . . . . . . . . . . . . . . . . . . 24
iii
Page 3.4
3.5 3.6
3.7
3.8 4
Application Level Freeblock Scheduling 4.1 4.2 4.3 4.4 4.5
5
Reducing Input Parameters for The Disk Mimic 3.4.1 Input Parameters . . . . . . . . . . . . 3.4.2 Measured Service Times . . . . . . . . Methodology . . . . . . . . . . . . . . . . . . Off-Line Configuration . . . . . . . . . . . . . 3.6.1 Summary Data . . . . . . . . . . . . . 3.6.2 Number of Samples . . . . . . . . . . . 3.6.3 Interpolation . . . . . . . . . . . . . . 3.6.4 Disk Characteristics . . . . . . . . . . On-Line Configuration . . . . . . . . . . . . . 3.7.1 General Approach . . . . . . . . . . . 3.7.2 Experimental Results . . . . . . . . . . Summary . . . . . . . . . . . . . . . . . . . .
. . . . . . . . . . . . .
. . . . . . . . . . . . .
. . . . . . . . . . . . .
. . . . . . . . . . . . .
. . . . . . . . . . . . .
. . . . . . . . . . . . .
. . . . . . . . . . . . .
. . . . . . . . . . . . .
. . . . . . . . . . . . .
. . . . . . . . . . . . .
. . . . . . . . . . . . .
. . . . . . . . . . . . .
. . . . . . . . . . . . .
. . . . . . . . . . . . .
. . . . . . . . . . . . .
. . . . . . . . . . . . .
. . . . . . . . . . . . .
. . . . . . . . . . . . .
. . . . . . . . . . . . .
25 26 28 29 32 32 36 36 40 43 43 44 45
. . . . . . . . . . . . . . . . . . . . . . . . 46
Freeblock Scheduling Background . . . . . . . . . . . . . . . . . . . Application Level I/O Scheduling . . . . . . . . . . . . . . . . . . . Using the Disk Mimic for Freeblock Scheduling at Application Level Experimental Results . . . . . . . . . . . . . . . . . . . . . . . . . . Summary . . . . . . . . . . . . . . . . . . . . . . . . . . . . . . . .
. . . . .
. . . . .
. . . . .
. . . . .
. . . . .
. . . . .
. . . . .
46 49 50 51 52
Log Skipping for Synchronous Disk Writes . . . . . . . . . . . . . . . . . . . . . . . 53 5.1
5.2 5.3
5.4
5.5
Background . . . . . . . . . . . . . . . . . . . . . 5.1.1 Synchronous Disk Writes . . . . . . . . . 5.1.2 Logging . . . . . . . . . . . . . . . . . . . Performance Issues with Synchronous Disk Writes Log Skipping . . . . . . . . . . . . . . . . . . . . 5.3.1 Disk Head Position . . . . . . . . . . . . . 5.3.2 Space Allocation . . . . . . . . . . . . . . 5.3.3 Crash Recovery . . . . . . . . . . . . . . . Building the Disk Model . . . . . . . . . . . . . . 5.4.1 Skip Distance . . . . . . . . . . . . . . . . 5.4.2 Request Size . . . . . . . . . . . . . . . . 5.4.3 Think Time . . . . . . . . . . . . . . . . . 5.4.4 Model Predictions . . . . . . . . . . . . . Experimental Setup . . . . . . . . . . . . . . . . . 5.5.1 Implementation . . . . . . . . . . . . . . . 5.5.2 Workload . . . . . . . . . . . . . . . . . .
. . . . . . . . . . . . . . . .
. . . . . . . . . . . . . . . .
. . . . . . . . . . . . . . . .
. . . . . . . . . . . . . . . .
. . . . . . . . . . . . . . . .
. . . . . . . . . . . . . . . .
. . . . . . . . . . . . . . . .
. . . . . . . . . . . . . . . .
. . . . . . . . . . . . . . . .
. . . . . . . . . . . . . . . .
. . . . . . . . . . . . . . . .
. . . . . . . . . . . . . . . .
. . . . . . . . . . . . . . . .
. . . . . . . . . . . . . . . .
. . . . . . . . . . . . . . . .
. . . . . . . . . . . . . . . .
. . . . . . . . . . . . . . . .
53 54 55 56 56 57 57 58 58 61 61 62 64 67 67 68
iv
Page 5.6
5.7 6
6.5
. . . . . .
. . . . . .
. . . . . .
. . . . . .
. . . . . .
. . . . . .
. . . . . .
. . . . . .
. . . . . .
. . . . . .
. . . . . .
. . . . . .
. . . . . .
. . . . . .
. . . . . .
. . . . . .
. . . . . .
. . . . . .
. . . . . .
. . . . . .
. . . . . .
. . . . . .
. . . . . .
. . . . . .
. . . . . .
70 70 71 73 77 79
Small Writes in RAID-5 . . Stripe Aligned Writes . . . . RAID-5 Data-Driven Model Experimental Setup . . . . . 6.4.1 Evaluation . . . . . Summary . . . . . . . . . .
. . . . . .
. . . . . .
. . . . . .
. . . . . .
. . . . . .
. . . . . .
. . . . . .
. . . . . .
. . . . . .
. . . . . .
. . . . . .
. . . . . .
. . . . . .
. . . . . .
. . . . . .
. . . . . .
. . . . . .
. . . . . .
. . . . . .
. . . . . .
. . . . . .
. . . . . .
. . . . . .
. . . . . .
. . . . . .
. . . . . .
. . . . . .
. . . . . .
. . . . . .
81 83 86 87 87 89
Related Work . . . . . . . . . . . . . . . . . . . . . . . . . . . . . . . . . . . . . . . 90 7.1 7.2 7.3
8
. . . . . .
Stripe Aligned Writes in RAID-5 . . . . . . . . . . . . . . . . . . . . . . . . . . . . 81 6.1 6.2 6.3 6.4
7
5.5.3 Environment . . . . . . . Log Skipping Results . . . . . . . 5.6.1 Validating the Disk Model 5.6.2 Impact of Request Size . . 5.6.3 Impact of Think Time . . Summary . . . . . . . . . . . . .
Disk Modeling . . . . . . . . . . . . . Disk Scheduling . . . . . . . . . . . . . Logging . . . . . . . . . . . . . . . . . 7.3.1 Write Everywhere File Systems
. . . .
. . . .
. . . .
. . . .
. . . .
. . . .
. . . .
. . . .
. . . .
. . . .
. . . .
. . . .
. . . .
. . . .
. . . .
. . . .
. . . .
. . . .
. . . .
. . . .
. . . .
. . . .
. . . .
90 92 92 93
Conclusions . . . . . . . . . . . . . . . . . . . . . . . . . . . . . . . . . . . . . . . . 95 8.1 8.2 8.3
Lessons Learned . . . . . . . . . . . . . . . . . . . . . . . . . . . . . . . . . . . 96 Future Work . . . . . . . . . . . . . . . . . . . . . . . . . . . . . . . . . . . . . . 101 Summary . . . . . . . . . . . . . . . . . . . . . . . . . . . . . . . . . . . . . . . 103
LIST OF REFERENCES . . . . . . . . . . . . . . . . . . . . . . . . . . . . . . . . . . . 106
DISCARD THIS PAGE
v
LIST OF TABLES Table
Page
3.1
Disk Characteristics. Configurations of eight simulated disks. Times for rotation, seek, and head and cylinder switch are in milliseconds, the cylinder and track skews are expressed in sectors. The head switch time is 0.79 ms. In most experiments, the base disk is used. . . . . . . . . . . . . . . . . . . . . . . . . . . . . . . . . . . . . . 30
3.2
Allowable Error for Interpolation. The table summarizes the percentage within which an interpolated value must be relative to the probed value in order to infer that the interpolation is successful. As more check points are performed between two inter-request distances, the allowable error increases. The numbers were gathered by running a number of different workloads on the simulated disks and observing the point at which performance with interpolation degrades relative to that with no interpolation. . . . . . . . . . . . . . . . . . . . . . . . . . . . . . . . . . . . . . . . 38
DISCARD THIS PAGE
vi
LIST OF FIGURES Figure
Page
2.1
Common Setup of the Storage System. This figure shows an example of a possible setup for a data intensive storage system. The layers that make up the system are connected through narrow interfaces, that expose little information about the layers. . 12
3.1
Distribution of Off-Line Probe Times for Three Inter-Request Distances. Each graph shows a different inter-request distance: 132 KB, 224 KB, and 300 KB. Along the x-axis, we show each of the 1000 probes performed (sorted by time) and along the y-axis we show the time taken by that probe. These times are for an IBM 9LZX disk. . 27
3.2
Sensitivity to Summary Metrics. This graph compares the performance of a variety of scheduling algorithms on the base simulated disk and the week-long HP trace. For the SMTF schedulers, no interpolation is performed and 100 samples are obtained for each data point. The x-axis shows the compression factor applied to the workload. The y-axis reports the time spent at the disk. . . . . . . . . . . . . . . . . . . . . . . 31
3.3
Demerit Figures for SMTF with Probability, Mean, and Maximum Summary Metrics. Each graph shows the demerit figure for a different summary metric. These distributions correspond to the one day from the experiments shown in Figure 3.2 with a compression factor of 20. . . . . . . . . . . . . . . . . . . . . . . . . . . . . . . . . 33
3.4
Sensitivity to Number of Samples. The graph shows that the performance of SMTF improves with more samples. The results are on the simulated disk and the week-long HP trace with a compression factor of 20. The x-axis indicates the number of samples used for SMTF. The y-axis shows the time spent at the disk. . . . . . . . . . . . . . . . 34
3.5
Mean Values for Samples as a Function of Inter-request Distance. The graph on top shows the mean time for the entire set of inter-request distances on our simulated disk. The graph on the bottom shows a close-up for inter-request distances; other distances have qualitatively similar saw-tooth behavior. . . . . . . . . . . . . . . . . 35
vii
Figure
Page
3.6
Sensitivity to Interpolation. The graph shows performance with interpolation as a function of the percent of allowable error. Different lines correspond to different numbers of check points, N. The x-axis is the percent of allowable error and the yaxis is the time spent at the disk. These results use the base simulated disk and the week-long HP trace with a compression factor of 20. . . . . . . . . . . . . . . . . . . 37
3.7
Sensitivity to Disk Characteristics. This figure explores the sensitivity of scheduling performance to the disk characteristics shown in Table 3.1. Performance is shown relative to greedy-optimal. We report values for SMTF using interpolation. The performance of SMTF without interpolation (i.e., all probes) is very similar. . . . . . . . . 40
3.8
Real Disk Performance. This graph shows the slowdown of C-LOOK when compared to the SMTF configured off-line. The workload is a synthetically generated trace and the numbers are averages over 20 runs. The standard deviation is also reported. The x-axis shows the maximum inter-request distance existent in the trace and the y-axis reports the percentage slowdown of the C-LOOK algorithm. . . . . . . . . 41
3.9
Performance of On-Line SMTF. The first graph compares the performance of different variations of on-line SMTF; the performance of the last day of the week-long HP trace is shown relative to off-line SMTF. The second graph shows that the performance of Online-Set improves over time as more inter-request distances are observed. . . . . 42
4.1
Workload Benefits with Freeblock Scheduling. The leftmost bar shows the foreground traffic with no competing background traffic, the middle bar with competing traffic and no freeblock scheduler, and the rightmost bar with the freeblock scheduler.
52
5.1
Individual Service Times for 4 KB Requests. This graphs plots sorted individual service times for requests of size 4 KB. The requests are issued sequentially, with no think time, and the skip distance is 0. The disk used for experiments has a maximum rotation latency of 6 ms. Most of the requests have a high service time, larger than a full rotation. The average service time for these requests is 6.13 ms. . . . . . . . . . . 59
5.2
Average Service Times for 4 KB Requests. These graphs plot the average service times for requests with a size of 4 KB, when the skip distance varies. The graph on the top explores skip distances between -5 MB and 5 MB. We observe the ’sawtooth’ profile of the graph, explained by the varying amounts of rotational latency incurred by the requests. The graph on the bottom is a zoom in for skip distances between -200 KB and 200 KB. We notice that the minimum average service time occurs for a skip distance of 28 KB. . . . . . . . . . . . . . . . . . . . . . . . . . . . . . . . . . . 60
viii
Figure
Page
5.3
Average Service Time for Requests when the Request Size Varies. We plot the average service time for different request sizes, for two skip distances. The graph on the top plots the service time for a 0 KB skip distance and the graph on the bottom plots the service time for a 28 KB skip distance. We observe a smooth ascending curve for service times associated with a 0 KB skip distance, while the graph on the bottom shows a more irregular pattern. . . . . . . . . . . . . . . . . . . . . . . . . . . . . . 63
5.4
Average Service Time for Requests when the Request Size and Skip Distance Varies. The graph shows larger service times as the request size increases. There are three plateaus with transition points around 28 KB and 144 KB. The transition between the plateaus happens at different values for the skip distance. . . . . . . . . . 64
5.5
Choices for Skip Distance when the Request Size Varies. This graph shows which skip distance will be recommended by miniMimic when the request size varies. We notice that miniMimic will choose different skip distances for different request sizes. Figure 5.3 and 5.4 show that the difference in the service time for different skip distances is noticeable. . . . . . . . . . . . . . . . . . . . . . . . . . . . . . . . . . . . 65
5.6
Average Service Time for 4 KB Requests when the Think Time Varies. The graph plots average service times when the think time varies and the skip distance is 0 KB. The graph shows a periodic pattern, as the amount of rotational latency varies between minimum and maximum values. With no think time the requests incur large rotational latencies, but as the think time increases the service time decreases because the target sectors are closer to the disk head. The disk has a rotational latency of 6 ms, which is reflected in the periodic pattern. . . . . . . . . . . . . . . . . . . . 66
5.7
Average Service Time for 4 KB Requests when the Think time and Skip Distance Varies. The average service times associated with different think times varies with a more complex pattern compared to the one observed when varying the request size. . . 67
5.8
MiniMimic Skip Distance Recommendations for SCSI Disk 1. MiniMimic predictions for the skip distance to be used when a request has a given request size and is preceded by a given think time, for the SCSI IBM 9LZX disk. The shape of the graph is highly irregular. . . . . . . . . . . . . . . . . . . . . . . . . . . . . . . . . . . . . 68
5.9
MiniMimic Skip Distance Recommendations for SCSI Disk 2. MiniMimic predictions for the skip distance to be used when a request has a given request size and is preceded by a given think time, for the second SCSI IBM 9LZX disk. . . . . . . . . . 69
ix
Figure
Page
5.10 MiniMimic Skip Distance Recommendations for IDE Disk. The graph plots the MiniMimic predictions for the skip distance to be used when a request is characterized by a given request size and preceded by a given think time, for the IDE Western Digital WDC WD1200BB drive. Similar to the SCSI disk the shape of the graph is irregular, though the curve is less complex. . . . . . . . . . . . . . . . . . . . . . . . . . . . . 70 5.11 Predicted Versus Actual Service Times. This graph plots the actual service times versus predicted service times for a request size of 8 KB. The line labeled ’actual’ plots the sorted values of the service times for the individual requests. The actual and predicted averages are within 1% of each other. . . . . . . . . . . . . . . . . . . . . 71 5.12 Performance Improvements when the Size of the Requests Varies - SCSI Disk 1. The graph shows the bandwidth (y-axis) when the size of the requests varies (xaxis) and there is no think time. Each bar in the group of bars represents one log optimization configuration: no optimization, checksumming, skipping, and checksumming and skipping together. Each configuration sees an increase in performance when the request size increases, as the positioning costs are amortized. In general, log skipping performs better than transactional checksumming and pairing both skipping and checksumming yields the best performance improvement. . . . . . . . . . . . . . . . 72 5.13 Performance Improvements when the Size of the Requests Varies - SCSI Disk 2. The graph shows the bandwidth (y-axis) when the size of the requests varies (x-axis) and there is no think time and when we use the second SCSI disk. The behavior is similar to the first SCSI disk. . . . . . . . . . . . . . . . . . . . . . . . . . . . . . . . 73 5.14 Performance Improvements when the Size of the Requests Varies - IDE Disk. The graph shows bandwidth (y-axis) when the request size varies (x-axis) and when using an IDE disk. The observations are similar to those for the SCSI disk. In contrast to the SCSI disk, we see a performance drop when the request size is larger than 12 blocks, but our data shows this is not a result of miniMimic mispredictions, but rather a characteristic of the disk or device driver. . . . . . . . . . . . . . . . . . . . . . . . 74 5.15 Performance when Application Has Think Time - SCSI Disk 1. The graph plots the bandwidth seen by the application when doing I/O (y-axis) when the workload has think time (x-axis). Transactional checksumming benefits from increased think times up to 5 ms, that reduce the rotational latency incurred by requests. The performance of log skipping alone is sometimes less than transactional checksumming. Log skipping paired with transactional checksumming continues to yield the best performance. . . . 75
x
Figure
Page
5.16 Performance when Application Has Think Time - SCSI Disk 2. The graph plots the bandwidth seen by the application when doing I/O (y-axis) when the workload has think time (x-axis) for the second SCSI disk. When log skipping and transactional checksumming are deployed together, they yield the best performance. . . . . . . . . . 76 5.17 Performance when Application Has Think Time - IDE Disk. The graph plots the bandwidth seen by the application when doing I/O (y-axis) when the workload has think time (x-axis) and when using an IDE disk. The trends are similar to the ones noticed for the SCSI disk. . . . . . . . . . . . . . . . . . . . . . . . . . . . . . . . . 77 6.1
RAID-5 Configuration. This figure shows an example of the block layout in a RAID5 left asymmetric configuration. The stripe spans 3 data disks, and there is one parity disk per stripe. . . . . . . . . . . . . . . . . . . . . . . . . . . . . . . . . . . . . . . 82
6.2
Layered Environment. This figure shows an example of a common encountered environment, where applications are ran on guest operating systems that operate in a virtualized environment. At the lower level of the storage system we have a RAID system, present for reliability and performance reasons. . . . . . . . . . . . . . . . . 84
6.3
Determining Stripe Size. This figure shows the write bandwidth obtained when requests from the guest OS are grouped into stripes of differing sizes. The experiments were run on a RAID-5 system with three data disks, a chunk size of 16 KB, and a stripe size of 48 KB. As desired, RAID-Mimic finds that the best bandwidth occurs when the requests are aligned and grouped into requests of size 48 KB. . . . . . . . . . . . . . 85
6.4
Specialization for RAID-5. This experiment shows the benefit of using RAID-Mimic to specialize the I/O of the guest OS to RAID-5. The four lines correspond to the four combinations of whether or not the OS or VMM attempts to align writes to the stripe size of the RAID-5. The guest OS runs a synthetic workload in which it performs sequential writes to 500 files; the average file size within the experiment is varied along the x-axis. Smaller file sizes do not see performance improvements from the technique because the workload does not generate whole stripes. . . . . . . . . . . . . 88
xi
ABSTRACT Systems with high data demands depend on the efficiency of the storage system to reach the high performance that is expected from them. Unfortunately, because of the way these systems evolve, this is not easy to achieve. Storage systems are expected to act as a monolithic unit, but they are actually constructed as a stack of layers that communicate through narrow interfaces. Because the information that flows between the layers is limited, it is difficult to implement many desirable optimizations. We propose to use data-driven models to alleviate this lack of information. These models are empirical models that observe the inputs and outputs of the system being modeled, and then predict its behavior based on those previous observations. We particularly focus on data-driven models for disks, as good disk usage can improve the performance of a system by orders of magnitude. It is difficult to model disks because of their intrinsic complexity. The demands of deploying data-driven models on-line, in a running system, adds to the challenge of modeling storage devices. The data-driven models we develop are tailored to the specific applications that use them. This allows us to build simplified models and to integrate them more seamlessly in an existing system. For example, we built such models to aid in decisions made by a throughput-optimizing I/O scheduler at the operating system level or to help lay out a write-ahead log on disk such that synchronous write requests do not incur unnecessary and expensive rotational latency overhead. We explore
xii how to build models for different devices by building a partial data-driven model of a RAID-5 storage system, and use it to perform stripe-aligned writes. In this dissertation we build data-driven models and use them in scheduling and layout applications at the operating system and application level. Additionally we leverage experience from modeling disk drives to model more complex storage systems as RAIDs. This allows us to validate the generality of out approach. Through experiments we show that data-driven models can bring significant performance improvements to the systems where they are deployed.
1
Chapter 1 Introduction To reduce the complexity of building and testing software, systems are often organized into layers [22, 42]. Layers have many benefits, as they decompose the problem of building vast software systems into pieces that are easier to develop, reason about, and evolve. Proof of layering’s success is easy to find; simply examine the network stack (with TCP and UDP built on IP built on Ethernet), the storage stack (file systems built on RAID built on disks), or the basic operating environment (an operating system on a virtual machine on the hardware itself) for excellent and compelling examples. Between each layer in a system is a well-defined interface. As Lampson describes, each interface is a “little programming language” [42], informing clients of the interface of the available functionality. Not surprisingly, getting the “right” interface is a major challenge in the implementation of a layer [8, 25, 42, 75].
1.1
The Problem: Complex Layers, Simple Interfaces Unfortunately, the layered approach breaks down when an individual layer becomes overly
complex while the interface remains simple. Such a combination is problematic as clients have little or no access to the power and capabilities of the layer. The result is that the system cannot exploit the full abilities of its components; too high of a tax has been paid for the simplicity that layering brings.
2 This problem arises prominently today in the storage stack. At the bottom of this stack is a modern disk. Although terrifically complex, disks provide the most bare-boned interface possible: simple reads and writes to blocks organized in a linear array [3, 52, 91]. This read/write interface was successful for a time. By hiding details of disk geometry enabled clients (i.e., file systems) to become simpler and focus solely on the management of higher level issues (e.g., consistency management [26, 32, 33], directory scalability [79], write performance [53]); disks, in turn, improved their raw performance characteristics via more intelligent caching and prefetching [80, 98], rotationally-aware positioning algorithms [54, 67], and other low-level optimizations. Recent work, however, demonstrates that much has been lost due to this simplified disk interface [21, 44, 59, 62, 64, 71, 74, 75]. For example, with traxtents (track aligned extends) [61], the data is allocated and accessed at track boundaries. This approach avoids expensive rotational latency and track switch overheads. Unfortunately, the track boundaries are not exported by the disk, and the only alternative is to go through a lengthy probing phase in order to discover this information.
1.2
A Strawman Solution: Better Interfaces A simplistic solution to this problem would be to simply change interfaces when needed in
order to better expose the current capabilities of a layer. Within a disk system, this would imply a new interface that exposes enough information and control to clients to enable the full utilization of their internal caching, prefetching, scheduling, and other machinery. Unfortunately, changing the interface of a well-established and broadly used layer is no simple task, for the following reasons. First, an interface change mandates a change in all clients that use the interface. Further, wide-scale industry agreement is required. Finally, and perhaps most importantly, determining the “right” interface is the most difficult challenge of all. It is hard (if not impossible) to anticipate all future uses of a layer; similarly, the improper choice of interface will preclude certain internal implementations.
3 Many fields have accepted that not changing an interface is a baseline requirement for research to have practical impact on a field. For example, many in the field of computer architecture focus on microarchictectural improvements, thus enhancing performance or other characteristics beneath a fixed instruction set architecture [18, 76, 99]. Work in networking [11] and virtualization [13, 88] confirms the same viewpoint. Thus, in this dissertation, we assume that the layers in the storage stack may have layers that prevent clients from best utilizing them. We further assume that this interface is not likely to change, at least in any fundamental way, in the near (or distant) future. Thus, we require an approach that will enable a client to make the most of a layer without interface change.
1.3
A Better Solution: Data-Driven Models The approach we advocate is one we call data-driven modeling. With data-driven modeling, a
client uses detailed measurement of a disk (or RAID) to build up a working portrait of its behavior. The client can then use this model to better predict or understand how the disk will behave and thus enable the client to extract its full performance. Thus, a successful model is one that can accurately and with low-overhead predict the behavior of a disk in a given scenario. We build data-driven models in the following basic manner. The requests that are issued to disk are recorded along with relevant input parameters. The requests are timed, and their service time is stored. In the prediction phase, when the model is asked to predict device behavior for a specific request, it looks up how the device reacted when similar requests were issued, and predicts its response based on the recorded history. Our approach is an example of a gray box technique to systems building [8]. When building our data-driven models, we often exploit our knowledge of how disks work in order to make the model more accurate or better performing. These “short cuts” are critical; without them, the overhead of a true black box data-driven approach would be prohibitive, as we will demonstrate. Alternatives are possible. For example, one could exploit the wealth of disk simulators [27] or analytical models [56, 73] in place of our data-driven approach. However, these approaches tend to
4 be too slow (detailed disk simulation often runs much slower than the disk itself) or too inaccurate (overly simplified models cannot capture the needed level of complexity). Thus, the data-driven approach finds a sweet-spot between these two, being both fast enough and accurate enough to enable their use in a running system.
1.4
Case Studies There are many challenges in building data-driven models. For example, what are the important
request parameters to keep track of? How can one integrate these models into a running system, keeping the space and computational overheads low? What characteristics of the device need to be modeled for the policy that uses the model? To answer these questions, we focus on four case studies. The first three case studies revolve around data-driven models for disks. They allow us to explore how to build these models in collaboration with applications with specific needs: I/O scheduling and layout. The fourth case study explores data-driven models for a different device (RAID). The first case study was presented in [49]. The second case study is part of [9]. The initial work for the third case study started in the context of [21]. File System Level I/O Scheduling We start by presenting a data-driven model of a disk that is used at the operating system level by the I/O scheduler. The scheduler optimizes for throughput, and the model is used to predict the service time for the requests that are queued. I/O scheduling at the OS level needs to reach a delicate balance, an ideal scheduler being accurate, simple to implement, and low overhead. There is a tension between these requirements, and thus, current I/O schedulers tip the balance towards the last two, while glossing over the accuracy requirement. We show how a data-driven model can be simple to implement and low overhead, and have increased accuracy. The model we build is used in an on-line manner by the system, is configuration free, and portable. These requirements are aligned with the real life requirements of using a disk model
5 in a running system. Using the model to guide the system to make decisions needs to minimally impact the system. Second, deploying the model should be done without the need to configure it manually. Third, since the system could be deployed on top of any arbitrary disk, the model has to be portable and handle disks with diverse characteristics. One concern in building models is identifying the important parameters to track. We could track all the parameters that might influence the behavior of the disk, but doing so would generate excessive space overhead. Instead, we focus on identifying only the parameters that are needed for predicting the disk behavior for the specific application that uses the model. We take advantage of the implicit knowledge we have about how disks work in general, and for this case study identify two types of parameters that are sufficient for modeling the disk: request type and inter-request distance (a parameter that measures the distance in logical block number in between two requests). This case study allows us to give an example of how these models can be deployed online in a running system, using an arbitrary disk, without having to run an off-line configuration phase or manually tune them. To overcome the lack of information, we use a hybrid approach, where we pair a data-driven model of the disk with a traditional coarse disk model. When the information is not available we use the traditional disk model, but as the model sees more requests, it accumulates more information and is able to make predictions. With this case study we show that it is possible to improve on the performance of the more traditional disk schedulers already available by using a data-driven model that is built in an on-line manner. The model is able to improve on previous ones by being able to incorporate important disk characteristics such as rotational latency, that was not captured by other more simplistic models. Application Level Freeblock Scheduling This case study uses a data-driven model of the disk to perform a different type of I/O scheduling: freeblock scheduling. A freeblock scheduler is able to extract free bandwidth from the disk for background applications such as disk scrubbing, by minimally impacting foreground applications. The main idea of a freeblock scheduler is to make use of the times when the disk does not actually transfer data from the platters. For example, when requests are serviced by the disk, they often incur a rotational latency, which is the time the disk needs to wait for a target sector to come
6 under the disk head. A freeblock scheduler sends background requests to the disk to be serviced while a foreground request incurs the rotational latency. Doing so allows the foreground request to be serviced in the same time as before, while also servicing a background requests. Thus, the disk is better utilized. This type of scheduler needs to use a model of the disk in order to be able to assess if a background request can be issued without affecting a foreground request. The model in this study is used at application level as opposed to operating system level. Scheduling at application level is difficult, as it is pointed out by Lumb et al. [44], who first proposed the freeblock scheduler algorithm. They state that initially they thought that efficient freeblock scheduling can be done only from inside the disk firmware. We are able to leverage our experience from the previous case study and use a model built on the same principles as before. We keep track of the same set of parameters, but this time we use the model predictions to estimate if a background request is going to impact the performance of a foreground request. This case study highlights the difficulties of using a model when there are other intervening layers between the layer that uses the model and the layer that is modeled. Because the model is used at application level, its usage is impacted by the functionality provided by the operating system. Log Skipping for Synchronous Disk Writes The third case study uses a data-driven model of the disk to optimize workloads that perform synchronous writes. While previous case studies looked at scheduling issues, this case study shows how to use the model to guide the layout of data on disk. Synchronous writes are frequently encountered in applications for which data reliability is paramount. These applications want to be sure that the data they write is going to make it to disk in the order it was intended. These precautions are necessary because the operating system can perform write caching for performance reasons, and can delay actual disk writes till a later time even if it reports to the application that the write operation completed successfully. It is obvious that delayed writes combined with a system crash can generate data loss.
7 The problem associated with synchronous writes in a logging environment comes from the fact that they can incur extra rotational latencies. After a synchronous disk write finishes on disk, the disk continues to move under the disk head, and a subsequent write to the next sector on disk needs to wait almost a full rotation in order to complete. This situation transforms a workload that is seemingly sequential in one that has performance similar to a random workload, which can decrease performance by an order of magnitude. This case study provides the opportunity to explore in more detail how to tailor a model for a specific application need. For example, in this case the workload is write intensive and touches only a small part of the disk. Thus, the model focuses on write requests, and it has smaller space requirements because it tracks only the part of the disk that gets touched by the application. For this case study we need to augment the previous disk model with additional parameters. Since the application can have think time, the model needs to take into consideration the time that passes between requests. Stripe Aligned Writes in RAID-5 The fourth case study builds a data-driven model of a RAID-5 system. RAID systems are used to increase the performance and reliability of a storage system. They are composed of two or more disks, and can be configured with different schemes, according to the needs of the application. We focus on RAID-5, a commonly encountered setup for RAIDs. This scheme uses a rotating parity that enables recovery of data if one of the disk fails. The parity blocks are associated with a stripe, which along with the parity constitutes a continuous segment of data that is laid on all the disks part of the RAID. This layout is periodically repeated for the whole RAID. We particularly target the performance regime during update requests. This workload can yield expectantly low performance because the RAID needs to issue additional requests in order to recompute the parity associated with a stripe and thus comply with the reliability contract presented by this RAID scheme. This performance degradation can be alleviated if the I/O scheduler issues requests that update a whole stripe of the RAID instead of just part of it. Unfortunately, at operating system level the
8 scheduler does not have information about the size of the stripe, which is one of the information that is needed in order to perform this optimization. We propose to overcome this problem by using a partial RAID model. The data-driven model determines the stripe size used in the RAID, and this information is incorporated by the I/O scheduler at the operating system level or virtual machine level. The scheduler decides whether to split or merge incoming requests before issuing them to the RAID. By being stripe size aware, the I/O scheduler issues writes for the whole stripe, thus getting around the update parity problem. This case study shows the usage of data-driven models for a device whose characteristics vary vastly from a hard disk device. Despite these differences, there are common lessons that we learned from the previous studies, that are applicable to this case study. Similar to the previous ones, we use timing of I/O requests, and we identify the important input parameters keep track. As previously, we do not build a full RAID model, but we carve out only the portion that is required by the application on hand.
1.5
Summary of Contributions In this dissertation we propose the use of data-driven models in the storage system stack. We
study in more detail how to build models for modern disk drives because of their importance and complexity. Through examination of case studies, we find desirable characteristics of data-driven models. Some of the characteristics are drawn from the way we use the models as an active component of a running system. The models we propose are: • Portable: The models we develop should be able to work on top of any disk drive that is part of a system. This requirement is important, as we want to be able to deploy the models on any system configuration. • Automatically configured at run-time: Building the model automatically facilitates the use of these models without the help of an administrator.
9 • Low overhead: Having the models be an integral part of the system means that they have to integrate seamlessly in the existing systems, and to have minimum interference on them. This should translate both in low overheads of space and computation. One advantage of data-driven models is that they can be tailored for a specific application. For example, we do not model all the characteristics of a disk, but only those ones needed for the application that uses the model. This reduces the complexity of the model, and allows for optimizations in terms of space and computational overheads. We identify the important parameters the models need to track when used for different applications like I/O scheduling or disk layout. Recording all the parameters that could influence the behavior of the disk results in a prohibitive large amount of data to store and large prediction times. We study the use of these models at several layers in the storage stack. As the layer that is modeled is further away from the layer that builds the model, it becomes more difficult to build an accurate model. The problem comes from the fact that each layer in the storage stack is complex and can potentially influence the behavior of the requests that traverse it. Through implementation in a real system and simulations we show that data-driven models can be used in practice and that they increase the performance of the systems where they are deployed. Some previous publications cover some of the work presented in this dissertation [49], or present the incipient ideas for some of the chapters [9], [21], [75].
1.6
Overview of the Dissertation In the next chapter we present the definition of a data-driven model and underline the charac-
teristics that are desirable for these models. We discuss in more detail the parameters that could be considered for building a model of a disk drive. In Chapter 3 we build a model of a disk drive that is used by an operating system I/O scheduler. The scheduler uses the model to predict the service time for the requests that are queued. We present the input parameters that are used by the model, and how they capture the disk behavior.
10 Additionally, we show how we decrease the space requirements for the model by using interpolation. The disk model can be built online or offline, and we present a hybrid scheduling algorithm that helps deploy a model in a system, even if the model did not see enough requests to build a full disk model. Chapter 4 presents an application level scheduler that uses a disk model to decide if requests from the application are going to influence other requests in the system or not. With this case study we explore the use of the previous disk model at a different layer in the storage system. Chapter 5 uses a disk model to guide the layout of data on disk. The disk model differs from the previous ones in the parameters that it considers. Chapter 6 builds a data-driven model of a different device, a RAID system. This model is used by an I/O scheduler to decide whether to split or merge requests. In this chapter we apply lessons learned from building the data-driven disk models to build models for another device, and it helps generalize our experience. We conclude with Chapter 7 where we present related work, and with Chapter 8 where we summarize our findings and talk about future work.
11
Chapter 2 Application Specific Data-Driven Models In this chapter we introduce data-driven models. We start by motivating the use of data-driven models, then define them. Specifically, we discuss how to build a data-driven model for disks. In particular, we talk about the choice of input parameters and how they are incorporated by the model.
2.1
Motivation and Definition A data-driven model is an empirical model that captures the behavior of the device that it
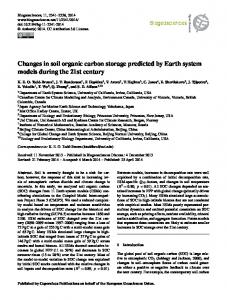
models by observing the inputs that are fed to the device and then reproducing the output that was recorded. We intend to use data-driven models in collaboration with a decision making entity in the system. With the help of the model the policy can make better decisions, because of the increased information available to it. The need for these models becomes obvious when we observe the common setup of a data intensive storage system. Consider as an example a web server hosted in a data center, depicted in Figure 2.1. We can distinguish several layers, stacked on top of each other: 1) application layer - the web server that receives requests for pages from remote clients; 2) operating system layer that performs traditional functions, such as I/O scheduling and caching; 3) virtual machine layer, present since it allows for ease of maintenance, better security, utilization, and portability; 4) RAID storage, for good performance and reliability; 5) hard disks, the final stage of data. All these layers are connected to their adjacent neighbors (usually two, one above and one below in the stack) through a narrow interface that does not allow for significant information transfer
12
Figure 2.1 Common Setup of the Storage System. This figure shows an example of a possible setup for a data intensive storage system. The layers that make up the system are connected through narrow interfaces, that expose little information about the layers. from one layer to another. This setup is beneficial because it provides ease of development and deployment of additional layers, but it also impacts the quality of decisions that can be made. It is difficult to make a decision that involves information about another layer, because that information is usually not easily accessible. For example, let us examine a disk scheduler within an operating system. One basic piece of knowledge such a scheduler requires is how long a given request will take to be serviced by the disk. This information allows the scheduler to reorder requests to minimize overall service times. Unfortunately, this information is not available to the scheduler, which thus typically use approximate heuristics to make scheduling decisions (e.g., least distance first). We propose instead to use a data-driven model of the disk to provide this information to the scheduler. The data-driven models we propose will be deployed in an on-line manner, as part of a running system. In many respects, the requirements of an on-line model are more stringent than those of an off-line model. First, the on-line model shoulda be portable; that is, the model should be able to capture the behavior of any disk drive that could be used in practice. Second, the
13 on-line model should have automatic run-time configuration, since one cannot know the precise characteristics of the underlying device when constructing the model; it is highly undesirable if a human administrator must interact with the model. Finally, the on-line model should have low overhead; the computation and memory overheads of an on-line model should be minimized such that the model does not adversely impact system performance. The use of a data-driven model provides ample opportunities for simplification. The model can be specialized for the problem domain in question. For example, if the model is used by an I/O scheduler, it need not predict the individual seek time, track switch time, or cylinder switch time. The scheduler needs to know only the service time of the requests to reorder them appropriately, and that is the only characteristic of the system that the model needs to predict. A data-driven model does not attempt to simulate the mechanisms or components internal to a layer. Thus, there is no need for in-depth knowledge of how it works. This is especially relevant as layers become more complex, and as they incrementally evolve over short periods of time. Another advantage of data-driven models is the availability of the data used to build the models. This data is readily available: I/O requests flow through the system and they are trivially accessible at the layer they traverse. Data-driven models have been used in the context of artificial intelligence, data mining, machine learning, with applications in fields such as hydroinformatics. We propose their use in the context of operating systems, with specific applications to modeling components of the storage stack. The data-driven models we propose can be built in an on-line or off-line manner. In the off-line case, the model is fully built before the system is deployed. In contrast, building a model on-line requires a start-up phase: the model is built as the system runs and as it sees more requests. In Chapter 3 we present a disk model that is built either off-line or on-line. There are trade-offs for both of these options. Building a model on-line might require time for the model to converge to the final version of the model, as the model gets built. In this start-up phase the model might not be as exact as when it is fully built. In contrast, an off-line model can be used and can give accurate predictions from the moment the system starts. Building the model
14 off-line requires an initial configuration phase, while the on-line version can be used immediately. Another possible advantage of the on-line approach is that the model will capture the characteristics of the current workload and the portion of the device that is exercised by the workload that currently runs, thus minimizing the space taken up by the model and the configuration time. Building the model off-line needs to take a more conservative approach and cover all possible cases and combination of parameters, which might result in wasted space and more time spent to configure it. We build data-driven models using a simple table-based approach, in which input parameters to the simulated device are used to index into a table; the corresponding entry in the table gives the predicted output for the device. A table-based approach is appropriate for on-line simulation because it can portably capture the behavior of a variety of devices, requires no manual configuration, and can be performed with little computational overhead. However, there is a significant challenge as well: to keep the size of the table small, one must identify the input parameters that significantly impact the desired outputs. The method for reducing this input space depends largely upon the domain in which the on-line simulator is deployed. We will address this problem in the upcoming chapters.
2.2
Disk Background Disk drives are complex systems, and modeling them is challenging: they have mechanical
parts that move, and electronic systems for control. Thus, we consider them a good target in studying data-driven models. In this section we present a short introduction on how disk drives function and in the later sections we focus on describing a data-driven model for disks. A disk drive contains one or more platters, where each platter surface has an associated disk head for reading and writing. Each surface has data stored in a series of concentric circles, or tracks. A single stack of tracks at a common distance from the spindle is called a cylinder. Modern disks also contain RAM to perform caching; the caching algorithm is one of the most difficult aspects of the disk to capture and model [73, 98].
15 Accessing a block of data requires moving the disk head over the desired block. The time for this has two dominant components. The first component is seek time, moving the disk head over the desired track. The second component is rotation latency, waiting for the desired block to rotate under the disk head. The time for the platter to rotate is roughly constant, but it may vary around 0.5 to 1% of the nominal rate; as a result, it is difficult to predict the location of the disk head after the disk has been idle for many revolutions. Besides these two important positioning components there are other mechanical movements that need to be accounted for: head and track switch time. A head switch is the time it takes for the mechanisms in the disk to activate a different disk head to access a different platter surface. A track switch is the time it takes to move a disk head from the last track of a cylinder to the first one of the next. The disk appears to its client as a linear array of logical blocks; these logical blocks are then mapped to physical sectors on the platters. This indirection has the advantage that the disk can reorganize blocks to avoid bad sectors and to improve performance, but it has the disadvantage that the client does not know where a particular logical block is located. If a client wants to derive this mapping, there are multiple sources of complexity. First, different tracks have different numbers of sectors; specifically, due to zoning, tracks near the outside of a platter have more sectors (and subsequently deliver higher bandwidth) than tracks near the spindle. Second, consecutive sectors across track and cylinder boundaries are skewed to adjust for head and track switch times; the skewing factor differs across zones as well. Third, flawed sectors are remapped through sparing; sparing may be done by remapping a bad sector (or track) to a fixed alternate location or by slipping the sector (or track) and all subsequent ones to the next sector (or track).
2.3
Input Parameters for a Data-Driven Model of a Disk In this section we describe a data-driven model for hard disks. Given that the model uses a
table-driven approach to predict the time for a request as a function of the observable inputs, the fundamental issue is reducing the number of inputs to the table to a tractable number. Each request is defined by several parameters: whether it is a read or a write, its block number, its size, the time
16 of the request. At one extreme, the model can keep track of all possible combinations of input parameter values, but this leads to a prohibitively large number of input parameters as indices to the table. Additionally, each request could possibly be influenced by the history of requests that were previously issued to the disk. Considering this extra dimension increases the input parameter space even more. For example, for a disk of size 250 GB it could take around 3 TB of space to store information if the model considers request type, block number, size of the request, and interarrival time. We do not want to keep track of all possible combinations of input parameters, and their history, and therefore, we make assumptions about the behavior of the I/O device for the problem domain of interest. Given that our goal is for the model to be portable across the realistic range of disk drives, and not to necessarily work on any hypothetical storage device, we can use high-level assumptions of how disks behave to eliminate a significant number of input parameters. However, the model will make as few assumptions as possible. In the following chapters we present how to use a data-driven model for disks to solve several problems, and we will specialize the model according to the specific problem at hand. The general approach for building the model is to time the requests that are issued to the disk and then fill in the appropriate place in the table associated with the corresponding input parameters that characterize the request. Later on, when requests with the same characteristics are seen by the model, it can predict their behavior based on what it observed previously. In the opinion of Ruemmler and Wilkes [56], the following aspects of the disk should be modeled for the best accuracy: seek time (calculated with two separate functions depending upon the seek distance from the current and final cylinder position of the disk head and different for reads and writes), head and track switches, rotation latency, data layout (including reserved sparing areas, zoning, and track and cylinder skew), and data caching (both read-ahead and write-behind). In the following sections we describe how different input parameters can affect the behavior of the disk. More specifically we are going to present the effect of inter-request distance, request size, think time, and type of request (read or write) on the request service time. These parameters
17 correspond roughly to the parameters that define a request, and thus can give us a good insight about the expected disk behavior under varied inputs.
2.3.1
History of Requests
There are several approaches for incorporating the history of requests, with the two extremes being the following. At one end, the model could keep track of all requests that were issued to the device from the moment the system started. At the other end, the model could look only at the current request issued. The trade-offs for these approaches are the following. If the full history of requests is maintained, the space to hold it will grow prohibitively large. With a full history, the model could capture the behavior of the device better. At the other extreme, if no history is maintained, then the space overhead is reduced, but maybe the accuracy of the model is impacted. We choose a solution in between the two extremes, taking into consideration that we want our models to have a low space overhead and also capture the important characteristics of the device. We base our decision on knowledge about how a disk drive works. As an example, let us assume the disk head has to service two requests, with no think time in between them. From a mechanical movement point of view, in order to service the second request, the disk head has to move from where the first request finished to the beginning of the second request. Thus, intuitively, keeping track of the distance between the two requests is a good indicator of the activity that the disk has to do in order to service the second one. We will look into more detail in the next sections and chapters on how to define the distance and how it captures the disk behavior. Other disk characteristics to consider are think time, the type of request, or how caching and prefetching effects are captured. We discuss think time and type of request in more detail in the next sections. The aspect which we model the least directly is that of general caching. However, the model will capture the effects of simple prefetching, which is the most important aspect of caching for scheduling [97]. For example, if a read of one sector causes the entire track to be cached, then the model will observe the faster performance of accesses with distances less than
18 that of a track. In this respect, configuring the model on-line by observing the actual workload could be more accurate than configuring off-line, since the locality of the workload is captured.
2.3.2
Inter-request Distance
We define the inter-request distance as the logical distance from the first block of the current request to the last block of the previous request. This definition is similar to the one proposed previously by other researchers [98]. We present some of the disk characteristics that are captured by keeping track of this input parameter. Our approach accounts for the combined costs of seek time, head and track switches, and rotation layout, in a probabilistic manner. That is, for a given inter-request distance, there is some probability that a request crosses track or even cylinder boundaries. Requests of a given distance that cross the same number of boundaries have the same total positioning time: the same number of track seeks, the same number of head and/or track switches, and the same amount of rotation. We note that the table-based method for tracking positioning time can be more accurate than that advocated by Ruemmler and Wilkes; instead of expressing positioning time as a value computed as a sum of functions (seek time, rotation time, caching, etc.), the model records the precise positioning time for each distance. The cost incurred by the rotation of the disk has two components: the rotational distance between the previous and current request, and the elapsed time between the two requests (and thus, the amount of rotation that has already occurred). Using inter-request distance probabilistically captures the rotational distance. We refer to the effects of the amount of time elapsed from the last request (think time) in one of the next subsections. Data layout is incorporated fairly well by the model as well. The number of sectors per track and number of cylinders impact our measured values in that these sizes determine the probability that a request of a given inter-request distance crosses a boundary; thus, these sizes impact the probability of each observed time in the distribution. One of the applications we are targeting is I/O scheduling (Chapter 3). Although zoning behavior and bad sectors are not tracked by our model, previous research has shown that this level of detail does not help with scheduling [97].
19
2.3.3
Request Size
Applications can write data in different sizes. Thus, the model must be able to capture the disk behavior when request size varies. The model explores service times for a range of request sizes. One might expect, for a given inter-request distance, that service time will increase linearly with request size, under the assumption that the positioning time is independent of request size and that the transfer time is a linear function of the request size. We show in the next chapters that this expectation holds true for most inter-request distances we have sampled. We propose to deploy the disk model in tandem with a specific application. There are applications where modeling the request size is important, such as an application that writes transactions to a log. In this situation, incorporating the request size in the model is required. Other applications might only issue requests of a given size: for example a disk scrubber that reads 4 KB blocks from the disk. In this situation, the associated model does not need to incorporate the request size as part of the input parameters.
2.3.4
Think Time
Applications often have think time (i.e., computation time) between requests. Thus, the model will see idle time between arriving requests and must account for the fact that the disk platters continue to rotate between these requests. When in off-line mode, the model configures the think time parameter by issuing requests to the disk as it varies the idle time between those requests. In an on-line configuration mode, the model times the think time and records the service time in the corresponding entrance in the table. In Chapter 3 we present how to use a data-driven model of the disk to help a throughput optimizing I/O scheduler make decisions. More specifically, we target data-intensive servers. In this environment the I/O requests have no think time, and thus, the model does not need to track it. Of course, there are other instances when the think time does need to be incorporated, as we show in Chapter 5.
20
2.3.5
Operation Type
The seek time for reads is likely to be less than that for writes, since reads can be performed more aggressively. A read can be performed when a block is not yet quite available because the read can be repeated if it was performed from the wrong sector; however, a write must first verify that it is at the right sector to avoid overwriting other data. In addition, the type of the last operation issued also influences service time [56]. To account for these factors in our table-based model, the request type (read or write) of the current and previous requests is one of the input parameters we keep track of. Caching can also affect the service time of read or write requests. A read cache can store data that was previously accessed from the disk, thus resulting in a shorter service time if the same data is accessed again. A write back cache can delay writing data to disk, resulting in faster disk writes, at the expense of risking loosing data. As mentioned previously, we can capture simple caching and prefetching effects, though we do not specifically model the caching or prefetching policies. Some of the applications we target in the next chapters do not require the model to keep track of operation type as a parameter. For example, in Chapter 5 we study how to optimize the small write problem, and since the workload is write-only, the model does not need to consider operation type as an input parameter.
2.4
Summary In this chapter we introduced data-driven models and we discussed a concrete case of a model
for a disk drive. In particular we looked at the choice of input parameters. In the following chapters we will present a more in-depth discussion of application specific data-driven models.
21
Chapter 3 File System Level I/O Scheduling I/O scheduling is an important optimization in the storage stack, but implementing an efficient I/O scheduler is challenging. In this chapter we address how to implement an I/O scheduler that is aware of the underlying disk technology in a simple, portable, and robust manner. To achieve this goal, we introduce the Disk Mimic, which meets the requirements of a data-driven on-line model for disk scheduling. The Disk Mimic is able to capture the behavior of a disk drive in a portable, robust, and efficient manner. To predict the performance of a disk, the Disk Mimic uses a simple table, indexed by the relevant input parameters to the disk, in this case the type of request and the inter-request distance. The Disk Mimic does not attempt to simulate the mechanisms or components internal to the disk; instead, it simply reproduces the output as a function of the inputs it has observed. We start by giving a short background introduction to I/O scheduling. We then present our approach and the new scheduler we are proposing. We continue by an in depth description of the model that is used in correlation with the scheduler and then we evaluate it in an off-line and on-line setting.
3.1
I/O Scheduling Background An I/O scheduler takes as input a set of I/O requests and it reorders them to accomplish a
target optimization: better throughput, quality of service, fairness, etc. We focus on schedulers that optimize for throughput, which means they try to maximize the number of requests that are serviced by the storage system.
22 There are two main axis along which the scheduler can be improved. One of them focuses on the algorithm used to pick the requests to be issued. These algorithms are complex, and they are recognized in the literature as being NP complete. The classic solution is to use a greedy algorithm, that always picks the next ’best’ request out of the ones that are currently waiting to be scheduled. While this might not be globally optimal, it is preferable because of the lower computational costs. There has been recent research in optimizations along this axis. We are instead targeting improving the information that is used by the scheduler to decide what is the ’best’ request to be picked next. Ideally, the scheduler knows for each request exactly how long it will take to be serviced. Unfortunately this information is not readily available. To service a request the disk has to perform mechanical positioning and electronic adjustments, and thus, predicting the service time from a layer above the disk is non-trivial. The interface to the disk is a simple block based interface, that does not transfer information about the current state of the disk, or service times. In overcoming this information challenge, I/O schedulers took different approaches over time. The underlying theme for all of them is that they obtain the information they need by using a static model of the disk. The model used varied according to changes in disks characteristics. Disk schedulers in the 1970s and 1980s focused on minimizing seek time, given that seek time was often an order of magnitude greater than the expected rotational delay [34, 81, 94]. In the early 1990s, the focus of disk schedulers shifted to take rotational delay into account, as rotational delays and seek costs became more balanced [37, 67, 97]. At the next level of sophistication, a disk scheduler takes all aspects of the underlying disk into account: track and cylinder switch costs, cache replacement policies, mappings from logical block number to physical block number, and zero-latency writes. For example, Worthington et al. demonstrate that algorithms that effectively utilize a prefetching disk cache perform better than those that do not [97]. Many modern disks implement scheduling in the device itself. While this might suggest that file system I/O scheduling is obsolete, there are several reasons why the file system should perform scheduling. First, disks are usually able to schedule only a limited number of simultaneous requests
23 since they have more restrictive space and computational power constraints. Second, there are instances when increased functionality requires the scheduling to be done at file system level. For example, Iyer and Druschel introduce short waiting times in the scheduler to preserve the continuity of a stream of requests from a single process rather than interleaving streams from different processes [36]. Further, Shenoy and Vin implement different service requirements for applications by implementing a scheduling framework in the file system [72].
3.2
A Different Approach As an alternative to the previous approaches, we propose to incorporate the Disk Mimic into
the I/O scheduler. By using a data-driven model of the disk the scheduler can predict which request in its queue will have the shortest positioning time. Although a variety of disk simulators exist [27, 41, 95], most are targeted for performing traditional, off-line simulations, and unfortunately, the infrastructure for performing on-line simulation is fundamentally different. We show that for disk scheduling, two input parameters are sufficient for predicting the positioning time: the logical distance between two requests and the request type. However, when using inter-request distance for prediction, two issues must be resolved. First, inter-request distance is a fairly coarse predictor of positioning time; as a result, there is high variability in the times for different requests with the same distance. The implication is that the Disk Mimic must observe many instances for a given distance and use an appropriate summary metric for the distribution; experimentally, we have found that summarizing a small number of samples with the mean works well. Second, given the large number of possible inter-request distances on a modern disk drive, the Disk Mimic cannot record all distances in a table of a reasonable size. We show that simple linear interpolation can be used to represent ranges of missing distances, as long as some number of the interpolations within each range are checked against measured values. We propose a new disk scheduling algorithm, shortest-mimicked-time-first (SMTF), which picks the request that is predicted by the Disk Mimic to have the shortest positioning time. We
24 demonstrate that the SMTF scheduler can utilize the Disk Mimic in two different ways; specifically, the Disk Mimic can either be configured off-line or on-line, and both approaches can be performed automatically. When the Disk Mimic is configured off-line, it performs a series of probes to the disk with different inter-request distances and records the resulting times; in this scenario, the Disk Mimic has complete control over which inter-request distances are observed and which are interpolated. When the Disk Mimic is configured on-line, it records the requests sent by the running workload and their resulting times. Note that regardless of whether the Disk Mimic is configured off-line or on-line, the simulation itself is always performed on-line, within an active system. We show that the Disk Mimic can be used to significantly improve the throughput of disks with high utilization. Specifically, for a variety of simulated and real disks, C-LOOK and SSTF perform between 10% and 50% slower than SMTF. Further, we demonstrate that the Disk Mimic can be successfully configured on-line; we show that while the Disk Mimic learns about the storage device, SMTF performs no worse than a base scheduling algorithm (e.g., C-LOOK or SSTF) and quickly performs close to the off-line configuration (i.e., after approximately 750,000 requests).
3.3
The SMTF Scheduler We now describe the approach of a new file system I/O scheduler that leverages the Disk Mimic.
We refer to the algorithm implemented by this scheduler as shortest-mimicked-time-first, or SMTF. The basic function that SMTF performs is to order the queue of requests such that the request with the shortest positioning time, as determined by the Disk Mimic, is scheduled next. However, given this basic role, there are different optimizations that can be made. The assumptions that we use for this chapter are as follows. First, we assume that the goal of the I/O scheduler is to optimize the throughput of the storage system. We do not consider the fairness of the scheduler. We believe that the known techniques for achieving fairness (e.g., weighting each request by its age [37, 66]) can be added to SMTF as well.
25 Second, we assume that the I/O scheduler is operating in an environment with heavy disk traffic. Given that the queues at the disk may contain hundreds or even thousands of requests [37, 66], the computational complexity of the scheduling algorithm is an important issue [5]. Given these large queue lengths, it is not feasible to perform an optimal scheduling decision that considers all possible combinations of requests. Therefore, we consider a greedy approach, in which only the time for the next request is minimized [37]. To evaluate the performance of SMTF, we compare to the algorithms most often used in practice: first-come-first-served (FCFS), shortest-seek-time-first (SSTF), and C-LOOK. FCFS simply schedules requests in the order they were issued. SSTF selects the request that has the smallest difference from the last logical block number (LBN) accessed on disk. C-LOOK is a variation of SSTF where requests are still serviced according to their LBN proximity to the last request serviced, but the scheduler picks requests only in ascending LBN order. When there are no more such requests to be serviced, the algorithm picks the request in the queue with the lowest LBN and then continues to service requests in ascending order. To compare our performance to the best possible case, we have also implemented a best-casegreedy scheduler for our simulated disks; this best-case scheduler knows exactly how long each request will take on the simulated disk and greedily picks the request with the shortest positioning time next. We refer to this scheduler as the greedy-optimal scheduler.
3.4
Reducing Input Parameters for The Disk Mimic Given that the Disk Mimic uses a table-driven approach to predict the time for a request as a
function of the observable inputs, the fundamental issue is reducing the number of inputs to the table to a tractable number. If the I/O device is treated as a true black box, in which one knows nothing about the internal behavior of the device, then the Disk Mimic must assume that the service time for each request is a function of all previous requests. Given that each request is defined by many parameters (i.e., whether it is a read or a write, its block number, its size, the time of the
26 request, and even its data value), this leads to a prohibitively large number of input parameters as indices to the table. Therefore, the only tractable approach is to make assumptions about the behavior of the I/O device for the problem domain of interest. Given that our goal is for the I/O scheduler to be portable across the realistic range of disk drives, and not to necessarily work on any hypothetical storage device, we can use high-level assumptions of how disks behave to eliminate a significant number of input parameters; however, the Disk Mimic will make as few assumptions as possible. Our current implementation of the Disk Mimic predicts the time for a request from two input parameters: the request type and the inter-request distance. We define inter-request distance as the logical distance from the first block of the current request to the last block of the previous request. The conclusion that request type and inter-request distance are key parameters agrees with that of previous researchers [56, 83].
3.4.1
Input Parameters
As previously explained, read and write operations take different times to execute. Besides this, as noted in [56, 27] the type of the last operation issued will also influence the service time. In order to account for this in our table-based model we record the request type (read or write) of the current and previous request as one of the input parameters. The other input parameter we track is the inter-request distance between logical block addresses. We note that ordering requests based on the time for a given distance is significantly different than using the distance itself. Due to the complexity of disk geometry, some requests that are separated by a larger logical distance can be positioned more rapidly; the relationship between the logical block address distance and positioning time is not linear. Capturing this characteristic is essential in providing a better I/O scheduler. We mentioned in Chapter 2 how the inter-request distance captures seek and rotation characteristics, as well as the layout characteristics of the disk. Probabilistically, requests with the same inter-request distance will cross the same number of tracks, or incur the same number of cylinder switches. Also, the layout of sectors on disk will be reflected in the time associated
27 132 KB 8 7
Time (ms)
6 5 4 3 2 1 0 0
200
400
600
800
1000
800
1000
800
1000
Number of requests 224 KB 8 7
Time (ms)
6 5 4 3 2 1 0 0
200
400 600 Number of requests 300 KB
8 7
Time (ms)
6 5 4 3 2 1 0 0
200
400
600
Number of requests
Figure 3.1 Distribution of Off-Line Probe Times for Three Inter-Request Distances. Each graph shows a different inter-request distance: 132 KB, 224 KB, and 300 KB. Along the x-axis, we show each of the 1000 probes performed (sorted by time) and along the y-axis we show the time taken by that probe. These times are for an IBM 9LZX disk.
28 The applications that we are targeting, high load storage servers, handle I/O intensive workloads. In these environments the scheduling queues are full, and there is no think time between the I/O requests. If that were not the case, then the performance of the I/O scheduler would not impact the overall performance of the system. Thus, we consider that the think time is constant and equal to zero, and we do not need to incorporate think time as an input parameter. The size of the request is another possible candidate as an input parameter. For the workloads we considered, we did not have to incorporate the request size as an input parameter, since the request sizes did not vary a lot and did not show an impact when comparing service times. It is possible that for other workloads the request size would have to be sampled and possibly be introduced as an input parameter as well. Given the complexity associated with the inter-request distance, we concentrate on the issues related to this input parameter. For different values of the request type, the output of the Disk Mimic has the same characteristics, and thus we do not need to explore all the possible combinations of the two input parameters in our further discussions. Hence when we refer to inter-request distance we assume the request type is fixed.
3.4.2
Measured Service Times
To illustrate some of the complexity of using inter-request distance as predictor of request time, we show the distribution of times observed. For these experiments, we configure the Disk Mimic off-line as follows. The Disk Mimic configures itself by probing the I/O device using fixed-size requests (e.g., 1 KB). For each of the possible inter-request distances covering the disk (both negative and positive), the Disk Mimic samples a number of points of the same distance: it accesses a block the specified distance from the previous block. To avoid any caching or prefetching performed by the disk, the Disk Mimic accesses a random location before each new probe of the required distance. The observed times are recorded in a table, indexed by the inter-request distance and the corresponding operation type.
29 In Figure 3.1 we show a small subset of the data collected on an IBM 9LZX disk. The figure shows the distribution of 1000 samples for three inter-request distances of 132 KB, 224 KB, and 300 KB. In each case, the y-axis shows the request time of a sample and the points along the x-axis represent each sample, sorted by increasing request time. We make two important observations from the sampled times. First, for a given inter-request distance, the observed request time is not constant; for example, at a distance of 132 KB, about 10% of requests require 1.8 ms, about 90% require 6.8 ms, and a few require almost 8 ms. Given this multi-modal behavior, the time for a single request cannot be reliably predicted from only the inter-request distance; thus, one cannot usually predict whether a request of one distance will be faster or slower than a request of a different distance. Nevertheless, it is often possible to make reasonable predictions based upon the probabilities: for example, from this data, one can conclude that a request of distance 132 KB is likely to take longer than one of 224 KB. Second, from examining distributions for different inter-request distances, one can observe that the number of transitions and the percentage of samples with each time value varies across interrequest distances. The number of transitions in each graph corresponds roughly to the number of track (or cylinder) boundaries that can be crossed for this inter-request distance. This data shows that a number of important issues remain regarding the configuration of the Disk Mimic. First, since there may be significant variation in request times for a single interrequest distance, what summary metric should be used to summarize the distribution? Second, how many samples are required to adequately capture the behavior of this distribution? Third, must each inter-request distance be sampled, or is it possible to interpolate intermediate distances? We investigate these issues in Section 3.6.
3.5
Methodology To evaluate the performance of SMTF scheduling, we consider a range of disk drive technol-
ogy, presented in Table 3.1. We have implemented a disk simulator that accurately models seek time, fixed rotation latency, track and cylinder skewing, and a simple segmented cache. The first
30 Configuration 1 2 3 4 5 6 7 8
Base Fast seek Slow seek Fast rotate Slow rotate Fast seek+rot More capacity Less capacity
rotation time 1 cyl 6 0.8 6 0.16 6 2.0 2 0.8 12 0.8 2 0.160 6 0.8 6 0.8
seek cyl track cyl 400 3000 switch skew skew 6.0 8 1.78 36 84 1.32 1.6 1.00 36 46 33.0 40.0 2.80 36 127 6.0 8 1.78 108 243 6.0 8 1.78 18 41 1.32 1.6 1.00 108 136 6.0 8 1.78 36 84 6.0 8 1.78 36 84
sectors per track 272 272 272 272 272 272 544 136
num heads 10 10 10 10 10 10 20 5
Table 3.1 Disk Characteristics. Configurations of eight simulated disks. Times for rotation, seek, and head and cylinder switch are in milliseconds, the cylinder and track skews are expressed in sectors. The head switch time is 0.79 ms. In most experiments, the base disk is used. disk, also named the base disk, simulates a disk with performance characteristics similar to an IBM 9LZX disk. The seek times, cache size and number of segments, head and cylinder switch times, track and cylinder skewing and rotation times are either measured by issuing SCSI commands and measuring the elapsed time, or directly querying the disk, similar to the approach used by Schindler and Ganger [60], or by using the values provided by the manufacturer. The curve corresponding to the seek time is modeled by probing an IBM 9LZX disk for a range of seek distances (measured as the distance in cylinders from the previous cylinder position to the current one) and then curve fitting the values to use the two-function equation proposed by Ruemmler and Wilkes [56]. For short seek distances the seek time is proportional to the square root of the cylinder distance, and for longer distances the seek time is proportional to the cylinder distance. The middle value in the seek column represents the cylinder distance where the switch between the two functions occurs. For example, for the base disk, if the seek distance is smaller than 400 cylinders, we use the square root function. For the other disk configurations we simulate, we start from the base disk and vary different parameters that influence the positioning time. For example, disk configuration number 2 (Fast seek) represents a disk that has a fast seek time and the numbers used to compute the seek curve are adjusted accordingly, as well as the number of sectors that constitute the cylinder skew. Similarly for disk configuration number 4 (Fast rotate) the time to execute a rotation is decreased by a
31 9e+06
FCFS SSTF C_LOOK SMTF min SMTF probabilistic SMTF max SMTF median SMTF mean greedy-optimal
8.5e+06
Time (ms)
8e+06 7.5e+06 7e+06 6.5e+06 6e+06 5.5e+06 5e+06 1
10 Scaling factor
100
Figure 3.2 Sensitivity to Summary Metrics. This graph compares the performance of a variety of scheduling algorithms on the base simulated disk and the week-long HP trace. For the SMTF schedulers, no interpolation is performed and 100 samples are obtained for each data point. The x-axis shows the compression factor applied to the workload. The y-axis reports the time spent at the disk. factor of three and the number of track and cylinder skew sectors are increased. The other disk configurations account for disks that have a slower seek time, slower rotation time, faster seek time, faster rotation time and more or less capacity than the base disk. In addition to using the described simulated disks we also run our experiments on an IBM 9LZX disk. To evaluate scheduling performance, we show results from a set of traces collected at HP Labs [55]; in most cases, we focus on the trace for the busiest disk from the week of 5/30/92 to 6/5/92. For our performance metric, we report the time the workload spent at the disk. To consider the impact of heavier workloads and longer queue lengths, we compress the inter-arrival time between requests. When scaling time, we attempt to preserve the dependencies across requests in the workload by observing the blocks being requested; we assume that if a request is repeated to a block that has not yet been serviced, that this request is dependent on the previous request first completing. Thus, we hold repeated requests, and all subsequent requests, until the previous identical request completes.
32
3.6
Off-Line Configuration The SMTF scheduler can be configured both on-line and off-line. We now explore the case
when the Disk Mimic has been configured off-line; again, although the Disk Mimic is configured off-line, the simulation and predictions required by the scheduler are still performed on-line within the system. As described previously, configuring the Disk Mimic off-line involves probing the underlying disk with requests that have a range of inter-request distances. We note that even when the model is configured off-line, the process of configuring SMTF remains entirely automatic and portable across a range of disk drives. The main drawback to configuring the Disk Mimic off-line is a longer installation time when a new device is added to the system: the disk must be probed before it can be used for workload traffic.
3.6.1
Summary Data
To enable the SMTF scheduler to easily compare the expected time of all of the requests in the queue, the Disk Mimic must supply a summary value for each distribution as a function of the inter-request distance. Given the multi-modal characteristics of these distributions, the choice of a summary metric is not obvious. Therefore, we evaluate five different summary metrics: mean, median, maximum, minimum, and probabilistic, which randomly picks a value from the sampled distribution according to its probability. The results for each of these summary metrics on the base simulated disk are shown in Figure 3.2. For the workload, we consider the week-long HP trace, scaled by the compression factor noted on the x-axis. The graph shows that FCFS, SSTF, and C-LOOK all perform worse than each of the SMTF schedulers; as expected, the SMTF schedulers perform worse than the greedy-optimal scheduler, but the best approach is always within 7% for this workload. These results show that using inter-request distance to predict positioning time merits further attention. Comparing performance across the different SMTF approaches, we see that each summary metric performs quite differently. The ordering of performance from best to worse is: mean, median, maximum, probabilistic, and minimum. It is interesting to note that the scheduling performance
33 Summary metric: Probability Percentage error: 5.4 % 14
probabil disk
12
Time (ms)
10 8 6 4 2 0
0
10000
20000
30000 40000 Ordered requests
50000
60000
Summary metric: Mean Percentage error: 5.8 % 14
mean disk
12
Time (ms)
10 8 6 4 2 0
0
10000
20000
30000 40000 Ordered requests
50000
60000
Summary metric: Maximum Percentage error 21.7 % 14
max disk
12
Time (ms)
10 8 6 4 2 0
0
10000
20000
30000 40000 Ordered requests
50000
60000
Figure 3.3 Demerit Figures for SMTF with Probability, Mean, and Maximum Summary Metrics. Each graph shows the demerit figure for a different summary metric. These distributions correspond to the one day from the experiments shown in Figure 3.2 with a compression factor of 20.
34 9e+06 8.5e+06 FCFS SSTF C_LOOK SMTF greedy-optimal
Time (ms)
8e+06 7.5e+06 7e+06 6.5e+06 6e+06 5.5e+06 5e+06 1
10
100
1000
Samples
Figure 3.4 Sensitivity to Number of Samples. The graph shows that the performance of SMTF improves with more samples. The results are on the simulated disk and the week-long HP trace with a compression factor of 20. The x-axis indicates the number of samples used for SMTF. The y-axis shows the time spent at the disk. of each summary metric is not correlated with its accuracy. The accuracy of disk models is often evaluated according to its demerit figure [56], which is defined as the root mean square of the horizontal distance between the time distributions for the model and the real disk. This point is briefly illustrated in Figure 3.3, which shows the distribution of actual times versus the predicted times for three different metrics: probabilistic, mean, and maximum. As expected, the probabilistic model has the best demerit figure; with many requests, the distribution it predicts is expected to match that of the real device. However, the probabilistic model performs relatively poorly within SMTF because the time it predicts for any one request may differ significantly from the actual time for that request. Conversely, although the maximum value results in a poor demerit figure, it performs adequately for scheduling; in fact, SMTF with maximum performs significantly better than with minimum, even though both have similar demerit figures. Finally, using the mean as a summary of the distribution achieves the best performance, even though it does not result in the best demerit figure; we have found that mean performs best
35
Full Range 14
Mean time of request (ms)
12 10 8 6 4 2 0 -1500
-1000
-500 0 500 Inter-request distance (MB)
1000
1500
Close-up 9
Mean time of request (ms)
8 7 6 5 4 3 -109.4
-109.2
-109 -108.8 Inter-request distance (MB)
-108.6
-108.4
Figure 3.5 Mean Values for Samples as a Function of Inter-request Distance. The graph on top shows the mean time for the entire set of inter-request distances on our simulated disk. The graph on the bottom shows a close-up for inter-request distances; other distances have qualitatively similar saw-tooth behavior. for all other days from the HP traces we have examined as well. Thus, for the remainder of our experiments, we use the mean of the observed samples as the summary data for each inter-request distance.
36
3.6.2
Number of Samples
Given the large variation in times for a single inter-request distance, the Disk Mimic must perform a large number of probe samples to find the true mean of the distribution. However, to reduce the time required to configure the Disk Mimic off-line, we would like to perform as few samples as possible. Thus, we now evaluate the impact of the number of samples on SMTF performance. Figure 3.4 compares the performance of SMTF as a function of the number of samples to the performance of FCFS, C-LOOK, SSTF, and optimal. As expected, the performance of SMTF increases with more samples; on this workload and disk, the performance of SMTF continues to improve up to approximately 10 samples. However, most interestingly, even with a single sample for each inter-request distance, the Disk Mimic performs better than FCFS, C-LOOK, and SSTF.
3.6.3
Interpolation
Although the number of samples performed for each inter-request distance impacts the running time of the off-line probe process, an even greater issue is whether each distance must be explicitly probed or if some can be interpolated from other distances. Due to the large number of potential inter-request distances on a modern storage device (i.e., two times the number of sectors for both negative and positive distances), not only does performing all of the probes take a significant amount of time, but storing each of the mean values is prohibitive as well. For example, given a disk of size 10 GB, the amount of memory required for the table can exceed 800 MB. The size of the table grows liniar with the size of the disk, thus especially for large disks we want to investigate methods to reduce the size of the table. From the point of view of data-driven models, there is no special requirement to use a table based approach for storing the data. An alternative solution can be to curve fit a function accross some of the points sampled by the model, and then use that function to make the predictions. Since our main goal is not to have the best compact representation of the model, we do not focus more on this problem.
37 7e+06 6.8e+06
Time (ms)
6.6e+06 6.4e+06 1 check 5 checks 10 checks No interpolation SSTF C_LOOK
6.2e+06 6e+06 5.8e+06 5.6e+06 0
5
10
15 20 Percent error %
25
30
Figure 3.6 Sensitivity to Interpolation. The graph shows performance with interpolation as a function of the percent of allowable error. Different lines correspond to different numbers of check points, N. The x-axis is the percent of allowable error and the y-axis is the time spent at the disk. These results use the base simulated disk and the week-long HP trace with a compression factor of 20. We also note that it is not necessary that all the entries in the table end up being used. For example, there can be workloads that exercise only a limited number of inter-requests distances. This can be especially true for workloads with high locality. As an optimization, it is common for file systems to try to layout data in such a way that files that are accessed together are places close by on disk also. For example, ext3 allocates files in the same directory together in the same cylinder group. We explore how some distances can be interpolated without making detailed assumptions about the underlying disk. To illustrate the potential for performing simple interpolations, we show the mean value as a function of the inter-request distance in Figure 3.5. The graph on the left shows the mean values for all inter-request distances on our simulated disk. The curve of the two bands emanating from the middle point corresponds to the seek curve of the disk (i.e., for short seeks, the time is proportional to the square root of the distance, whereas for long, the time is linear with distance); the width of the bands is relatively constant and corresponds to the rotation latency of
38 Check Points N 1 2 3 4 5 10
Acceptable Error 1% 2% 5% 10 % 15 % 20 %
Table 3.2 Allowable Error for Interpolation. The table summarizes the percentage within which an interpolated value must be relative to the probed value in order to infer that the interpolation is successful. As more check points are performed between two inter-request distances, the allowable error increases. The numbers were gathered by running a number of different workloads on the simulated disks and observing the point at which performance with interpolation degrades relative to that with no interpolation. the disk. The graph on the right shows a close-up of the inter-request distances. This graph shows that the times follow a distinct saw-tooth pattern; as a result, a simple linear model can likely be used to interpolate some distances, but care must be taken to ensure that this model is applied to only relatively short distances. Given that the length of the linear regions varies across different disks (as a function of the track and cylinder size), our goal is not to determine the particular distances that can be interpolated successfully. Instead, our challenge is to determine when an interpolated value is “close enough” to the actual mean such that scheduling performance is impacted only negligibly. Our basic off-line interpolation algorithm is as follows. After the Disk Mimic performs S samples of two inter-request distances left and right, it chooses a random distance middle between left and right; it then linearly interpolates the mean value for middle from the means for left and right. If the interpolated value for middle is within error percent of the probed value for middle, then the interpolation is considered successful and all the distances between left and right are interpolated. If the interpolation is not successful, the Disk Mimic recursively checks the two smaller ranges (i.e., the distances between left and middle and between middle and right) until either the intermediate points are successfully interpolated or until all points are probed. For additional confidence that linear interpolation is valid in a region, we consider a slight variation in which N points between left and right are interpolated and checked. Only if all N points
39 are predicted with the desired level of accuracy is the interpolation considered successful. The intuition of performing more check points is that a higher error rate can be used and interpolation can still be successful. Figure 3.6 shows the performance of SMTF when distances are interpolated; the graph shows the effect of increasing the number of intermediate points N that are checked, as well as increasing the acceptable error, error, of the interpolation. We make two observations from this graph. First, SMTF performance decreases as the allowable error of the check points increases. Although this result is to be expected, we note that performance decreases dramatically with the error not because the error of the checked distances is increased, but because the interpolated distances are inaccurate by much more. For example, with a single check point (i.e., N = 1) and an error level of 5%, we have found that only 20% of the interpolated values are actually accurate to that level and the average error of all interpolated values increases to 25% (not shown). In summary, when error increases significantly, there is not a linear relationship for the distances between left and right and interpolation should not be performed. Second, SMTF performance for a fixed error increases with the number of intermediate check points N. The effect of performing more checks is to confirm that linear interpolation across these distances is valid. For example, with N = 10 check points and error = 5%, almost all interpolated points are accurate to that level and the average error is less than 1% (also not shown). Table 3.2 summarizes our findings for a wider number of check points. The table shows the allowable error percentage as a function of the number of check points, N, to achieve scheduling performance that is very similar to that with all probes. Thus, the final probe process can operate as follows. If the interpolation of one distance between left and right has an error less than 1%, it is deemed successful. Otherwise, if two distances between left and right have errors less than 2%, the interpolation is successful as well. Thus, progressively more check points can be made with higher error rates to be successful. With this approach, 90% of the distances on the disk are interpolated instead of probed, and yet scheduling performance is virtually unchanged; thus, interpolation leads to a 10-fold memory savings.
40
2.0
FCFS C_LOOK
1.8
SSTF
Slowdown
SMTF
1.6 1.4 1.2 1.0
2
3
4
5
6
7
8
Disk configuration
Figure 3.7 Sensitivity to Disk Characteristics. This figure explores the sensitivity of scheduling performance to the disk characteristics shown in Table 3.1. Performance is shown relative to greedy-optimal. We report values for SMTF using interpolation. The performance of SMTF without interpolation (i.e., all probes) is very similar.
3.6.4
Disk Characteristics
To demonstrate the robustness and portability of the Disk Mimic and SMTF scheduling, we now consider the full range of simulated disks described in Table 3.1. The performance of FCFS, C-LOOK, SSTF, and SMTF relative to greedy-optimal for each of the seven new disks is summarized in Figure 3.7. We show the performance of SMTF with interpolation. The performance of SMTF with and without interpolation is nearly identical. As expected, FCFS performs the worst across the entire range of disks, sometimes performing more than a factor of two slower than greedy-optimal. C-LOOK and SSTF perform relatively well when seek time dominates performance (e.g., disks 3 and 4); SSTF performs better than C-LOOK in these cases as well. Finally, SMTF performs very well when rotational latency is a significant component of request positioning (e.g., disks 2 and 5). In summary, across this range of disks, SMTF always performs better than both C-LOOK and SSTF scheduling and within 8% of the greedy-optimal algorithm. To show that SMTF can handle the performance variation of real disks, we compare the performance of our implementation of SMTF to that of C-LOOK when run on the IBM 9LZX disk.
41
Real disk: comparison SMTF off-line and C_LOOK 1.35
Slowdown C_LOOK
1.3 1.25 1.2 1.15 1.1 1.05 1 0
200
400 600 800 1000 1200 Maximum inter-request distance (MB)
1400
Figure 3.8 Real Disk Performance. This graph shows the slowdown of C-LOOK when compared to the SMTF configured off-line. The workload is a synthetically generated trace and the numbers are averages over 20 runs. The standard deviation is also reported. The x-axis shows the maximum inter-request distance existent in the trace and the y-axis reports the percentage slowdown of the C-LOOK algorithm. On the one week HP trace, we achieve a performance improvement of 8% for SMTF compared C-LOOK and an improvement of 12% if idle time is removed from the trace. This performance improvement is not as significant as it could be for two reasons. First, the IBM 9LZX disk has a relatively high ratio of seek to rotation time; the performance improvement of SMTF relative to C-LOOK is greater when rotation time is a more significant component of positioning. Second, the HP trace exercises a large amount of data on the disk; when the locality of the workload is low as in this trace, seek time further dominates positioning time. To explore the effect of workload locality we create a synthetic workload of random 1 KB reads and writes with no idle time; the maximum inter-request distance is varied, as specified on the x-axis of Figure 3.8. This graph shows that the performance improvement of SMTF relative to C-LOOK varies between 32% and 8% as the inter-request distance varies from 25 MB to 1.3 GB. Given that most file systems (e.g., Linux ext2) try to optimize locality by placing related files in
42 the same cylinder group, SMTF can optimize accesses better than C-LOOK in practice. Thus, we believe that SMTF is a viable option for scheduling on real disks. 1.2
Slowdown
Base-line Pri no Interp Pri with Interp
1.1
Set no Interp Set with Interp
1.0 SSTF
C_LOOK Performance of various hybrid versions
140
SSTF C_LOOK Set SSTF Set SSTF interp Set C_LOOK Set C_LOOK interp
Percentage slowdown %
135 130 125 120 115 110 105 100 1
2
3
4
5
6
Day
Figure 3.9 Performance of On-Line SMTF. The first graph compares the performance of different variations of on-line SMTF; the performance of the last day of the week-long HP trace is shown relative to off-line SMTF. The second graph shows that the performance of Online-Set improves over time as more inter-request distances are observed.
43
3.7
On-Line Configuration We now explore the SMTF scheduler when all configuration is performed on-line. With this
approach, there is no overhead at installation time to probe the disk drive; instead, the Disk Mimic observes the behavior of the disk as the workload runs. As in the off-line version, the Disk Mimic records the observed disk times as a function of its inter-request distance, but in this case it has no control over the inter-request distances it observes.
3.7.1
General Approach
For the on-line version, we assume that many of the lessons learned from off-line configuration hold. First, we continue to use the mean to represent the distribution of times for a given interrequest distance. Second, we continue to rely upon interpolation; note that when the Disk Mimic is configured on-line, interpolation is useful not only for saving space, but also for providing new information about distances that have not been observed. The primary challenge that SMTF must address in this situation is how to schedule requests when some of the inter-request distances have unknown times (i.e., this inter-request distance has not yet been observed by the Disk Mimic and the Disk Mimic is unable to confirm that it can be interpolated successfully). We consider two algorithms for comparison. Both algorithms assume that there is a base scheduler (either C-LOOK or SSTF) which is used when the Disk Mimic does not have sufficient information. The first algorithm, Online-Priority, schedules only those requests for which the Disk Mimic has information. Specifically, Online-Priority gives strict priority to those requests in the queue that have an inter-request distance with a known time; among those requests with known times, the request with the minimum mean time is picked. With Online-Priority, the base scheduler (e.g., C-LOOK or SSTF) is only used when no inter-request distances for the current queue are known. There are two problems with this approach. First, given its preference for scheduling already known inter-request distances, Online-Priority may perform worse than its base scheduler.
44 Second, schedules with a diversity of distances may never be produced and thus the Disk Mimic may never observe some of the most efficient distances. The second algorithm, Online-Set, improves on both of these limitations by using the decision of the base scheduler as its starting point, and scheduling a different request only when the Disk Mimic has knowledge that performance can be improved. Specifically, Online-Set first considers the request that the base scheduler would pick. If the time for the corresponding distance is not known by the Disk Mimic, then this request is scheduled. However, if the time is known, then all of the requests with known inter-request distances are considered and the one with the fastest mean is chosen. Thus, Online-Set should only improve on the performance of the base scheduler and it is likely to schedule a variety of inter-request distances when it is still learning.
3.7.2
Experimental Results
To evaluate the performance of the on-line algorithms, we return to the base simulated disk. The left-most graph of Figure 3.9 compares the performance of Online-Priority and Online-Set, when either C-LOOK or SSTF is used as the baseline algorithm and both with and without interpolation. Performance is expressed in terms of slowdown relative to the off-line version of SMTF. We make three observations from this graph. First, and somewhat surprising, although C-LOOK performs better than SSTF for this workload and disk, SMTF performs noticeably better with SSTF than with C-LOOK as a base; with C-LOOK, the Disk Mimic is not able to observe inter-request distances that are negative (i.e., backward) and thus does not discover distances that are close together. Second, Online-Set performs better than Online-Priority with SSTF as the base scheduler. Third, although interpolation does significantly improve the performance of Online-Priority and of Online-Set with C-LOOK, it leads to only a small improvement with Online-Set and SSTF. Thus, as with off-line configuration, the primary benefit of interpolation is to reduce the memory requirements of the Disk Mimic, as opposed to improving performance.
45 The right-most graph of Figure 3.9 illustrates how the performance of Online-Set improves over time as more inter-request distances are observed. We see that the performance of the OnlineSet algorithms (with and without interpolation) is better than the base-line schedulers of SSTF and C-LOOK even after one day of the original trace (i.e., approximately 150,000 requests). The performance of Online-Set with SSTF converges to within 3% of the off-line version after four days, or only about 750,000 requests.
3.8
Summary In this chapter, we have explored some of the issues of using simulation within the system
to make run-time scheduling decisions; in particular, we have focused on how a disk simulator can automatically model a range of disks without human intervention. We have shown that the Disk Mimic can model the time of a request by simply observing the request type and the logical distance from the previous request and predicting that it will behave similarly to past requests with the same parameters. The inter-request distance captures the combined cost of seek time, head and track switches, as well as rotational latency; the layout of the sectors on disk is incorporated probabilistically as well. Under the workloads we explored, the size of the request did not differentiate as a parameter that needed to be incorporated in the model. Another candidate input parameter for the model, time passed between requests, did not need to be considered, given that the model is used in collaboration with an I/O scheduler. The performance of the I/O scheduler is of interest when there is a data intensive workload, without think times between the requests issued. The Disk Mimic can configure itself for a given disk by either probing the disk off-line or, at a slight performance cost, by observing requests sent to the disk on-line. We have demonstrated that a shortest-mimicked-time-first (SMTF) disk scheduler can significantly improve disk performance relative to FCFS, SSTF, and C-LOOK for a range of disk characteristics.
46
Chapter 4 Application Level Freeblock Scheduling In this chapter we present how the Disk Mimic can be used to implement a specialized scheduler at application level. We start by giving a description of the problem and the scheduler that we are implementing. I/O scheduling at the application level is challenging because acquiring the information needed to decide what request to schedule next is more difficult to obtain. As presented in the previous chapter, I/O scheduling at the OS layer is difficult. By moving the scheduler (at least) one layer further away from the disk, the difficulty of doing scheduling increases even more, since there is another layer (OS) that is traversed by the requests before they reach the disk. We use a data-driven model of the disk that provides the information needed by the scheduler. We present the model that we use and the challenges posed by deploying an application level scheduler. We conclude with results and a summary.
4.1
Freeblock Scheduling Background In this section we present the scheduler that we implemented with the help of the Disk Mimic.
This scheduler was proposed previously by other researchers [43, 44]. A freeblock scheduler is an I/O scheduler that is able to extract free bandwidth from a disk. The scheduler handles traffic coming from two classes of applications: foreground and background applications. The goal is to service the requests made by foreground applications while interleaving requests coming from the background applications. More importantly, this is done while minimally impacting the performance seen by the foreground applications.
47 The idea used by a freeblock scheduler is to take advantage of the rotational latency incurred while servicing foreground requests. In Chapter 2 we presented in detail the main components that contribute to the service time:seek time, rotational time and transfer time. There are other components that are part of the service time (head switch times, track switch times), and there are disk functionalities that can impact the service time (caching, prefetching). For clarity we will concentrate on the simpler case when a service time is composed of only the primary three components enumerated above. During rotational time the disk system is idle and just waits for the target sector to come under the disk head. Ideally, this time would be zero, but once given a certain workload this is difficult to achieve. With freeblock scheduling, background requests are serviced in the time taken by the rotational latency of foreground requests, thus being serviced ’for free’. We now explain in more detail how freeblock scheduling works. For example, let us assume that the last foreground request, FR1 , was serviced at disk location [C1 ,H1 ,S1 ], and that the next one, FR2 , is located at [C2 ,H1 ,S2 ]. In order to service the second request, the disk head needs to move from cylinder C1 to C2 , and then it needs to wait a half rotation (on average), in order to read the data from sector S2 . A background request BR located on the same cylinder and track with FR1 , at [C1 ,H1 ,S1 + 1], could be serviced immediately after it. After servicing BR, the disk head is positioned at [C1 ,H1 ,S1 + 1 + sector length of BR]. In order to service FR2 , the head needs to move to the target cylinder C2 , and then again wait for the disk to rotate to read the target sector needed for FR2 . This time, the amount of rotational latency incurred by FR2 will be smaller, because some of it was used to make a useful data transfer for BR. The service time of FR2 is not affected, and the storage system was able to service three requests, in the same amount of time that it would have served only the two foreground ones. There are other scenarios for servicing a background request without interfering with the service time of FR2 . Similar to the previous example, the background request can be situated on the same track with FR2 . In this situation, the disk head seeks to the target cylinder, C2 , services BR, and then services FR2 . Another scenario is to seek to another cylinder/track in order service BR,
48 and then seek again to C2 to service FR2 . In this last situation, while still extracting free bandwidth, the disk does extra seeks, and thus, does not make use of all possible available free bandwidth. The amount of free bandwidth that can be extracted from a system depends on several factors. First, the workload dictates the percentage of rotational latency that is available. At one extreme, if the workload is completely composed of sequential requests, opportunities for inserting background requests without affecting the service time of the foreground requests are non-existent. At the other extreme, a random workload of small requests, that access blocks in close proximity (e.g. on the same cylinder block) will incur a lot of rotational latency (e.g., to 60% of the total service time [44]). Second, the scheduling algorithm used to schedule the foreground requests can influence the rotational latency incurred by the foreground requests. Requests scheduled with algorithms similar to C-LOOK, that try to reduce seek times, will have more rotational latency than those scheduled with SATF (Shortest Access Time First). Third, the geometry and generation of the disk will also dictate the amount of the rotational latency that is available. For example, disks optimized for random access have a smaller rotational latency. It is useful to discuss the class of workloads that make up typical background applications. As described in [44], representative applications are disk scrubbing, virus detection and backup applications. A scrubbing application reads blocks from disk and checks that the data stored is still valid. This helps detect disk sectors that go bad and allows the storage system to take proactive action. Virus detection applications do static detection of viruses in files on disk, thus offloading checks that otherwise might have to be done at runtime. Backup applications periodically save data from disk to a different location, protecting against losing data when a disk fails. These applications have in common the facts that they usually have no runtime restrictions, access a large section of the disk, and do not have any preference for the order of access.
49
4.2
Application Level I/O Scheduling I/O scheduling is traditionally performed at the file system or at lower levels, but there are
situations when it is valuable to consider deploying I/O scheduling at the application level. We give three reasons why this is worth exploring. First, application level scheduling allows for finely tailored scheduling policies. Mainstream kernel distributions usually incorporate scheduling techniques that optimize for parameters that are likely to be of interest to a majority of workloads. That is the case, for example, in throughput scheduling, where the goal is to maximize the rate with which the system services requests. There are applications that have special requirements and that are not serviced well by these techniques alone. For example, a video player needs a scheduler that incorporates QoS guarantees, and that can insure that frames are retrieved at a certain rate. Another example is given by the applications we just mentioned at the end of the last section. These background applications could benefit from a freeblock scheduler that is able to better utilize the system resources. Second, the information required to perform a specialized type of scheduling is available most often at application level, and it is lost or difficult to access at lower levels. For example, for freeblock scheduling, the file system would have to be able to distinguish between requests coming from foreground or background requests. Unfortunately, the reverse could also be true. Implementing scheduling at a higher level may require information from scheduling levels underneath (e.g., file system level). We will address these challenges in the next sections. The third reason relates to the actual process of developing and deploying the scheduling technique. It is less error prone to develop at user level rather than at kernel level. This approach will require less familiarity with the kernel code, and less interference with code that could potentially affect the stability of the system. Related to the previous point, once an I/O scheduler implemented at application level proves to be successful it is easier to make the argument to move its functionality to a lower level, for example, at the file system level.
50
4.3
Using the Disk Mimic for Freeblock Scheduling at Application Level There are two main challenges to overcome when implementing a freeblock scheduler at ap-
plication level. As we described in Section 4.1, deciding when to schedule a background request requires detailed information about the disk: the scheduler needs to predict the rotation time associated with a request. This information is not available to layers outside the disk firmware. The initial proposal for the scheduler had it located in the disk firmware and even the authors mention that they believed it could only be done at that level [44] (later, they do proceed to implement it at application level). We address the first challenge by making use of the Disk Mimic. As described in the previous sections, the Disk Mimic can predict average service times for I/O requests. A freeblock scheduler can make use of these predictions. Given a list of background requests, the freeblock scheduler uses its knowledge of the scheduling algorithm (i.e., C-LOOK) to predict where a background request, BR, will be inserted into the scheduling queue. After the scheduler has determined that the request will be inserted between two requests, F Ri and F Rj , it calculates if the background request will harm F Rj . This harm is determined by indexing into the disk timing table D with the linear block distance between the requests; if D(F Ri − F Rj ) ≥ D(F Ri − BR) + D(BR − F Rj ), then the background request does not impact the time for the second foreground request and BR is allowed to proceed. The freeblock scheduler schedules the one background request that has the least impact on the foreground traffic (if any). Then, the scheduler blocks, waiting to be notified by the kernel that the state of the disk queue has changed. When the scheduler wakes, it rechecks whether any background requests can be serviced. The model used for the disk is identical to the one described in Chapter 3. The model is built by timing requests, and the input parameters that it keeps track of are the inter-request distance and the type of request (read or write). The second challenge occurs because the scheduler is at application level. It needs to find out the LBA (logical block address) associated with the block requests issued by the applications, and
51 the state of the I/O scheduling queue at file system level. This information is needed in order to find out what foreground requests are currently considered for scheduling and what sectors on disks need to be accessed. We deal with this challenge by modifying the Linux kernel to expose information about the scheduling queue and about the file offset to LBA translation. At the application level we cannot control the scheduling decisions taken at the operating system level. When a request is issued by the application, it is reordered at the operating system level according to the scheduling policy in use. Thus the actions at the operating system level need to be factored in, such that they do not affect the decisions made at application level. We export information about the scheduling algorithm at operating system level and we use this algorithmic information to issue requests only when the decisions at a lower level would not interfere with those at the application level. For the background applications considered, the workload is read-only, which results in a simplified model. For example, the model does not need to keep track of additional service times for write operations.
4.4
Experimental Results We implemented an application level freeblock scheduler that uses the Disk Mimic and eval-
uated it in a Linux 2.4 environment. The machine used for experiments is a 550 MHz Pentium 3 processor with 1 GB of main memory and four 9 GB 10000 RPM IBM 9LZX SCSI hard drives. To evaluate the freeblock scheduler we use a random-I/O workload in which the disk is never idle: the foreground traffic consists of 10 processes continuously reading small (4 KB) files chosen uniformly at random. The single background process reads from random blocks on disk, keeping 1000 requests outstanding. As seen in Figure 4.1, the random foreground traffic in isolation achieves 0.67 MB/s. If background requests are added without support from the freeblock scheduler, foreground traffic is harmed proportionately, achieving only 0.61 MB/s, and background traffic achieves 0.06 MB/s.
52
0.9 0.8
Background Foreground
Bandwidth (MB/s)
0.7 0.6 0.5 0.4 0.3 0.2 0.1 0 FG only
+BG +BG +FreeSched
Figure 4.1 Workload Benefits with Freeblock Scheduling. The leftmost bar shows the foreground traffic with no competing background traffic, the middle bar with competing traffic and no freeblock scheduler, and the rightmost bar with the freeblock scheduler. However, if background requests use the freeblock scheduler, the foreground traffic still receives 0.66 MB/s, while background traffic obtains 0.1 MB/s of free bandwidth.
4.5
Summary In this chapter we showed that the Disk Mimic can be used to successfully implement freeblock
scheduling at application level. The model required no modifications from its deployment at file system level. However, the freeblock scheduler needed additional information from the file system: scheduling queue state and LBA translation for a file system block.
53
Chapter 5 Log Skipping for Synchronous Disk Writes In this chapter we introduce miniMimic, a specialized model of the disk, that is used to solve the synchronous disk writes problem. We start by presenting background information about synchronous writes and performance issues that can occur in a file system that performs logging. We show how the file system can predict the position of the disk head by using a data-driven model of the disk, and how this is used to solve the synchronous write problem. The model is application specific and, thus, we do not require that the model accurately predicts all aspects of the disk, but only that it can estimate the disk head position when it is within the log. As enumerated in the previous chapters, we have a number of requirements for the log model. First, the model should be accurate for the particular disk being used in the system, but the model does not need to be configurable for an arbitrary, hypothetic disk. We use a data-driven model whose parameters are automatically configured by measuring the time of requests on a particular disk. Furthermore, since the log model will be used on-line within the file system, we would like the model to have low computational costs. This requirement indicates that table-based models is an appropriate choice as well. We describe the model used, present results and conclude with a summary.
5.1
Background We first describe the small synchronous write problem, and then we give a brief tutorial about
how traditional journaling file systems, such as Linux ext3 [85], update a log on disk.
54
5.1.1
Synchronous Disk Writes
Over the years, researchers have introduced a wealth of performance optimizations into file systems, contributing greatly to the current state of the art [26, 32, 33, 45, 53, 69, 79]. For example, the original Berkeley Fast File System (FFS) [45] collocates files within the same directory, greatly reducing read times under access patterns with spatial locality. The Log-structured File System (LFS) [53] organizes all file system data and metadata in a log, hence improving performance by asynchronously writing data to disk in long sequential segments. Finally, SGI’s XFS file system [79] uses B-trees to store file system metadata such as directories; by doing so, performance of workloads that access large directories is greatly enhanced. However, despite these many advances in performance, one important workload remains particularly onerous for current file systems: small, synchronous disk writes. These workloads are often generated by applications (e.g., a database management system) that force data to disk so as to guarantee (a) on-disk persistence or (b) a proper sequencing of writes to enable crash recovery. Unfortunately, synchronous writes perform quite poorly, even for file systems designed to improve write performance [68]; when the application issues an fsync, the file system has no choice but to force data to disk immediately, and thus incurs the cost of a disk seek, rotation, and transfer time that such writing demands. Higher-end systems attempt to overcome the synchronous write problem by employing additional (and potentially costly) hardware; for example, the Network Appliance WAFL filer [33] incorporates non-volatile memory (NVRAM) to buffer many synchronous writes, and then issues batches of such writes to disk asynchronously, greatly improving performance. Unfortunately, commodity PC file systems typically do not have access to such hardware. Commodity systems are important to consider, since they are employed in a broad range of performance-sensitive scenarios, from the desktop where they manage personal data (e.g., family photos, movies, and music) to the server room where they form the back-end of important Internet services like Google [1]. Most modern file systems, including Linux ext3 [86] and ReiserFS [51], Microsoft’s NTFS [77], and Apple’s HFS [6] all are journaling file systems, which write file system changes to an on-disk log before updating permanent on-disk structures [32].
55
5.1.2
Logging
File systems and database management systems that require transactional semantics often rely upon write-ahead logging or journaling [19, 31, 32]. A variety of journaling file systems exist today, such as ext3 [85], ReiserFS [51], JFS [10], and NTFS [77]. In our descriptions we will explain how Linux ext3 performs journaling, although all of these file systems are similar in these respects. The basic idea in all journaling file systems is that information about pending updates is written to the log, or journal, on disk. The log can either be stored in a known portion of the disk, or it may be stored within a known file. The file system meta-data and data are also written to fixed locations on the disk; this step is often called checkpointing. Forcing journal updates to disk before updating the fixed locations of the data enables efficient crash recovery: a simple scan of the journal and a redo of any incomplete committed operations bring the system to a consistent state. During normal operation, the journal is treated as a circular buffer; once the necessary information has been propagated to its fixed location on disk, journal space can be reclaimed. Many journaling systems have a range of journaling modes, all of which impact performance and consistency semantics. In data journaling, the logging system writes both meta-data and data to the log and thus delivers the strongest consistency guarantees. In ordered mode, the logging system writes only meta-data to the log; ordered mode ensures that the data blocks are written to their fixed locations before the meta-data is logged, giving sensible consistency semantics. Finally, writeback mode makes no guarantees about the ordering of data and meta-data, and thus has the weakest consistency guarantees. Due to its strong consistency guarantees, we focus on data journaling in this chapter. The relative performance of the journaling modes depends largely on the workload. Data journaling can perform relatively poorly when large amounts of data are written, since the data blocks must be written twice: once to the log and again to their fixed locations. However, data journaling performs relatively well when small, random writes are performed. In this case, data journaling transforms the small random writes to sequential writes in the log; the random writes to the fixed
56 data locations can be performed in the background and, thus, may not impact application performance.
5.2
Performance Issues with Synchronous Disk Writes We now describe the sequence of operations that occur when a log is updated. A journaling
system writes a number of blocks to the log; these writes occur whenever an application explicitly sync’s the data or after certain timing intervals. First, the system writes a descriptor block, containing information about the log entry, and the actual data to the log. After this write, the file system waits for the descriptor blocks and data to reach the disk and then issues a synchronous commit block to the log; the file system must wait until the first write completes before issuing the commit block in case a crash occurs. In an ideal world, since all of the writes to the log are sequential, the writes would achieve sequential bandwidths. Unfortunately, in a traditional journaling system, the writes do not. Because there is a non-zero time elapsed since the previous block was written, and because the disk keeps rotating at a constant speed, the commit block cannot be written immediately. The sectors that need to be written have already passed under the disk head and the disk has to perform an almost full rotation to be able to write the commit block. We improve journaling performance with log skipping; log skipping attempts to write the next log entry to the current disk head position, thus minimizing rotational delay. We present this technique in the following section.
5.3
Log Skipping In this section we present log skipping, a novel technique for log optimization. We refer to
the file system component that performs the optimization as the log skipper. With log skipping the log records are not allocated sequentially to the disk; instead, the log skipper writes the log record where the disk head is currently positioned (or close to it). Log skipping greatly improves performance because the log write will not need to wait for the disk to rotate.
57 However, log skipping raises three new questions. First, how does the log skipper know where the disk head is currently positioned? Second, how does the log skipper allocate space in the log? Third, how does the new structure of the log impact crash recovery? We address these three questions in turn.
5.3.1
Disk Head Position
Log skipping needs information about where to write the current log blocks so that they incur the smallest service time. This information can come from a disk model or it could be provided by the disk, if the proper interface exists. Since current disks do not export such low-level information, we explore how a disk model can be used. Given that this is a major issue to address, we describe our disk model, miniMimic, in detail in Section 5.4.
5.3.2
Space Allocation
The log skipper needs to track the current free space in the log. After a write request arrives and the log skipper determines the position of the disk head, the log skipper checks to see if the corresponding disk blocks are free. If the blocks are free, the log skipper issues the request to that location and marks the blocks as utilized. If the blocks are not free, the log skipper looks for the next location in the log that could hold the blocks. This location might not have an optimized service time, especially when the log is nearly full. Similar to the ext3 file system, when the free space in the log is below a certain threshold, or after a given time interval, the log is cleaned. We note that the space overhead for tracking the free space in the log is not high; given that most logs are in the range of tens of megabytes, the space for a suitable bitmap is only on the order of kilobytes. Another potential concern is that the space utilization of the log with log skipping is no longer likely to be optimal: the log may now have ’holes’ of free space that are too small for new requests to fit. However, we feel that space utilization of the log is not a concern: disk capacities are
58 increasing at a much higher rate than disk performance. Thus, we believe that a small loss in disk capacity is worth the large improvement in performance that log skipping can bring.
5.3.3
Crash Recovery
During crash recovery, a normal log is read sequentially from the head of the log to the last committed transaction, and then it is replayed, assuring that the disk operations that safely made it to the log are reflected in the disk state after the crash. With log skipping, the log data is interleaved with free blocks, which means that the log skipper needs to pay special attention in reconstituting the log before replaying it. The descriptor and commit blocks in the normal log already contain magic numbers that distinguish them from other blocks on disk. The descriptor block also contains a sequence number and the final disk location of the data blocks included in the transaction. Similarly, the commit block contains a sequence number. Thus, log skipping does not need to change the format of the descriptor and commit blocks. After a crash, with log skipping, the log recovery process must read the entire log and reorder the records according to their sequence numbers, starting from the sequence number of the head of the log. Since log recovery is not frequent, we believe this added step in the recovery process has a minimal impact.
5.4
Building the Disk Model We now describe the model we use to predict where to synchronously write the data blocks
in the log. As in previous applications, the model we use is not intended to accurately predict all aspects of the disk, but only certain characteristics of the device, more specifically to estimate the disk head position within the log. MiniMimic predicts the skip distance between synchronous write requests within the log that will lead to the minimum average service time; miniMimic explicitly accounts for the size of requests and the think time between requests. We have configured miniMimic on the logs for three
59
8
Service Time (ms)
7 6 5 4 3 2 1 0 0
100
200
300
400
500
Sorted Requests
Figure 5.1 Individual Service Times for 4 KB Requests. This graphs plots sorted individual service times for requests of size 4 KB. The requests are issued sequentially, with no think time, and the skip distance is 0. The disk used for experiments has a maximum rotation latency of 6 ms. Most of the requests have a high service time, larger than a full rotation. The average service time for these requests is 6.13 ms. different disks, two SCSI disks (both IBM 9LZX, different revisions and with different physical characteristics) and an IDE WDC WD1200BB disk. In the previous models we found that the two most important parameters to consider were operation type (i.e., a read or a write) and inter-request distance (throught this chapter we refer to inter-request distance as skip distance). For log skipping, operation type is not relevant, since the only disk operations are writes. For miniMimic, we also find that skip distance is a fundamental parameter. MiniMimic must also incorporate two request parameters that previous on-line, measurement-drive disk models did not: request size and think time. We now describe how miniMimic incorporates these three parameters. We begin by considering skip distance in isolation, and then add in request size, and then think time. For clarity, we mainly present data from a SCSI 9LZX disk.
60
Average Service Time (ms)
9 8 7 6 5 4 3 2 1 0 -6
-4
-2
0 Skip (MB)
2
4
6
Average Service Time (ms)
7 6 5 4 3 2 1 0 -200
-150
-100
-50
0 50 Skip (KB)
100
150
200
Figure 5.2 Average Service Times for 4 KB Requests. These graphs plot the average service times for requests with a size of 4 KB, when the skip distance varies. The graph on the top explores skip distances between -5 MB and 5 MB. We observe the ’sawtooth’ profile of the graph, explained by the varying amounts of rotational latency incurred by the requests. The graph on the bottom is a zoom in for skip distances between -200 KB and 200 KB. We notice that the minimum average service time occurs for a skip distance of 28 KB.
61
5.4.1
Skip Distance
We already showed that the skip distance between two requests is a fundamental parameter in predicting the positioning time of a request. As described in previous sections, positioning time includes seek, rotation, and head switch times. Due to the geometry of disks, and the mapping of logical block numbers to tracks and platters on the disks, requests with the same skip distance will have a distribution of positioning costs, where many of the requests have identical costs. Figure 5.1 presents an example distribution of service times for different 4 KB write requests with a skip distance of 0. The observations we made in previous chapters hold for this usage of the model as well. MiniMimic summarizes this distribution of sampled service times with the mean service time. Using the mean and using skip distance as a parameter, instead of using a functional disk model with intimate knowledge of the mapping of logical blocks to a particular sector and platter on the physical disk, greatly simplifies our model, with only a small loss in predictive power. The average service time as a function of skip distance for the SCSI disk is shown in the first graph of Figure 5.2. The y-axis represents the average service time for 4 KB requests that are issued with the skip distance specified on the x axis. A close-up for skip distances between -200 KB and 200 KB is shown in the second graph of Figure 5.2. The graphs show that the minimum average service time of 1.57 ms is obtained with a skip distance of 28 KB. Thus, for a 4 KB request with zero think time, miniMimic will recommend to the log skipper that it write the next request at a distance of 28 KB from the previous request.
5.4.2
Request Size
Applications write data in different sizes; the log skipper must be able to determine the best skip distance for a given write request as a function of its size. Thus, miniMimic explores the service times for a range of request sizes and skip distances within the log. One might expect, for a given skip distance, that service time will increase linearly with request size, under the assumption that the positioning time is independent of request size
62 and that the transfer time is a linear function of the request size. This expectation holds true for most skip distances we have sampled, as exemplified by the graph with a skip distance of zero in Figure 5.3. However, for the skip distances that correspond to minimal service times (i.e., those that incur minimal rotation delay), the service time is not linear with request size. An example of one such skip distance, 28 KB, is shown in the second graph of Figure 5.3. In this case, service time generally increases with the request size, but with a number of outliers. With a skip distance of 28 KB, the disk is right on the edge of writing the first sector without waiting for a rotation; small differences in the workload cause the disk to incur an extra rotation. Figure 5.4 plots a 3-d graph of the average service time when both the request size and the skip distance vary. We observe three plateaus in the service times, with two discontinuity points around skip distances of 28 KB and 144 KB. It is important to note that the transition points between the plateaus are not smooth; different request sizes have their low service times at different skip distances. This result is summarized in Figure 5.5, which shows that some request sizes have recommended skip distances of 28 KB while others of 144 KB. As indicated in Figure 5.4, the difference in service times between those two skip distances can be quite high for some request sizes.
5.4.3
Think Time
Applications writing data often have think time (i.e., computation time) between requests. Thus, the log skipper will see idle time between arriving writes and must account for the fact that the disk platters continue to rotate between these requests. MiniMimic configures the think time parameter by issuing write requests to the log as it varies the idle time between those requests. Although the full version of miniMimic must simultaneously account for skip distance, request size, and think time, we begin by examining think time in isolation. Figure 5.6 plots the average service time for 4 KB requests and a skip distance of 0 preceded with a think time between 0 ms and 12 ms. The graph shows that increasing think time results in
63
Average Service Time (ms)
16 14 12 10 8 6 4 2 0 0
20
40
60 80 100 120 140 160 180 200 Request Size (KB)
0
20
40
60 80 100 120 140 160 180 200 Request Size (KB)
Average Service Time (ms)
16 14 12 10 8 6 4 2 0
Figure 5.3 Average Service Time for Requests when the Request Size Varies. We plot the average service time for different request sizes, for two skip distances. The graph on the top plots the service time for a 0 KB skip distance and the graph on the bottom plots the service time for a 28 KB skip distance. We observe a smooth ascending curve for service times associated with a 0 KB skip distance, while the graph on the bottom shows a more irregular pattern. smaller service times, up to think times a little larger than 5 ms. This is explained by the fact that the requests issued with no think time incur a large rotational latency, and increased think times
64
Average Service Time (ms) 16 12 8 4
0
50 Skip (KB)100 150
200
150 100 50 Request Size (KB)
200
Figure 5.4 Average Service Time for Requests when the Request Size and Skip Distance Varies. The graph shows larger service times as the request size increases. There are three plateaus with transition points around 28 KB and 144 KB. The transition between the plateaus happens at different values for the skip distance. allow time for the disk to rotate and bring the sectors that need to be written closer to the disk head. As the think time increases past 6 ms, the sectors that need to be written have passed under the disk head already, and thus these requests again incur large rotational latencies to complete. Figure 5.7 is a 3-d plot of average service times when both think time and skip distance are varied. The plot shows that the relationship between skip distance and think time is a bit complex and that interpolating values would be difficult.
5.4.4
Model Predictions
In this section, we have seen how miniMimic predicts the average service time of write requests as a function of pairwise combinations of the three parameters: skip distance, request size, and think time. To be used for log skipping, we would like miniMimic to recommend a skip distance to minimize service time, as a function of request size and think time.
65
160
Skip Distance (KB)
140 120 100 80 60 40 20 0 0
20
40
60
80 100 120 140 160 180 200
Request Size (KB)
Figure 5.5 Choices for Skip Distance when the Request Size Varies. This graph shows which skip distance will be recommended by miniMimic when the request size varies. We notice that miniMimic will choose different skip distances for different request sizes. Figure 5.3 and 5.4 show that the difference in the service time for different skip distances is noticeable. To build the miniMimic, we sample the log off-line and measure all combinations of values for skip distance (between 0 and 300 KB in 4 KB increments), request size (between 0 and 200 KB in 4 KB increments), and think time (between 0 and 7 ms in 200µs increments); for each combination, we take 50 different samples. We note that our measurements are currently more exhaustive than needed; given some knowledge of the workload, one could sample fewer values for the request size and think times; given more assumptions about the disk performance characteristics, one could sample fewer skip distances. After miniMimic samples the disk log, it searches the set of measured values to find the skip distance that generates the minimum average service time as a function of the request size r and think time t. This skip distance is the recommendation that miniMimic will make when when called by the log skipper to synchronously write a request with size r and think time t.
66
Average Service Time (ms)
7 6 5 4 3 2 1 0 0
2
4
6
8
10
12
Think Time (ms)
Figure 5.6 Average Service Time for 4 KB Requests when the Think Time Varies. The graph plots average service times when the think time varies and the skip distance is 0 KB. The graph shows a periodic pattern, as the amount of rotational latency varies between minimum and maximum values. With no think time the requests incur large rotational latencies, but as the think time increases the service time decreases because the target sectors are closer to the disk head. The disk has a rotational latency of 6 ms, which is reflected in the periodic pattern. These recommendations are graphically summarized in Figures 5.8, 5.9, and 5.10 for the two SCSI IBM 9LZX disks and the IDE Western Digital WDC WD1200BB disk. We make the observation that the recommended skip distance curves for the three logs are complex and irregular; it would be difficult to interpolate the desired skip distance for sizes or think times that were not measured directly. In summary, we note that miniMimic is simple, portable, and accurate. Because miniMimic only models the log portion of the disk, it contains relatively little data and can be configured relatively quickly, especially compared to similar measurement-based approaches that model the entire disk [49]. We have also found miniMimic to be portable; we initially developed miniMimic for one of the SCSI disk and found that no changes were needed to configure it for the second SCSI disk and the IDE disk. Finally, miniMimic is accurate; as we will show in the next sections,
67
Average Service Time (ms)
6 4 2 0
3
50 100 Skip (KB)
150
6
2
1
0
4 5 Think Time (ms)
Figure 5.7 Average Service Time for 4 KB Requests when the Think time and Skip Distance Varies. The average service times associated with different think times varies with a more complex pattern compared to the one observed when varying the request size. miniMimic does a very good job in predicting the best skip distance for write requests of different sizes and with different think times.
5.5
Experimental Setup We now briefly describe our implementation of log skipping for evaluation, the transactional
workload that we use to drive our experiments, and our experimental environment.
5.5.1
Implementation
We have implemented log skipping in an emulated environment. The emulator is a user-level program that mimics the logging component of a file system: it writes log data to disk, it allocates space to the log, and it cleans the log. The log skipper uses miniMimic to pick the location in the log to write the next transaction to. The log skipper then issues the write requests to a real disk through the raw interface.
68
Skip (KB) 150 100 50 0
50 100 Size (KB) 150 200 0
1
6 4 5 3 2 Think Time (ms)
7
Figure 5.8 MiniMimic Skip Distance Recommendations for SCSI Disk 1. MiniMimic predictions for the skip distance to be used when a request has a given request size and is preceded by a given think time, for the SCSI IBM 9LZX disk. The shape of the graph is highly irregular. The emulator is trace-driven. The traces are collected beneath the file system and isolate the disk traffic directed to the file system log. The traces have information about the type of log block (i.e., descriptor block, data block, or commit block), the type of operation (i.e., read or write), the logical block number for the request, and the time of issue.
5.5.2
Workload
To evaluate log skipping, we are most interested in transactional workloads. Therefore, we collected traces from a modified version of the TPC-B benchmark. The TPC-B benchmark [84] simulates the behavior of database applications that generate large amounts of disk traffic and that need transactional processing. The benchmark issues a series of transactions. Each transaction is made up of a group of small updates to records in three database tables: account, teller and branch, and an update to a history file.
69
Skip (KB)
200 150 100 50
50 Size (KB) 100
150 200 0
1
6 4 5 3 2 Think Time (ms)
7
Figure 5.9 MiniMimic Skip Distance Recommendations for SCSI Disk 2. MiniMimic predictions for the skip distance to be used when a request has a given request size and is preceded by a given think time, for the second SCSI IBM 9LZX disk. We have modified the TPC-B benchmark so that we can vary the think time in the application and the size of each transaction; we also ensure that the transactions are written synchronously to the disk. Exploring these new parameters permits us to explore behavior characteristic of a larger number of transactional applications. From a logging point of view, the traffic issued by our modified TPC-B benchmark translates to a series of random synchronous write requests. When the application issues a synchronous 4 KB write, the traffic generated to the log is a synchronous request of size 8 KB (i.e., descriptor and data block) followed by another synchronous 4 KB request (i.e., commit block). We have collected traces from our modified TPC-B benchmark for a variety of think times and request sizes. The benchmark was run on a Linux 2.6 system, configured to use the ext3 file system in data journaling mode.
70
Skip (KB) 350 300 250 200 150 100 50 0
40
80 Size (KB) 120 160 200 0
1
2
7 8 5 6 4 3 Think Time (ms)
Figure 5.10 MiniMimic Skip Distance Recommendations for IDE Disk. The graph plots the MiniMimic predictions for the skip distance to be used when a request is characterized by a given request size and preceded by a given think time, for the IDE Western Digital WDC WD1200BB drive. Similar to the SCSI disk the shape of the graph is irregular, though the curve is less complex.
5.5.3
Environment
Our experiments are run on three different systems, two containing SCSI disks (IBM Ultrastar 9LZX) and the other an IDE disk (WDC WD1200BB). These are the same disks for which we presented the profile data in Section 5.4. The experiments that use the SCSI disks were run on a system with dual 550 MHz processors and 1 GB of memory. The experiments that use the IDE disk were run on a system with a 2.4 GHz processor and 1GB of memory. For all experiments the size of the log is set to 40 MB. When we do not specify otherwise, the data reported is from the system that uses the first SCSI disk.
5.6
Log Skipping Results We now explore the performance benefits of log skipping. We begin by validating the disk
model produced by miniMimic. We then measure performance improvements with log skipping
71
10
Service Time (ms)
8 actual actual avg predicted avg predicted min predicted max
6 4 2 0 0
100
200
300
400
500
Requests (sorted)
Figure 5.11 Predicted Versus Actual Service Times. This graph plots the actual service times versus predicted service times for a request size of 8 KB. The line labeled ’actual’ plots the sorted values of the service times for the individual requests. The actual and predicted averages are within 1% of each other. and a complementary technique called transactional checksumming [50]. This technique eliminates the need for a second synchronous write, and thus implicitly avoids the extra disk rotation. Thus, only a single write operation is needed, instead of two previously with normal log operations. Additionally, a checksum is written to the log along with the descriptor block and data block. The checksum allows the system to detect a partial write when the log is read after a system crash. We note that transactional checksumming is an orthogonal solution to log skipping. The two techniques can be implemented separately or together. In this section we show the benefits of log skipping both with and without transactional checksumming.
5.6.1
Validating the Disk Model
We start by exploring the accuracy of the disk model produced by miniMimic. In this experiment, the log skipper replays a TPC-B trace in which the application issues 4 KB requests; thus, for this workload, the log skipper will see two synchronous writes: one for 8 KB (i.e., the 4 KB
72
16
no chksm/no skip no chksm/skip chksm/no skip chksm/skip
14 BW (MB/sec)
12 10 8 6 4 2 0 1
2
4
8
16
32
Number of Application Blocks/Xact
Figure 5.12 Performance Improvements when the Size of the Requests Varies - SCSI Disk 1. The graph shows the bandwidth (y-axis) when the size of the requests varies (x-axis) and there is no think time. Each bar in the group of bars represents one log optimization configuration: no optimization, checksumming, skipping, and checksumming and skipping together. Each configuration sees an increase in performance when the request size increases, as the positioning costs are amortized. In general, log skipping performs better than transactional checksumming and pairing both skipping and checksumming yields the best performance improvement. descriptor block and the 4 KB of data) and a second for 4 KB (i.e., the 4 KB commit block). The log skipper uses miniMimic to choose the skip distance that will minimize service time on the SCSI disk. To evaluate miniMimic, we compare its predicted service times with the actual disk service times measured during the experiment. For simplicity, we plot only the results for the synchronous 8 KB requests, but the results for the 4 KB requests in the workload are qualitatively similar. The results are shown in Figure 5.11. The ’actual’ line shows the disk service times measured during the log skipping experiment for each of the 500 requests in the workload; the ’actual avg’ line shows the average measured service time. The three predicted lines show the average, minimum, and maximum values that miniMimic predicted.
73
25
no chksm/no skip no chksm/skip chksm/no skip chksm/skip
BW (MB/sec)
20 15 10 5 0 1
2
4
8
16
32
Number of Application Blocks/Xact
Figure 5.13 Performance Improvements when the Size of the Requests Varies - SCSI Disk 2. The graph shows the bandwidth (y-axis) when the size of the requests varies (x-axis) and there is no think time and when we use the second SCSI disk. The behavior is similar to the first SCSI disk. Our results indicate miniMimic has been configured correctly for the log skipping experiments on this disk. Specifically, the measured average and predicted average are within 1% of each other. Furthermore, the predicted minimum and maximum service times bound more than 99% of the measured service times; a few measured service times exceed the maximum predicted time due to the smaller sample size (i.e., 50) used to configure miniMimic. In general, we can conclude that miniMimic can be used to accurately predict the service time of on-line requests.
5.6.2
Impact of Request Size
In the next set of experiments, we explore the performance improvements when a log optimizer implements log skipping and/or log checksumming. As stated earlier, transactional checksumming improves performance by reducing the number of synchronous writes from two to one, while log skipping improves performance by reducing the positioning time of the synchronous writes. Thus, the two log optimizations can be implemented individually or together; when the log skipping is
74
16
no chksm/no skip no chksm/skip chksm/no skip chksm/skip
14 BW (MB/sec)
12 10 8 6 4 2 0 1
2
3
4
5
8 12 16 20 24 28 32 36
Number of Application Blocks/Xact
Figure 5.14 Performance Improvements when the Size of the Requests Varies - IDE Disk. The graph shows bandwidth (y-axis) when the request size varies (x-axis) and when using an IDE disk. The observations are similar to those for the SCSI disk. In contrast to the SCSI disk, we see a performance drop when the request size is larger than 12 blocks, but our data shows this is not a result of miniMimic mispredictions, but rather a characteristic of the disk or device driver. implemented with transactional checksumming, log skipping minimizes the positioning time of the single synchronous write in each log update. We begin with the case where the TPC-B application issues synchronous writes of varying sizes and there is no think time. We examine first the performance of the SCSI disk and then of the IDE disk. Figure 5.12 shows the bandwidth for the writes to the log on the SCSI disk. Along the x-axis we vary the number of blocks that are synchronously written by the application. Note that this number does not exactly correspond to the the number of blocks seen by the log optimizer, since the application blocks do not include the descriptor or commit data and the application data may not be perfectly aligned with the 4 KB blocks. For each of the workloads we show the performance for logging with no optimizations (no chksm/no skip), with log skipping (no chksm/skip), with transactional checksumming (chksm/no skip), and with both log skipping and checksumming
75
no chksm/no skip no chksm/skip chksm/no skip chksm/skip
BW during I/O (MB/sec)
14 12 10 8 6 4 2 0 0
1
2
3
4
5
6
Think Time (ms)
Figure 5.15 Performance when Application Has Think Time - SCSI Disk 1. The graph plots the bandwidth seen by the application when doing I/O (y-axis) when the workload has think time (x-axis). Transactional checksumming benefits from increased think times up to 5 ms, that reduce the rotational latency incurred by requests. The performance of log skipping alone is sometimes less than transactional checksumming. Log skipping paired with transactional checksumming continues to yield the best performance. (chksm/skip). We do not measure the time to clean the log for any of the data points. We make three observations for the figure. First, for all logging styles, the delivered disk bandwidth improves with increasing request sizes. This improvement occurs because the positioning costs of the write are amortized over a larger data payload. For example, even with no log optimizations, the disk bandwidth improves from about 1 MB/s to about 7 MB/s as the number of written blocks increases from 1 to 32. Second, for all request sizes, both log skipping and transactional checksumming significantly improve the delivered bandwidth. For example, for an application issuing 4 KB updates (i.e., one block), transactional checksumming improves bandwidth by 91%, log skipping by 317%, and both together by 459%.
76
BW during I/O (MB/sec)
14
no chksm/no skip no chksm/skip chksm/no skip chksm/skip
12 10 8 6 4 2 0 0
1
2
3
4
5
6
Think Time (ms)
Figure 5.16 Performance when Application Has Think Time - SCSI Disk 2. The graph plots the bandwidth seen by the application when doing I/O (y-axis) when the workload has think time (xaxis) for the second SCSI disk. When log skipping and transactional checksumming are deployed together, they yield the best performance. Third, for all request sizes, log skipping improves bandwidth whether or not transactional checksumming is also used; furthermore, log skipping combines well with transactional checksumming. Comparing across the optimization techniques, the best performance occurs when log skipping and checksumming are combined, followed by log skipping alone, and then transactional checksumming. We have performed similar experiments on the second SCSI disk and on the IDE disk, as shown in Figures 5.13 and 5.14. For the second SCSI disk we see similar relative performance of the optimizations we tested. We have performed similar experiments on the IDE disk, as shown in Figure 5.14. On the IDE disk, we see two distinct performance regimes. In the first regime, when there are fewer than 16 blocks per transaction, the relative performance of the different logging styles is similar to that which we saw on the SCSI disk; however, on the IDE disk, the performance benefits of
77
no chksm/no skip no chksm/skip chksm/no skip chksm/skip
BW during I/O (MB/sec)
14 12 10 8 6 4 2 0 0
1
2
3
4
5
6
7
Think Time (ms)
Figure 5.17 Performance when Application Has Think Time - IDE Disk. The graph plots the bandwidth seen by the application when doing I/O (y-axis) when the workload has think time (x-axis) and when using an IDE disk. The trends are similar to the ones noticed for the SCSI disk. log skipping are even more pronounced. For example, with 12 blocks per transaction, bandwidth improves from about 3 MB/s with no optimizations to about 10 MB/s with only log skipping. However, in the second regime when the number of blocks per transaction increases past 12, a significant performance drop occurs for all logging styles. Although log skipping continues to improve performance in this regime, the relative improvement is much less dramatic. We believe that this drop occurs because the write requests are being subdivided into smaller chunks before reaching the IDE disk. Our evaluation shows that miniMimic continues to make accurate predictions in this regime and to find the best skip distance, but the relative benefit of improving the initial positioning time is smaller.
5.6.3
Impact of Think Time
Next we present results for workloads that have think time. In this case, the TPC-B application writes transactions with four blocks and we vary the think time from 0 to 6 ms.
78 Figure 5.15 shows the delivered bandwidth for the first SCSI disk; the delivered bandwidth is calculated as that seen by the application during I/O (i.e., without including the think time). We make three observations from this graph. First, the performance changes in an interesting way with think time, and the direction of the performance change depends upon whether or not log skipping is used. Without log skipping, bandwidth increases with larger think times up to 5 ms, after which bandwidth decreases again. This phenomena can be explained by Figure 5.6 which shows that larger think times produce smaller service times; as explained previously, during the think time, the disk rotates and the target sectors move closer to the disk head. Since the SCSI disk has a rotational latency near 6 ms, a think time of 6 ms yields a bandwidth similar to the one achieved with a think time of 0 ms; thus, performance decreases again with a think time of 6 ms. Transactional checksumming derives a substantial benefit with a think time of 5 ms because the single synchronous write occurs near the disk head. Logging with no optimizations does not exhibit much benefit, since only the first synchronous write in each transaction is located near the disk head and the second synchronous write still incurs the full rotation costs. Second, there is no longer a strict performance ordering between log skipping and checksumming: for some think times, log skipping is superior, while for others, transactional checksumming is. For the think times between 3 and 5 ms when transactional checksumming is superior, log skipping alone still benefits from reducing rotational latency, but not as much as log checksumming alone benefits from performing only one synchronous disk operation. Third, log skipping and transactional checksumming continue to work well together. For some think times, log skipping dramatically improves the performance of transactional checksumming alone (e.g., for think times between 0 and 2 ms and for 6 ms); however, for other think times, log skipping does little to improve the performance of transactional checksumming. In all cases, log skipping paired with transactional checksumming has the best performance across different think times. Finally, for some values of think time, log skipping does not perform as well as we would expect; the performance loss is due to small mispredictions in the disk model and thus the log
79 skipper does not choose the best skip distance. For example, when an application contains 3 ms of think time, log skipping does not further improve upon transactional checksumming. In this case, miniMimic predicts that the optimal skip distance is 96 KB and that the average service time should be 3.35 ms. However, in the experiment, the average service time is significantly higher at 4.28 ms; examining the individual service times in more detail, we see that although most requests finish in close to 3 ms, several requests incur an extra rotation. Thus, it appears that the log skipper is slightly too aggressive in its skipping and a smaller skip distance would improve performance; specifically, for this workload with a 3 ms think time, a skip distance smaller than 96 KB would incur slightly more rotation delay in the best cases, but would not suffer the worst case times by missing the rotation. Figure 5.16 presents results for the second SCSI disk. In this configuration, combining log skipping and transactional checksumming yields the best performance, and the log skipping alone has better performance than transactional checksumming. Figure 5.17 shows the results for the IDE disk. On the IDE disk, the qualitative trends are similar to those for the SCSI disk. In summary, we again see that transactional checksumming alone can perform quite well when the think time of the application is matched to that of the rotational latency of the disk. However, log skipping in combination with transactional checksumming provides the best performance; furthermore, this performance is much more stable in the presence of variations in application think time.
5.7
Summary In this chapter we presented a specialized disk model, miniMimic, which is used to implement
a novel technique for optimizing the log operations for applications that perform synchronous disk writes. Log skipping writes data to the log close to where the disk head is situated, thus avoiding incurring costly rotational latency.
80 MiniMimic is built specifically for the disk on which the log is written and is able to predict minimum service times for write requests. The model takes into consideration request size and think time as parameters when making a prediction. We showed that it is possible to obtain improvements of more than 300% when using the log skipper. We compared to another option for log optimizations, transactional checksumming, and show that performance can improve up to 450% when the techniques are combined.
81
Chapter 6 Stripe Aligned Writes in RAID-5 In this chapter we present how a data-driven model can be used to tune a system to better operate a RAID-5 storage device. More specifically we are targeting the small write problem in RAID-5 [16]. We start by describing when it occurs, and then we present a solution for alleviating it, by incorporating a specialized RAID-5 data-driven model in the I/O scheduler. The goal of this chapter is to explore the use of data-driven models beyond disk drives. In particular, we study if we can apply the same lessons learned from modeling a disk drive to modeling a different device, in this situation a RAID-5 system.
6.1
Small Writes in RAID-5 The term RAID (Redundant Array of Inexpensive Disks) [47] was coined in the 1980’s to
describe ways of configuring multiple disks while still having them appear as one disk to the system that uses them. Various RAID configurations are designed to increase the reliability and performance of the storage system, often by trading off disk capacity. One of the most widely used RAID configurations is RAID-5 [47]. In this setup, N disks are used for storing both data and parity blocks. Data is written to the system in units called “stripes”, with each disk being allocated a “chunk”. Redundancy is supplied by parity blocks. A stripe spans N-1 disks and the parity is stored on the remaining disk. The parity blocks are computed as simple XOR operations on all the data blocks in a stripe and they are used to recover the data in case of a disk failure. The position of the parity disk changes for every successive stripe, as illustrated in Figure 6.1.
82
Figure 6.1 RAID-5 Configuration. This figure shows an example of the block layout in a RAID-5 left asymmetric configuration. The stripe spans 3 data disks, and there is one parity disk per stripe. Write operations require updates to the parity blocks along with updates to the data blocks. We give an example of the sequence of operations required to update one data block. Let us assume that block 5 shown in the example in Figure 6.1 is modified. The RAID-5 system has to 1) read the parity block corresponding to the modified block (P2), 2) compute a new parity that reflects the new value for block 5, and then 3) write the new values for block 5 and parity P2’. In this process, we notice that one logical update operation has resulted in two additional operations: read and write of the parity block associated with the stripe that is modified. This situation is known as the small write problem in RAID-5, as the performance of the storage system can degrade significantly under write workloads because of the extra read-modify-write operations. This performance degradation can occur for large writes as well, if the OS does not correctly align or merge requests. The I/O scheduler is in charge with deciding the size and alignment of requests issued to the disk, we are going to discuss these operations in more detail in Section 6.2. Let us assume the system needs to update blocks 4, 5, and 6. The I/O scheduler decides how the requests are merged or split, but since it has no knowledge of the actual storage system that ’hides’ behind the simple logical block interface, it could issue requests for the storage system in the following sequence: update block 4, then update blocks 5 and 6. In this scenario, the storage system performs two read-modify-write operations for P2 (one for block 4 and one for blocks 5 and 6), although a better approach would have been to update the whole stripe in one operation. Updating the stripe in one operation results in only one extra write operation, for the parity block associated with the stripe.
83
6.2
Stripe Aligned Writes Commodity operating systems typically view the underlying storage device in a very simple
manner: as a linear array of blocks addressed using a logical block number (LBN). Regardless of the actual complexity of the storage device (e.g., whether it is a single disk, a RAID, or even a MEMS device), the file system uses essentially the same unwritten contract [63], namely that sequential accesses are faster than random, that accesses with spatial locality in the LBN space are faster, and that ranges of the LBN space are interchangeable. However, this unwritten contract belies the fact that how blocks are mapped to the underlying disks in a RAID or a MEMS device changes its performance and reliability [17, 47, 58, 96, 63]. As demonstrated by the small writes problem, the lack of information about the underlying storage system that services the I/O requests can adversely affect the performance of the system. Thus, we propose to enhance the I/O scheduler, by making available to it the information required to split and merge requests in a more efficient way. The questions that we need to answer are the following: 1) what information is needed by the scheduler; 2) what is the best place to perform this optimization; 3) how can this information be obtained. In order to better understand the information needed by the I/O scheduler we briefly describe the choices that it has regarding splitting and merging requests. The I/O scheduler sees requests for logical block numbers, in the following format: Request(LogicalBlockNumber, Size, DeviceNumber, OperationType). The LogicalBlockNumber represents the start of the sequence of blocks that is requested, Size is the number of blocks affected by the request, DeviceNumber is the device where the data is located, and OperationType is the type of operation (read or write). As requests are issued by user applications, the scheduler builds a queue of requests, which it orders according to the scheduling algorithm that is currently selected (FIFO, C-LOOK, anticipatory scheduling, etc.). When a new I/O request arrives, the scheduler has a choice to merge the request with a request that is already queued, or to queue the request individually.
84
Figure 6.2 Layered Environment. This figure shows an example of a common encountered environment, where applications are ran on guest operating systems that operate in a virtualized environment. At the lower level of the storage system we have a RAID system, present for reliability and performance reasons. A request can be merged with another that is already queued only if the new request has blocks that follow or precede it in sequential order and without gaps. Additionally, the operation type of the requests have to be the same (either read or write), and the total length of the newly merged request cannot exceed a maximum size, whose value is dependent on the system. We ask the question about the best place to perform the optimization especially in the context of current systems, where a guest operating system will often be hosted on top of a virtual machine monitor (VMM) that in turn accesses the bare hardware (e.g., the RAID system), as shown in Figure 6.2. There are many benefits to using virtualization, including server consolidation [92], support for multiple operating systems and legacy systems [29], sandboxing and other security improvements [28, 40], fault tolerance [12], and even live migration [20]. Most commodity servers currently include or will soon include virtualization features [7, 46, 78]. In a virtualized environment, the VMM is a natural location to implement I/O scheduling. First, commodity file systems can continue using their unwritten contract with the storage system and do
85
Performance as Stripe Size Varies 14
Aligned Not Aligned
Bandwidth (MB/s)
12 10 8 6 4 2 0 0
50
100
150 200 Stripe size (KB)
250
300
Figure 6.3 Determining Stripe Size. This figure shows the write bandwidth obtained when requests from the guest OS are grouped into stripes of differing sizes. The experiments were run on a RAID-5 system with three data disks, a chunk size of 16 KB, and a stripe size of 48 KB. As desired, RAID-Mimic finds that the best bandwidth occurs when the requests are aligned and grouped into requests of size 48 KB. not need to be modified to handle future devices with new performance characteristics. Second, in a virtualized environment the guest OS sees a virtualized image of the device so it may not be able to correctly determine the stripe boundaries within the RAID system. Third, the guest OS does not have a a global view of the stream of requests; thus, it is difficult to infer if perturbations are from partial stripe writes or from other guest OSes. Finally, the guest OS is oblivious to changes in its environment; for example, if the VMM migrates the guest, the OS will not be aware of the change. If the VMM layer is not present, the best place to put this optimization is at the next adjacent layer to the RAID (e.g.the OS). The answer to the third question, how to obtain the information about the stripe boundaries, is needed for the I/O scheduler to perform RAID-aware splitting and merging. As mentioned, this information is not available from the RAID system, since the interface to it is identical to the interface of a regular disk. We propose the use of a simple data-driven model in order to feed the needed information to the scheduler. We describe the model in the following section.
86
6.3
RAID-5 Data-Driven Model We call the data-driven model of the RAID RAID-Mimic. With the help of RAID-Mimic, the
VMM I/O scheduler transforms and adapts the requests and behavior of the OS above to better match the characteristics of the underlying RAID hardware. The I/O scheduler merges and aligns adjacent write requests from the guest OS such that the requests are a multiple of the stripe size and are aligned to start and end at a stripe boundary. Because a whole stripe is written to disk, the RAID can compute the associated parity without incurring any additional disk activity. For the I/O scheduler to perform the adaptation to the RAID system below, by splitting and merging requests to be stripe-aligned, it needs to know the stripe size used to configure the RAID-5. RAID systems do not typically export information about their internal configuration, such as their RAID level, number of disks, block size, or stripe size. One could leverage existing techniques for automatically deriving these parameters; however, these techniques require a synthetic workload to be run on an otherwise idle system [21]. Rather than require this off-line configuration, RAID-Mimic is built online, and it dynamically models the stripe size of the array. To build the model, we reorder and then observe the write bandwidth of requests from each guest OS. Specifically, the RAID-Mimic instructs the I/O scheduler to split and merge write requests such that it is able to observe the performance of requests with different sizes and alignments. The model times each write and then builds a repository of the corresponding times, grouped by size and alignment. From these observations the model can infer the stripe size of an underlying RAID-5 array; stripes that are of the correct size (and alignment) will have better bandwidth since they do not require extra read requests to recompute the parity block. To verify this configuration process, we run RAID-Mimic on a hardware RAID-5 with three data disks and a chunk size of 16 KB. Thus, the configuration process should discover that the stripe size is 48 KB. Figure 6.3 shows our results. The x-axis shows the stripe size being tried; the y-axis reports the bandwidth achieved using that stripe size. We display two lines: one for
87 which the requests are aligned correctly (on a multiple of the stripe size) and one in which they are not. The figure shows that there is a substantial difference in bandwidth when the model finds the correct stripe size. For example, when RAID-Mimic assumes a stripe size of 48 blocks, bandwidth is nearly 14 MB/s, compared to an average of about 9 MB/s otherwise. Thus, by searching for the stripe size that gives the best bandwidth, RAID-Mimic is able to determine this parameter on-line.
6.4
Experimental Setup We now describe the setup used to show the benefits of incorporating RAID-Mimic in the
VMM I/O scheduler. The environment is presented in Figure 6.2. We use Xen [23], an open source virtual machine monitor. For our experiments we modify the disk scheduler and the disk backend driver. The host operating system is Linux 2.4.29 and the experiments are run on a Pentium III 550 MHz processor. The RAID used in experiments is an Adaptec 2200S RAID controller, configured as RAID-5 left asymmetric, with three data disks, a stripe size of 48 KB, and a chunk size of 16 KB. The disks used are SCSI Ultrastar IBM9LZX disks. The benefits of stripe-aligned writes are most apparent in workloads containing large write requests. To illustrate this benefit, we consider a synthetic workload in which sequential writes are performed to 500 files of differing sizes. Across experiments, we consider file sizes between 4 KB and 256 MB; within each experiment, we vary the size of each file uniformly within 0.5 and 1.5 times the average. The workload is generated by the guest OS and there is no other guest competing for the IO bandwidth at that time. The hardware RAID system is again configured as a RAID-5, with three data disks, a chunk size of 16 KB, and a stripe size of 48 KB.
6.4.1
Evaluation
Our measurements here assume that the I/O scheduler already knows the correct stripe size, that it can obtain using the techniques described in Section 6.2. In our experiments, we consider
88
The Effect of VMM-based Stripe Alignment 20
Bandwidth (MB/s)
15
VMM (NA) / Host (A) VMM (A) / Host (A) VMM (NA) / Host (NA) VMM (A) / Host (NA)
VMM Aligned
10 Not VMM Aligned
5
0 4K
64K
1M 16M Average File Size
256M
Figure 6.4 Specialization for RAID-5. This experiment shows the benefit of using RAID-Mimic to specialize the I/O of the guest OS to RAID-5. The four lines correspond to the four combinations of whether or not the OS or VMM attempts to align writes to the stripe size of the RAID-5. The guest OS runs a synthetic workload in which it performs sequential writes to 500 files; the average file size within the experiment is varied along the x-axis. Smaller file sizes do not see performance improvements from the technique because the workload does not generate whole stripes. the four different combinations of whether the guest OS and/or the VMM attempts to perform stripe-aligned writes. Figure 6.4 shows our results. Each point represents the bandwidth obtained if the files have the average size specified on the x-axis. We make three observations from these results. First and foremost, there is a significant benefit to performing stripe-aligned writes for large files in the VMM. For example, for 5 MB files, alignment within VMM improves performance from about 8 MB/s to over 15 MB/s. Second, this adaptation must be performed in the VMM, and not in the OS. As shown by the lowest two lines, if the OS attempts to align stripes without cooperation from VMM, it achieves no better performance than if it made no effort. In fact, as shown by the top two lines, VMM achieves better performance when the OS simply passes along its requests rather than when the OS attempts to align stripes as well.
89
6.5
Summary In this chapter we presented a specialized model of RAID-5, that predicts only the required
RAID characteristics (e.g., stripe size) for improving storage system performance for write workloads. The model is built online and it is used by an I/O scheduler to make decisions for splitting or merging requests. We compare system performance when the optimization is performed at an OS guest, as opposed to VMM layer. We conclude the VMM is the best place to perform this optimization in a virtualized environment, and we show performance improvement of almost 100% in this situation.
90
Chapter 7 Related Work In this chapter we present related work. We structure the chapter in several sections, in which we talk about disk modeling in general and then disk modeling applications to disk scheduling and logging.
7.1
Disk Modeling The classic paper describing models of disk drives is that by Ruemmler and Wilkes [56]. The
main focus of this work is to enable an informed trade-off between simulation effort and the resulting accuracy of the model. Ruemmler and Wilkes evaluate the aspects of a disk that should be modeled for a high level of accuracy, using the demerit figure. Other researchers have noted that additional non-trivial assumptions must be made to model disks to the desired accuracy level [41]; modeling cache behavior is a particularly challenging aspect [73]. Given that the detailed knowledge for modeling disks, such as head switch time, cylinder switch time, data transfer overhead, is not available from documentation, researchers have developed innovative methods to acquire the information. For example, Worthington et al. describe techniques for SCSI drives that extract time parameters such as the seek curve, rotation speed, and command overheads as well as information about the data layout on disk and the caching and prefetching characteristics [98]. Many of these techniques are automated in later work [60]. Modeling storage devices using tables of past performance has also been explored in previous work; in most previous cases [4, 30], high-level system parameters (e.g., load, number of disks, and operation type) are used as indices into the table. Anderson [4] also uses the results on-line,
91 to assist in the reconfiguration of disk arrays. An approach similar to ours is that of Thornock et al. [83]. In this work, the authors use stochastic methods to build a model of the underlying drive. However, the application of this model is to standard, off-line simulation; specifically, the authors study block reorganization, similar to earlier work by Ruemmler and Wilkes [54]. At a higher level, Seltzer and Small suggest in situ simulation as a method for building more adaptive operating systems [70]. In this work, the authors suggest that operating systems can utilize in-kernel monitoring and adaptation to make more informed policy decisions. By tracing application activity, the VINO system can determine whether the current policy is behaving as expected or if another policy should be switched into place. However, actual simulations of system behavior are performed off-line, as a “last resort” when poor performance is detected. Another approach to simulation can be to use artificial intelligence techniques such as CART (Classification and Regression Trees) models [89] a technique that is similar to non-linear regression. In this situation, the models treat disks as a “black box”, with no assumptions about the devices. Doing so requires considering all possible parameters that can impact performance. The models need to be trained, and then the models can predict average service times per request. While this approach has similarities with ours, the authors did not explore requirements to deploy the model in an on-line manner or how to adapt it to application specific requirements. The same problem of synchronous writes to a log is tackled in [24]. The authors notice the same effect of skipping blocks, as the one we present and they propose a linear model to keep track and adjust the skipping distance in order to minimize the service time for synchronous writes. Our model also incorporates think time to deal with applications that interleave computations with I/O operations. It is not clear how the think time would need to be considered in their model. Chiueh and Huang [87] also consider optimizing synchronous disk writes. In order to predict the disk head position they choose to use information about disk geometry, such as number of heads, track size, platter rotation speed . This approach is difficult to implement in practice, since this information is not readily available, and thus makes the approach less portable. Even with automated tools for extracting it, the complexity of disks requires the technique to be recalibrated periodically.
92 In distributed systems there has been work [2, 15] that looks at performance debugging of systems with multiple communicating components. Their approach uses timing, which is similar to the way we build our models, but they focus on performance debugging and problem pinpointing, and do not use their approach to optimize the system on-line.
7.2
Disk Scheduling Disk scheduling has long been a topic of study in computer science [94]. Rotationally-aware
schedulers came into existence in the early 1990’s, through the work of Seltzer et al. [66] and Jacobson and Wilkes [37]. However, perhaps due the difficulty of implementation, those early works focused solely upon simulation to explore the basic ideas. Only recently have implementations of rotationally-aware schedulers been described within the literature, and those are crafted with extreme care [35, 100]. More recently, Worthington et al. [97] examine the benefits of even more detailed knowledge of disk drives within OS-level disk schedulers. They find that algorithms that mesh well with the modern prefetching caches perform best, but that detailed logical-to-physical mapping information is not currently useful. Anticipatory scheduling is a relatively recent scheduling development that is complementary to our on-line simulation-based approach [36]. An anticipatory scheduler makes the assumption that there is likely to be locality in a stream of requests from a given process; by waiting for the next request (instead of servicing a request from a different process), performance can be improved. The authors also note the difficulty of building a rotationally-aware scheduler, and instead use an empirically-generated curve-fitted estimate of disk access-time costs; the Disk Mimic would yield a performance benefit over this simplified approach.
7.3
Logging A hardware solution for improving log performance is to use NVRAM (non-volatile RAM)
within the disk system. By placing the log in NVRAM, writes to the log are fast and are still robust
93 to crashes and power failure. However, NVRAM is an expensive approach, not only in financial terms, but in testing as well: ensuring that the log in NVRAM is interacting properly with the rest of the system and really is robust to crashes can require significant testing. We are aware of one other recent software solution for optimizing log operations: transactional checksumming [50]. Transactional checksumming eliminates the need for a second synchronous write, and thus implicitly avoids the extra disk rotation. This solution performs a single write, but writes a checksum along with the descriptor block and data to the log. The checksum allows the system to detect a partial write when the log is read after a system crash. We note that transactional checksumming is an orthogonal solution to log skipping. The two techniques can be implemented separately or together.
7.3.1
Write Everywhere File Systems
There is a substantial body of work that has looked at file system optimizations that write data close to where the disk head is positioned. The first mention that we are aware of dates to 1962 [39] where the authors propose to write data on the drum that is closer to the disk head. Eager writing [90] performs writes close to the disk head. While the authors also target small synchronous writes, there are several differences from our proposal. First, with eager writing there is no disk model for predicting positions with small service time. Second, deploying the solution requires either modifying the disk interface or moving functionality to be within the disk. In contrast, the solution we present in Chapter 5 is simple and can be easily implemented without interface or firmware changes. Third, since eager writing is performed for the whole file system, special care must be taken to build and maintain a persistent indirection map that tracks the current disk block allocations. Since we target optimizations for the log, we do not require extensive modifications to the file system or that additional structures are maintained. There are other systems [14, 33] that write near the disk head, but their solutions cannot be easily integrated into existing file systems, since they require special adjustments, for example, self-identifying blocks. These previous solutions are also more heavyweight since they try to solve
94 a more general problem (e.g., block allocation for any block in the system, as opposed to only the log).
95
Chapter 8 Conclusions We started this dissertation with the observation that there are storage systems that have requirements for high performance I/O and that there are limits to increasing performance. One of the challenges is the lack of information about other layers, which we propose to alleviate by modeling. The intrinsic complexity of layers and also requirements for using them in a running system make previous modeling solutions not suitable. As an outcome, there is a need for another approach to modeling these layers. We propose the use of data-driven models. Data-driven models are empirical models that capture the behavior of the device they model by observing the inputs that are fed to the device and then reproducing the output that was recorded. In this dissertation we present how to use data-driven models in the storage system stack. We focus in particular on data-driven models for disks. We explore through case studies the particular parameters that are important to track. In the case studies we present, we show how we can improve performance by using the data-driven models. For example, in the case of I/O scheduling we improve performance by over 30% compared to traditional disk schedulers like C-LOOK, and over 300% when using the log skipper.
96
8.1
Lessons Learned In the next subsections we summarize some of the lessons we learned. Timing is a Powerful Operation: Use it for Building the Models One lesson learned from all of the case studies is that timing I/O requests is a powerful method
for observing the behavior of the other parts of the system. I/O requests traverse the layers of the storage stack, from the moment they are first issued at the application layer, to their final destination (e.g., a hard disk), and then they return to the issuer. Their path can go through the operating system layer, and possibly a virtual machine layer and RAID layer before retrieving the data from a hard disk. Potentially, all the layers that are traversed by the request will put their fingerprint on it. For example, the operating system can perform I/O scheduling on the requests. Similarly, the hard disk has to perform certain operations in order to service a request. For example, the disk head has to move from the current cylinder to the destination, where the data is located. Additionally, a new disk head may need to be activated, and the disk must wait for the platters to rotate, until the target sectors come under the disk head. All of these activities are accounted for when we record the total time a request takes to execute. Thus, timing how long a request takes to be serviced by the disk gives an accurate account of the actual activities that happen when a request is serviced. There are, however, challenges with this approach, that we discuss next. For example, the more intervening layers between the one that times the requests and the layer that is modeled, the more difficult it can be to build an accurate model. Avoid Intervening Layers: Put the Model Closer to the Target The challenge of intervening layers can be overcome by placing the model as close as possible to the layer that is modeled. This situation was illustrated in the two case studies where we modeled a disk drive and then used the model to perform I/O scheduling in either the operating system layer or the application layer. In the second case study, where the scheduling was performed by the application layer, we had to pay an extra effort to be sure that the intervening layer (the operating system layer) does not interfere with the measurements and decisions of the model. Our solution
97 was to export the scheduling queue from the operating system layer to the application layer, so the application was aware of the scheduling effects at the operating system. Modifying the operating system to export information is not always possible because the source code might not be available. Also, simply because every modification in the kernel can possibly introduce bugs, or interact with previously present functionality, operating system modifications are generally avoided. Even with the information about the scheduling queue, functionality available at the application level is still limited. For example, scheduling of write requests is not possible in the setup presented in Chapter 4 because the application does not know at the moment when an allocating write is issued where it is going to be allocated on disk. A possible solution will require more help from the operating system, in the form of additional information to be exposed from that level (in this situation, the location of the blocks on disk). These challenges underline the difficulties to modeling and using a device when there are other interfering layers between the model and the device modeled. In a similar manner, in the RAID case study, we saw that implementing an I/O scheduling optimization by issuing stripe sized and aligned writes is more efficient when placed at the virtual machine monitor layer. The alternative was to place optimizations within the I/O scheduler of each of the guest operating systems that run on top of the virtual machine monitor. In our situation, the virtual machine monitor layer is a better choice for several reasons. First, instead of modifying all the possible instances of the operating system in order to implement this functionality, we can implement it only once at the VMM layer. Second, the guest operating systems operate on an virtualized storage layer, which means that they might not even be aware there is a RAID that services their requests. Even with that knowledge, the layout of data on disk can be arbitrarily modified by the VMM, thus making the modeling more difficult. This challenge is a variation on the older conundrum of where to place functionality in a system [57]. Some optimizations often require information from several layers in the storage stack. For example, the anticipatory scheduling I/O scheduler [36] requires knowledge about the initiator of a request and about the disk model. This information allows the scheduler to preserve the
98 spatial locality already existent in a stream of requests issued by an application. The anticipatory scheduler is implemented at the operating system, though another alternative is to implement it at the disk level. In this later case, the disk needs additional information for each I/O request, namely the process that issued the request. In the case studies we presented we need to deploy models because of the lack of information about other layers. We conclude that if there is a choice of where to place a functionality, it is more beneficial to place the model closer to the device or entity that is actually modeled. This solution avoids interferences to the model from other layers that separate it from the target that is modeled. Portability is Important: Disks are Rarely the Same Most of the systems that we are targeting have high data demands, and often they are deployed on clusters of machines. The older concept that clusters are homogeneous is no longer valid. Disks fail [65, 82] and are replaced with newer revisions, clusters are continually upgraded or expanded [48]. Newer disks, even from the same company, and from the same line of products, can vary in their characteristics even from one revision to another. This means that portability is paramount when implementing any optimization or policy upgrade, and this is one of the reasons why we emphasized portability as an important characteristic of the models we proposed. In Chapter 4 we showed through experiments that the SMTF scheduler we propose, a throughput optimizing I/O scheduler, has better performance than the traditional schedulers, even when the characteristics of the disk vary widely. In a simulation environment we configured the disks with different parameters for the number of platters, rotation time, cylinder switch, track skew, cylinder skew etc. We did not have to modify the model to accommodate these different parameters. MiniMimic was used for modeling the part of the disk that holds a write ahead log and for guiding layout of synchronous writes. We deployed the model on SCSI and IDE disks with no modifications. This was a nice validation of the requirement to have the model portable across disks with several characteristics [3, 93]. Minimal Assumptions Keep the Model Simple: Graybox Techniques In dealing with systems as complex as hard disks, we learned that making some minimal assumptions about how the system behaves is beneficial. For example, a totally black box approach
99 to modeling would have been to consider all possible parameters that can influence the outcome of the disk, and keep them as input parameters. For example, at one extreme, we could have tracked all previous requests issued to the disk, with the assumption that the behavior of the current request is influenced by all the other requests serviced by the disk. This conservative approach would have rendered the deployment of these models in a running system almost impossible. Due to space and computational overheads, we choose to leverage knowledge about how the devices work and about how they are going to be used. For example, in Chapter 3 we make use of the knowledge that the I/O scheduler is going to be used in a data intensive system, and thus, the think time of the I/O requests is going to be zero, and think time does not have to be incorporated in the model. Additionally, using widely known information about how disks service requests helps to reason about the input parameters that best capture the behavior of the device. Intuitively, the inter-request distance is good predictor of the disk response: the disk head needs to move from the previous location of the disk to the new one, traversing a number of tracks. Timing a request and associating it with the inter-request distance captures aspects related to the disk geometry and data layout. Low Overhead is a Requirement: Runtime Usage Related to the previous point, the deployment of these models as an integral part of a system, at runtime, makes low overhead an important characteristic. The models are used on the critical path of I/O requests, thus, it is essential that they have a minimal impact on the system. This is a departure from the previous approach to modeling, where the emphasis is mainly placed on the accuracy of the model. The low overhead requirement comes along two axes: time and space overhead. By using a table based approach, finding a model prediction for a set of input parameters is reduced to simply indexing in a table. On a current computer this operation will take microseconds. The potential for space inflation required special care in designing the model used by the I/O scheduler at the operating system. We used interpolation, which allowed us to reduce the total space required by the model by 90%. With interpolation the model can make predictions for
100 sets of input parameters for which it does not have associated values, by using predictions for ’neighboring’ sets of parameters. Even with interpolation, special care needs to be paid to the space taken by the model, as it can still grow large, especially when considering the increasing capacities of current hard disks. Thus, we believe that a valid alternative is to use the model for applications similar to the synchronous writes problem, where only a portion of the disk needs to be sampled by the model. Alternatively, for the case study in Chapter 3, the I/O scheduler could make use of a hybrid model. This model could employ a more traditional coarse model, similar to the one used by C-LOOK, for large inter-request distances, where the seek time is the major component of the service time. For the smaller inter-request distances, the model would be the Disk Mimic, since it is successful in modeling the rotational latency, which is a larger component of the service time for this type of workload. Unknowns are a Given: Learn as You Go Deployment in a real system also requires a way of dealing with the unknown. For example, we want to be able to deploy these models in a system, and have them run when the system is taken out of the box. Unfortunately, we are faced with a problem: the model is asked to predict the behavior of a device (a hard disk) that it did not have the chance to observe. The on-line hybrid approach used with the SMTF scheduler is one solution to such a problem. For the times where the data-driven model has no information about the disk, we make use of a simpler disk model that does not require sampling the disk. This disk model is the one used by traditional schedulers (like C-LOOK): it assumes that the service time is proportional with the inter-request distance. Predictions of this model yield good enough performance till the data-driven model takes over. The data-driven model continually monitors the requests issued and the behavior of the disk, populating its table, and learning more about the disk as it sees more requests. Model only what is Needed: Partial Models The last observation we make is that we explored the possibility to develop partial models, as opposed to full system models. For disk drives, we use models to predict service times since this parameter is needed by the policies that use the models. Other parameters, such as rotations per
101 minute, or track-to-track switch times were not required and are not predicted by the model. This allows us to keep the models simple, and again facilitates their deployment. The schedulers we studied in the first two case studies needed to know which request is going to be serviced faster, and respectively if servicing a request is going to influence the service time of another one. The log skipper had to know where to write a log record on disk, such that the service time is minimal. All of these case studies made use of predictions of service time from the data-driven model. The last case study used a data-driven model to find out the stripe size of a RAID-5.
8.2
Future Work We see three main threads of future work that can be followed. First we can refine the process
we use to build the models. Second, we can explore in more detail building models for other devices. Third, we can look past performance oriented optimizations and use data-driven models to also improve reliability. We discuss in more detail each of these. Refine the Process of Building the Model The on-line models we have presented time the requests issued by an application. In the initial phase, the model has not seen too many requests, so we need to make use of a simpler model. We use a model that assumes that service time is proportional to the linear distance in logical block numbers between requests. We can refine the process of building these interim models. We could make use of explicit probes to test how the hard disk behaves for a combination of parameters that was not exercised by requests coming from the application. This allows us to use the periods the disk is not utilized, for example, to increase the number of inputs for which the model can make a prediction, or to increase the accuracy for some combinations of input parameters for which the model did not gather enough data.
102 The disadvantage of this approach is the pollution of the model with data that will never be exercised by an actual workload. For example, if a workload exercises only the first half of the disk, there is no point in gathering data for inter-request distances larger than that. Each of these approaches is suitable for different types of workloads. If a workload is localized, which means it accesses mostly data in within a certain distance of the current request, then using a reactive approach would work best. In this case, the model does not need to sample all the possible inter-request distances. Building the model benefits most from learning about the disk guided by the workload. In the alternative situation when the workload is highly random in the number of inter-requests distances it exercised, it could be beneficial to be more proactive in learning about the disks during idle periods. This will cut from the learning time and help build the model faster than waiting for the requests to be issued by the application. Model Other Devices The second line of future work involves building data-driven models for different devices, and modeling different aspects of the existing ones. As we mentioned, RAIDs are complex systems, and doing scheduling for them is challenging also. The operating system I/O scheduler could use a data-driven model of the RAID to better schedule requests. One alternative would be to move towards a black box approach [38], where we do not try to find out details about the RAID device setup, but use the same timing techniques as for building the models for the hard disk. This exploration path might require more space and time to build up the model because RAID systems have capacities larger than disks, and also they are more complex. RAIDs can routinely have tens of GB or RAM, and can employ different caching, prefetching and scheduling techniques. Care must be taken to incorporate these characteristics in the model. To simplify the approach to modeling, we could make use of previous research [21] that looked at finding out the characteristics of a RAID device: redundancy scheme, stripe and chunk size, number of disks. With this information, we would know which disk in the RAID will service each request, and could then use this information to perform scheduling on each disk in the RAID, using an SMTF scheduler.
103 Look Beyond Performance The third line of future work involves using data-driven models to predict reliability problems or to help indicate the existence of a problem in an existing system. By their nature, data-driven models observe systems and gather information about them over a long period of time. This information can be used to build self monitoring systems that alert the administrator. For example, when the system behaves in a manner that is inconsistent with previous behavior, a data-driven model can detect it since it has historical data. For example, the model can detect when requests that used to have a service time of 5 ms have a service time of 11 ms. In this situation, the model can trigger an alarm and inform that there is a change in the way the system behaves. Since the model observes what zones on the disk generate faulty behavior, the storage system can take proactive action and reorganize the data in those areas, or start replicate it to prevent actual data loss. Another benefit from observing the disk accesses is that the model has information about what data is frequently accessed, and thus, what data is important to the user. For example, the model can detect ’hot’ data and proactively replicate it, such that a disk failure does not affect data availability.
8.3
Summary In this dissertation we target a common problem encountered in complex, data driven systems:
the need for information about the components of the system. This situation occurs because of the way systems are built today, from layers interconnected with narrow interfaces, that do not expose much about their internals. While it seems natural for a system to have knowledge about everything that is going on within it, this is often not the case. Typically, when a decision needs to be made, a layer has to make assumptions about the behavior of other layers. Often these assumptions oversimplify the behavior of the other layers, causing the system as a whole to under perform. For example, the model associated with the C-LOOK scheduler assumes that the distance in sectors varies linearly with the service time. This approximation ignores the rotational time that can be a large component of the
104 service time, and thus, the I/O scheduling decisions could be improved with a model that does take rotation into consideration. We propose to improve the decisions that need to be made by using data-driven models. These models are built empirically, by observing data that is readily available, namely the timing of I/O requests that flow through the system. The big challenge in building these models is how to integrate them seamlessly into a running system, while still yielding good predictions and high performance. Building models that run in an active system, on-line, was not the main focus of other approaches that use modeling or simulations [27, 56]. We have identified characteristics of datadriven models that are desirable: portability, low overhead, automatic configuration. We have focused our attention on disks and built models for them since extracting good performance from disks can improve the performance of a storage system and the system as a whole by orders of magnitude. Also, because of their complexity, disks are notoriously difficult to model, thus building a model and incorporating it in a running system brings additional challenges that had not yet been addressed. We have used data-driven models for different tasks and needed to change the models according to the requirements of the application that uses them. For example, for a throughput-optimizing I/O scheduler we included inter-request distance and request type as part of the model, while for optimizing synchronous writes we needed to add think time also. We have explored data-driven models for different devices also, more specifically RAID. We were able to leverage lessons learned from data-driven models to disks, which makes us optimistic about further using these types of models elsewhere in the storage stack. One of the main challenges in building the data-driven models comes from the requirement to embed them in a running system. Especially the requirement to keep the space overhead low can prove difficult to satisfy, considering the size of current hard disks with capacities of 500 TB. One solution is to use techniques such as interpolation, to reduce the number of input parameters to store. A second alternative is to use hybrid techniques, as explained earlier in this chapter. Finally,
105 the third alternative is to focus on applications that by their nature require sampling only of a portion of the disk, such as the log skipper. Thus, the best applications to use with data-driven models are those that require modeling of a characteristic or portion of a device, rather than the whole device. This allows to keep the footprint of the model small, and best integrate it in a system. We conclude that data-driven models are a viable method of improving performance in a system. They prove to be one solution to overcoming the lack of information present in many instances of complex storage systems.
106
LIST OF REFERENCES
[1] Anurag Acharya. Reliability on the Cheap: How I Learned to Stop Worrying and Love Cheap PCs. EASY Workshop ’02, October 2002. [2] Marcos K. Aguilera, Jeffrey C. Mogul, Janet L. Wiener, Patrick Reynolds, and Athicha Muthitacharoen. Performance debugging for distributed systems of black boxes. In SOSP ’03: Proceedings of the nineteenth ACM symposium on Operating systems principles, pages 74–89, New York, NY, USA, 2003. ACM Press. [3] Dave Anderson, Jim Dykes, and Erik Riedel. More Than an Interface: SCSI vs. ATA. In Proceedings of the 2nd USENIX Symposium on File and Storage Technologies (FAST ’03), San Francisco, California, April 2003. [4] Eric Anderson. Simple table-based modeling of storage devices. Technical Report HPLSSP-2001-04, HP Laboratories, July 2001. [5] M. Andrews, M. Bender, and L. Zhang. New Algorithms for the Disk Scheduling Problem. In IEEE Symposium on Foundations of Computer Science (FOCS ’96), pages 550–559, 1996. [6] Apple. Technical Note TN1150. March 2004.
http://developer.apple.com/technotes/tn/tn1150.html,
[7] R. L. Arndt, D. C. Boutcher, R. G. Kovacs, D. Larson, K. A. Lucke, N. Nayar, , and R. C. Swanberg. Advanced virtualization capabilities of power5 systems. IBM Journal of Research and Development, 49(4):523–532, sept 2005. [8] Andrea C. Arpaci-Dusseau and Remzi H. Arpaci-Dusseau. Information and Control in Gray-Box Systems. In Proceedings of the 18th ACM Symposium on Operating Systems Principles (SOSP ’01), pages 43–56, Banff, Canada, October 2001.
107 [9] Andrea C. Arpaci-Dusseau, Remzi H. Arpaci-Dusseau, Nathan C. Burnett, Timothy E. Denehy, Thomas J. Engle, Haryadi S. Gunawi, James Nugent, and Florentina I. Popovici. Transforming Policies into Mechanisms with Infokernel. In Proceedings of the 19th ACM Symposium on Operating Systems Principles (SOSP ’03), pages 90–105, Bolton Landing (Lake George), New York, October 2003. [10] Steve Best. JFS Overview. www.ibm.com/developerworks/library/l-jfs.html, 2000. [11] Lawrence S. Brakmo, Sean W. O’Malley, and Larry L. Peterson. Tcp vegas: new techniques for congestion detection and avoidance. In SIGCOMM ’94: Proceedings of the Conference on Communications Architectures, Protocols and Applications, pages 24–35, New York, NY, USA, 1994. ACM Press. [12] Thomas C. Bressoud and Fred B. Schneider. Hypervisor-based fault tolerance. ACM Trans. Comput. Syst., 14(1):80–107, 1996. [13] Edouard Bugnion, Scott Devine, and Mendel Rosenblum. Disco: Running commodity operating systems on scalable multiprocessors. In Proceedings of the 16th ACM Symposium on Operating Systems Principles (SOSP ’97), pages 143–156, Saint-Malo, France, October 1997. [14] Chia Chao, Robert English, David Jacobson, Alexander Stepanov, and John Wilkes. Mime: a high performance parallel storage device with strong recovery guarantees. Technical Report HPL-CSP-92-9rev1, HP Laboratories, November 1992. [15] M. Chen, E. Kiciman, E. Fratkin, A. Fox, and E. Brewer. Pinpoint: Problem determination in large, dynamic, internet services, 2002. [16] Peter Chen and Edward K. Lee. Striping in a RAID Level 5 Disk Array. In Proceedings of the 1995 ACM SIGMETRICS Conference on Measurement and Modeling of Computer Systems (SIGMETRICS ’95), pages 136–145, Ottawa, Canada, May 1995. [17] Peter M. Chen, Edward K. Lee, Garth A. Gibson, Randy H. Katz, and David A. Patterson. RAID: High-performance, Reliable Secondary Storage. ACM Computing Surveys, 26(2):145–185, June 1994. [18] Trishul M. Chilimbi, Mark D. Hill, and James R. Larus. Cache-conscious structure layout. SIGPLAN Not., 34(5):1–12, 1999. [19] Sailesh Chutani, Owen T. Anderson, Michael L. Kazar, Bruce W. Leverett, W. Anthony Mason, and Robert N. Sidebotham. The Episode File System. In Proceedings of the USENIX Winter Technical Conference (USENIX Winter ’92), pages 43–60, San Francisco, California, January 1992.
108 [20] Christopher Clark, Keir Fraser, Steven Hand, Jacob Gorm Hansen, Eric Jul, Christian Limpach, Ian Pratt, and Andrew Warfield. Live migration of virtual machines. In Proceedings of the 2nd Symposium on Networked Systems Design and Implementation (NSDI ’05), Boston, Massachusetts, May 2005. [21] Timothy E. Denehy, John Bent, Florentina I. Popovici, Andrea C. Arpaci-Dusseau, and Remzi H. Arpaci-Dusseau. Deconstructing Storage Arrays. In Proceedings of the 11th International Conference on Architectural Support for Programming Languages and Operating Systems (ASPLOS XI), pages 59–71, Boston, Massachusetts, October 2004. [22] E. W. Dijkstra. The Structure of the THE Multiprogramming System. Communications of the ACM, 11(5):341–346, May 1968. [23] Boris Dragovic, Keir Fraser, Steve Hand, Tim Harris, Alex Ho, Ian Pratt, Andrew Warfield, Paul Barham, and Rolf Neugebauer. Xen and the Art of Virtualization. In Proceedings of the 19th ACM Symposium on Operating Systems Principles (SOSP ’03), Bolton Landing (Lake George), New York, October 2003. [24] Bill Gallagher, Dean Jacobs, and Anno Langen. A high-performance, transactional filestore for application servers. In SIGMOD ’05: Proceedings of the 2005 ACM SIGMOD international conference on Management of data, pages 868–872, New York, NY, USA, 2005. ACM Press. [25] Gregory R. Ganger. Blurring the Line Between Oses and Storage Devices. Technical Report CMU-CS-01-166, Carnegie Mellon University, December 2001. [26] Gregory R. Ganger and Yale N. Patt. Metadata Update Performance in File Systems. In Proceedings of the 1st Symposium on Operating Systems Design and Implementation (OSDI ’94), pages 49–60, Monterey, California, November 1994. [27] Gregory R. Ganger, Bruce L. Worthington, and Yale N. Patt. DiskSim Simulation Environment Version 2.0 Reference http://citeseer.nj.nec.com/article/ganger99disksim.html.
The Manual.
[28] Tal Garfinkel, Ben Pfaff, Jim Chow, Mendel Rosenblum, and Dan Boneh. Terra: A Virtual Machine-Based Platform for Trusted Computing. In Proceedings of the 19th ACM Symposium on Operating Systems Principles (SOSP ’03), Bolton Landing (Lake George), New York, October 2003. [29] R.P. Goldberg. Survey of Virtual Machine Research. IEEE Computer, 7(6):34–45, 1974. [30] C. Gotlieb and G. MacEwen. Performance of movable-head disk storage devices. Journal of the Association for Computing Machinery, 20(4):604–623, 1973. [31] Jim Gray and Andreas Reuter. Transaction Processing: Concepts and Techniques. Morgan Kaufmann, 1993.
109 [32] Robert Hagmann. Reimplementing the Cedar File System Using Logging and Group Commit. In Proceedings of the 11th ACM Symposium on Operating Systems Principles (SOSP ’87), Austin, Texas, November 1987. [33] Dave Hitz, James Lau, and Michael Malcolm. File System Design for an NFS File Server Appliance. In Proceedings of the USENIX Winter Technical Conference (USENIX Winter ’94), San Francisco, California, January 1994. [34] Micha Hofri. Disk scheduling: FCFS vs.SSTF revisited. Communications of the ACM, 23(11):645–653, 1980. [35] L. Huang and T. Chiueh. Implementation of a rotation latency sensitive disk scheduler. Technical Report ECSL-TR81, SUNY, Stony Brook, March 2000. [36] Sitaram Iyer and Peter Druschel. Anticipatory scheduling: A disk scheduling framework to overcome deceptive idleness in synchronous I/O. In Proceedings of the 18th ACM Symposium on Operating Systems Principles (SOSP ’01), pages 117–130, Banff, Canada, October 2001. [37] D. M. Jacobson and J. Wilkes. Disk Scheduling Algorithms Based on Rotational Position. Technical Report HPL-CSP-91-7, Hewlett Packard Laboratories, 1991. [38] Terence Kelly, Ira Cohen, Moises Goldszmidt, and Kimberly Keeton. Inducing models of black-box storage arrays. Technical Report HPL-2004-108, HP Laboratories, 2004. [39] T. Kilburn, D. B. G. Edwards, M. J. Lanigan, and F. H. Summer. One-level Storage System. IRE Transactions on Electronic Computers, EC-11:223–235, April 1962. [40] Samuel T. King and Peter M. Chen. Backtracking Intrusions. In Proceedings of the 18th ACM Symposium on Operating Systems Principles (SOSP ’01), Banff, Canada, October 2001. [41] David Kotz, Song Bac Toh, and Sriram Radhakrishnan. A detailed simulation model of the HP 97560 disk drive. Technical Report TR94-220, Dartmouth College, 1994. [42] Butler W. Lampson. Hints for Computer System Design. In Proceedings of the 9th ACM Symposium on Operating System Principles (SOSP ’83), pages 33–48, Bretton Woods, New Hampshire, October 1983. [43] C. Lumb, J. Schindler, G.R. Ganger, D.F. Nagle, and E. Riedel. Towards Higher Disk Head Utilization: Extracting “Free” Bandwidth From Busy Disk Drives. In Proceedings of the 4th Symposium on Operating Systems Design and Implementation (OSDI ’00), pages 87–102, San Diego, California, October 2000. [44] Christopher R. Lumb, Jiri Schindler, and Gregory R. Ganger. Freeblock Scheduling Outside of Disk Firmware. In Proceedings of the 1st USENIX Symposium on File and Storage Technologies (FAST ’02), pages 10–22, Monterey, California, January 2002.
110 [45] Marshall K. McKusick, William N. Joy, Sam J. Leffler, and Robert S. Fabry. A Fast File System for UNIX. ACM Transactions on Computer Systems, 2(3):181–197, August 1984. [46] Microsoft. Microsoft virtual server. http://www.microsoft.com/windowsserversystem /virtualserver/default.mspx. [47] David Patterson, Garth Gibson, and Randy Katz. A Case for Redundant Arrays of Inexpensive Disks (RAID). In Proceedings of the 1988 ACM SIGMOD Conference on the Management of Data (SIGMOD ’88), pages 109–116, Chicago, Illinois, June 1988. [48] Eduardo Pinheiro, Wolf-Dietrich Weber, and Luiz Andr Barroso. Failure trends in a large disk drive population. In FAST’07: Proceedings of the 5th USENIX Conference on File and Storage Technologies, 13-16 February 2007, San Jose, CA, USA, pages 17–28, 2007. [49] Florentina I. Popovici, Andrea C. Arpaci-Dusseau, and Remzi H. Arpaci-Dusseau. Robust, Portable I/O Scheduling with the Disk Mimic. In Proceedings of the USENIX Annual Technical Conference (USENIX ’03), pages 297–310, San Antonio, Texas, June 2003. [50] Vijayan Prabhakaran, Lakshmi N. Bairavasundaram, Nitin Agrawal, Haryadi S. Gunawi, Andrea C. Arpaci-Dusseau, and Remzi H. Arpaci-Dusseau. IRON File Systems. In Proceedings of the 20th ACM Symposium on Operating Systems Principles (SOSP ’05), pages 206–220, Brighton, United Kingdom, October 2005. [51] Hans Reiser. ReiserFS. www.namesys.com, 2004. [52] Peter M. Ridge and Gary Field. The Book of SCSI 2/E. No Starch, June 2000. [53] Mendel Rosenblum and John Ousterhout. The Design and Implementation of a LogStructured File System. ACM Transactions on Computer Systems, 10(1):26–52, February 1992. [54] Chris Ruemmler and John Wilkes. Disk Shuffling. Technical Report HPL-91-156, Hewlett Packard Laboratories, 1991. [55] Chris Ruemmler and John Wilkes. Unix disk access patterns. In Proceedings of the USENIX Winter 1993 Technical Conference, pages 405–420, 1993. [56] Chris Ruemmler and John Wilkes. An Introduction to Disk Drive Modeling. IEEE Computer, 27(3):17–28, March 1994. [57] Jerome H. Saltzer, David P. Reed, and David D. Clark. End-to-end arguments in system design. ACM Transactions on Computer Systems, 2(4):277–288, November 1984. [58] Stefan Savage and John Wilkes. AFRAID — A Frequently Redundant Array of Independent Disks. In Proceedings of the USENIX Annual Technical Conference (USENIX ’96), pages 27–39, San Diego, California, January 1996.
111 [59] J. Schindler, A. Ailamaki, and G. Ganger. Lachesis: robust database storage management based on device-specific performance characteristics, 2003. [60] J. Schindler and G. Ganger. Automated disk drive characterization. Technical Report CMUCS-99-176, Carnegie Mellon University, November 1999. [61] Jiri Schindler, John Linwood Griffin, Christopher R. Lumb, and Gregory R. Ganger. Trackaligned Extents: Matching Access Patterns to Disk Drive Characteristics. In Proceedings of the 1st USENIX Symposium on File and Storage Technologies (FAST ’02), Monterey, California, January 2002. [62] Jiri Schindler, Steven W. Schlosser, Minglong Shao, Anastassia Ailamaki, and Gregory R. Ganger. Atropos: A Disk Array Volume Manager for Orchestrated Use of Disks. In Proceedings of the 3rd USENIX Symposium on File and Storage Technologies (FAST ’04), San Francisco, California, April 2004. [63] Steven W. Schlosser and Gregory R. Ganger. MEMS-based storage devices and standard disk interfaces: A square peg in a round hole? In Proceedings of the 3rd USENIX Symposium on File and Storage Technologies (FAST ’04), pages 87–100, San Francisco, California, April 2004. [64] Steven W. Schlosser, Jiri Schindler, Stratos Papadomanolakis, Minglong Shao, Anastassia Ailamaki, Christos Faloutsos, and Gregory R. Ganger. On multidimensional data and modern disks. In Proceedings of the 4th USENIX Symposium on File and Storage Technologies (FAST ’05), San Francisco, California, December 2005. [65] Bianca Schroeder and Garth Gibson. Disk failures in the real world: What does an MTTF of 1,000,000 hours mean to you? In Proceedings of the 5th USENIX Symposium on File and Storage Technologies (FAST ’07), pages 1–16, San Jose, California, February 2007. [66] M. Seltzer, P. Chen, and J. Ousterhout. Disk scheduling revisited. In Proceedings of the USENIX Winter 1990 Technical Conference, pages 313–324, Berkeley, CA, 1990. [67] Margo Seltzer, Peter Chen, and John Ousterhout. Disk Scheduling Revisited. In Proceedings of the USENIX Winter Technical Conference (USENIX Winter ’90), pages 313–324, Washington, D.C, January 1990. [68] Margo Seltzer, Keith A. Smith, Hari Balakrishnan, Jacqueline Chang, Sara McMains, and Venkata Padmanabhan. File System Logging versus Clustering: A Performance Comparison. In Proceedings of the USENIX Annual Technical Conference (USENIX ’95), pages 249–264, New Orleans, Louisiana, January 1995. [69] Margo I. Seltzer, Gregory R. Ganger, M. Kirk McKusick, Keith A. Smith, Craig A. N. Soules, and Christopher A. Stein. Journaling Versus Soft Updates: Asynchronous Meta-data Protection in File Systems. In Proceedings of the USENIX Annual Technical Conference (USENIX ’00), pages 71–84, San Diego, California, June 2000.
112 [70] Margo I. Seltzer and Christopher Small. Self-Monitoring and Self-Adapting Systems. In Proceedings of the 1997 Workshop on Hot Topics on Operating Systems, Chatham, MA, May 1997. [71] M. Shao, J. Schindler, S. Schlosser, A. Ailamaki, and G. Ganger. Clotho: decoupling memory page layout from storage organization, 2004. [72] P. Shenoy and H.M. Vin. Cello: A Disk Scheduling Framework for Next-generation Operating Systems. In Proceedings of the 1998 Joint International Conference on Measurement and Modeling of Computer Systems (SIGMETRICS/PERFORMANCE ’98), pages 44–55, Madison, Wisconsin, June 1998. [73] Elizabeth A. M. Shriver, Arif Merchant, and John Wilkes. An analytic behavior model for disk drives with readahead caches and request reordering. In Proceedings of 1998 SIGMETRICS Conference on Measurement and Modeling of Computer Systems, pages 182–191, 1998. [74] Muthian Sivathanu, Lakshmi N. Bairavasundaram, Andrea C. Arpaci-Dusseau, and Remzi H. Arpaci-Dusseau. Database-Aware Semantically-Smart Storage. In Proceedings of the 4th USENIX Symposium on File and Storage Technologies (FAST ’05), pages 239– 252, San Francisco, California, December 2005. [75] Muthian Sivathanu, Vijayan Prabhakaran, Florentina I. Popovici, Timothy E. Denehy, Andrea C. Arpaci-Dusseau, and Remzi H. Arpaci-Dusseau. Semantically-Smart Disk Systems. In Proceedings of the 2nd USENIX Symposium on File and Storage Technologies (FAST ’03), pages 73–88, San Francisco, California, April 2003. [76] Avinash Sodani and Gurindar S. Sohi. Dynamic instruction reuse. In ISCA ’97: Proceedings of the 24th annual international symposium on Computer architecture, pages 194–205, New York, NY, USA, 1997. ACM Press. [77] David A. Solomon. Inside Windows NT. Microsoft Programming Series. Microsoft Press, 2nd edition, May 1998. [78] Sun Microsystems. Sun http://www.sun.com/virtualization, 2007.
consolidation
and
virtualization.
[79] Adan Sweeney, Doug Doucette, Wei Hu, Curtis Anderson, Mike Nishimoto, and Geoff Peck. Scalability in the XFS File System. In Proceedings of the USENIX Annual Technical Conference (USENIX ’96), San Diego, California, January 1996. [80] Nisha Talagala, Remzi H. Arpaci-Dusseau, and Dave Patterson. Microbenchmark-based Extraction of Local and Global Disk Characteristics. Technical Report CSD-99-1063, University of California, Berkeley, 1999.
113 [81] Toby J. Teorey and Tad B. Pinkerton. A comparative analysis of disk scheduling policies. Communications of the ACM, 15(3):177–184, 1972. [82] The Data Clinic. Hard Disk Failure. http://www.dataclinic.co.uk/hard-disk-failures.htm, 2004. [83] Niki C. Thornock, Xiao-Hong Tu, and J. Kelly Flanagan. A Stochastic Disk I/O Simulation Technique. In Proceedings of the 1997 Winter Simulation Conference, pages 1079–1086, 1997. [84] Transaction Processing Council. TPC Benchmark B Standard Specification, Revision 3.2. Technical Report, 1990. [85] Theodore Ts’o and Stephen Tweedie. Future Directions for the Ext2/3 Filesystem. In Proceedings of the USENIX Annual Technical Conference (FREENIX Track), Monterey, California, June 2002. [86] Stephen C. Tweedie. Journaling the Linux ext2fs File System. In The Fourth Annual Linux Expo, Durham, North Carolina, May 1998. [87] Tzi-cker Chiueh and Lan Huang. Track-based disk logging. In Proceedings of International Conference on Dependable Systems and Networks (DSN 2002), 23-26 June 2002, Bethesda, MD, USA, pages 429–438, 2002. [88] Carl A. Waldspurger. Memory Resource Management in VMware ESX Server. In Proceedings of the 5th Symposium on Operating Systems Design and Implementation (OSDI ’02), Boston, Massachusetts, December 2002. [89] Mengzhi Wang, Kinman Au, Anastassia Ailamaki, Anthony Brockwell, Christos Faloutsos, and Gregory R. Ganger. Storage device performance prediction with cart models. MASCOTS, 00:588–595, 2004. [90] Randy Wang, Thomas E. Anderson, and David A. Patterson. Virtual Log-Based File Systems for a Programmable Disk. In Proceedings of the 3rd Symposium on Operating Systems Design and Implementation (OSDI ’99), New Orleans, Louisiana, February 1999. [91] John Wehman and Peter den Haan. The Enhanced IDE/Fast-ATA FAQ. nym.sci.kun.nl/cgi-pieterh/atazip/atafq.html, 1998.
http://thef-
[92] Andrew Whitaker, Marianne Shaw, and Steven D. Gribble. Scale and Performance in the Denali Isolation Kernel. In Proceedings of the 5th Symposium on Operating Systems Design and Implementation (OSDI ’02), Boston, Massachusetts, December 2002. [93] B. White, W. Ng, and B. Hillyer. Performance Comparison of IDE and SCSI Disks. Bell Labs Technical Report, 2001.
114 [94] Neil C. Wilhelm. An anomaly in disk scheduling: a comparison of FCFS and SSTF seek scheduling using an empirical model for disk accesses. Communications of the ACM, 19(1):13–17, 1976. [95] J. Wilkes. The pantheon storage-system simulator, 1995. [96] John Wilkes, Richard Golding, Carl Staelin, and Tim Sullivan. The HP AutoRAID Hierarchical Storage System. ACM Transactions on Computer Systems, 14(1):108–136, February 1996. [97] B. L. Worthington, G. R. Ganger, and Y. N. Patt. Scheduling algorithms for modern disk drives. In Proceedings of the 1994 ACM SIGMETRICS Conference on Measurement and Modeling of Computer Systems, pages 241–251, Nashville, TN, USA, 16–20 1994. [98] Bruce L. Worthington, Greg R. Ganger, Yale N. Patt, and John Wilkes. On-Line Extraction of SCSI Disk Drive Parameters. In Proceedings of the 1995 ACM SIGMETRICS Conference on Measurement and Modeling of Computer Systems (SIGMETRICS ’95), pages 146–156, Ottawa, Canada, May 1995. [99] Tse-Yu Yeh and Yale N. Patt. Two-level adaptive training branch prediction. In MICRO 24: Proceedings of the 24th annual international symposium on Microarchitecture, pages 51–61, New York, NY, USA, 1991. ACM Press. [100] Xiang Yu, Benjamin Gum, Yuqun Chen, Randolph Y. Wang, Kai Li, Arvind Krishnamurthy, and Thomas E. Anderson. Trading capacity for performance in a disk array. In Proceedings of the 2000 Symposium on Operating Systems Design and Implementation, pages 243–258, San Diego, 2000. USENIX Association.