tool allows not only to generate the relational reconciled schema, but also ..... http://www.adobe.com/products/photoshop.html (last accessed May 20, 2014). 2.
Data Integration by Conceptual Diagrams Loredana Caruccio, Vincenzo Deufemia, Mara Moscariello, and Giuseppe Polese Department of Management and Information Technology Universit` a di Salerno via Giovanni Paolo II, 132, Fisciano(SA), Italy {lcaruccio,deufemia,gpolese}@unisa.it
Abstract. We present a visual language based approach and tool to perform data integration at conceptual level, aiming to reduce the complexity of such task when integrating numerous and complex data sources. The visual language provides iconic operators to manipulate the constructs of conceptual data schemas of database sources, in order to specify how to merge and map them to a reconciled schema. The proposed tool allows not only to generate the relational reconciled schema, but also to automatically generate metadata and inference mechanisms to guarantee the loading and periodical refresh of data from source databases. Finally, we evaluated CoDIL through a usability study. Keywords: Data Integration, Data Source, Data Reconciliation, Conceptual Data Schema.
1
Introduction
The reconciliation of multiple heterogeneous data sources entails detecting correspondences among concepts represented in source schemas, and resolving conflicts in order to create a unified global schema whose constructs are related (mapped) to constructs of local source schemas [5,6,10]. This is a complex operation originally carried out by means of manually coded ETL procedures, yielding a time consuming activity, which required the involvement of people with programming skills. In the literature, we can find several software tools providing automated support to the data integration process [7,13,16]. Since this type of tools suffers from scale-up problems when integrating complex data sources, researchers have started investigating higher level approaches [9,15,18], aiming to derive conceptual-level, platform-independent design approaches, including techniques for their automatic implementation [14,17]. With respect to these approaches, in this paper we propose an integrated approach using a visual language based front-end to simplify the specification of the data integration process [8], and back-end logic inference mechanisms to support implementation [3]. We also present a user study in which we have evaluated front-end usability and the overall contribution to complexity reduction and productivity improvement. The underlying visual language has resulted easy to learn for accomplishing sufficiently complex data integration tasks. H. Decker et al. (Eds.): DEXA 2014, Part II, LNCS 8645, pp. 311–318, 2014. c Springer International Publishing Switzerland 2014 �
312
L. Caruccio et al.
The paper is organized as follows. Section 2 describes the visual front-end, whereas Section 3 describes the implemented tool. Language and tool evaluation is presented in Section 4. Finally, summary and concluding remarks are included in Section 5.
2
The Visual Front-End
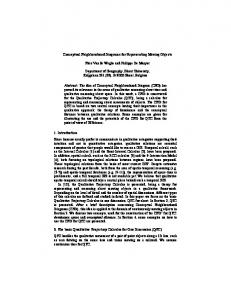
The visual front-end has its backbone in the visual CoDIL [8], which provides icon operators specifying mappings between pairs of conceptual data subschemas. In addition, the visual front-end provides layering mechanisms for help focusing on the current subschemas to be mapped, and a simulator showing the evolution of the reconciled schema as the data integration process progresses, as shown in Figure 1. Notice that the central part of the window contains the palette of icon operators that have been applied. A more detailed description of main icon operators of CoDIL is shown in Table 1.
Fig. 1. Application of a horizontal relationship partitioning equivalence operator
In particular, Figure 1 shows a scenario in which the DBA has compared two pairs of subschemas from the compared source subschemas. In the first case, s/he has selected the vertical partitioning operator to indicate that the relationship between entities Employment and Master Data in the right window must be adopted in the reconciled schema, and that the entity Employee from the left window must be mapped to it. In the second case, s/he has selected the horizontal-partitioning operator to indicate that the relationship Manages from the left window must be adopted in the reconciled schema, and the pair of
Data Integration by Conceptual Diagrams
Table 1. A portion of the icon operators dictionary of CoDIL Operator indicating that the same concept has been modeled as a simple attribute in the left hand side schema and as a derivable attribute in the right hand side schema. This operator indicates that the same concept has been modeled as a simple attribute in the left hand side schema and as a composite attribute in the right hand side schema. Indicates that the same concept has been modeled as an attribute in the left hand side schema and as a relation between two entities.
This operator indicates that the same relationship has been modeled as an attribute in the left hand side schema and as a relation between two entities.
Indicates a horizontal decomposition.
Indicates a vertical decomposition.
Indicates that an inheritance relationship in the left hand side schema is collapsed in the specialized entities of the right hand side schema.
This operator indicates an inheritance relationship in the left hand side schema that is collapsed in the generalized entity of the right hand side schema. This operator indicates that an inheritance relationship in the left hand side schema is implemented using relationships in the right hand side schema.
313
314
L. Caruccio et al.
relationships Manages and Managed from the right window must be mapped to it. Notice that color patterns are used both to highlight the currently compared sub-schemas, and the window containing the solution to be adopted for the reconciled schema (e.g., highlighting through the green color the border of the icon operator half that is closest to the window containing the adopted solution). In order to avoid cluttering the screen, the DBA can disable the coloring of a previously selected operator, similarly to the technique of layers used in image editing tools [1]. The semantics of CoDIL has been modeled by means of Description Logic [3], which provided us the basis to construct inference mechanisms to support the implementation of the visually specified data integration processes.
3
System Prototype
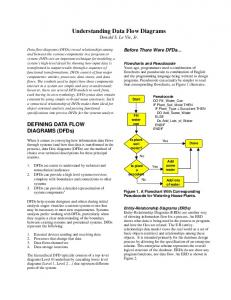
The visual front-end and back-end modules have been implemented within the Conceptual Data Integration Tool (CoDIT), whose architecture is shown in Figure 2. The Visual Editor supports the data integration specification process described in the previous section. The Reconciled Schema Generator provides automated ER to relational mapping like most conceptual modeling CASE tools [4]. Its output is the relational schema of the reconciled database, and it is stored in the system catalog. The Data Loader is a module responsible for extracting the data from sources and for loading them in the reconciled database, after transformations accomplished by means of metadata and scripts generated from the visual editor. Finally, the system relies on third-party tools to perform relational to ER reverse engineering when needed [2].
4
Evaluation
The experiments we present in this section aim to evaluate the usability of the visual front-end, and its contribution to the effectiveness of the data integration process in terms of simplicity of use and time requested. 4.1
Methodology
The tool has been evaluated by means of several experiments involving fifteen graduate students in Computer Science attending an advanced database course. They were between 25 and 29 years old and had attended an undergraduate course on database, hence they were all familiar with ER modeling. Three of them had also an industrial experience in information system development, but none had attended a course or had a professional experience in data integration topics. The study has been organized in steps by using the think-aloud technique, an approach originating in cognitive psychology [11]. Before starting the experiments, we spent two hours to introduce participants with some notions of
Data Integration by Conceptual Diagrams
315
Fig. 2. System architecture and the process for generating the reconciled schema
database schema level integration, the visual language CoDIL, and CoDIT functionalities, followed by two hours of exercises on some sample data integration tasks with CoDIT. Successively, participants were asked to fill a pre-task questionnaire, to perform a complete data integration task involving two Clinical data sources, and finally to fill a post-task questionnaire. During the task we did not provide support to participants in order to avoid biasing the experiment. The goal of the pre-task questionnaire was to assess the acquired familiarity with the tool CoDIT, and contained three questions. In the first one, participants were requested to observe a CoDIT screenshot, with a pair of highlighted subschemas from the two windows, and to select a proper icon operator to express the conceptual link between them. In the second question, participants were given an icon operator, and were requested to highlight at least a pair of subschemas that could be related based on it. Finally, in the third question, participants were shown twelve pairs of conceptually equivalent subschemas, and were requested to specify for each pair the icon operator most suitable to express their conceptual relationships. Regarding the data integration task, participants were given two source conceptual schemas of clinical records, and a possible reconciled version of them. Then, participants were given two hours to derive the reconciled schema from the two source schemas by using CoDIT. Successively, they were asked to fill the post-task questionnaire in Figure 3 as a feedback of their experience with CoDIL and CoDIT. Answers to questions from 1 to 9 were given according to a Likert scale [12]: from 1 (very low) to 5 (very high); answers to questions 10 and 11 required specifying one of the icon operators; finally the remaining were open answer questions.
316
L. Caruccio et al.
Fig. 3. Usability questionnaire
4.2
Results
Pre-task Questionnaire. All participants provided a correct answer to question one. Regarding question two, eleven participants provided a correct solution, whereas four provided a wrong solution. For question three, eight participants correctly associated all the twelve pairs of sub-schemas through the right icon operators, whereas a participant made one error, three made two errors, two made three errors, and one made five errors. The errors revealed that main difficulties were with the application of operators concerning generalization/specialization hierarchies and with the transitive closure of relationships. Task Accomplishment. Eight participants successfully completed the task, whereas five of them completed the task with some errors. Approximately, their solutions were at least eighty percent correct. Finally, two participants completed about half of the whole task with some errors. The process followed by the thirteen participants completing the task had some differences in the selected icon operators and/or in their application order. It is worth to note that although two solutions might be semantically equivalent, they might yield different complexity for the back-end phases to be successively handled by CoDIT, e.g., ER to relational schema mapping and consequently, periodical data refresh from sources. Thus, although equivalent, different solutions might be of different quality. In order to compare the quality of the eight correct solutions, for each of them we have automatically generated the integrated database, and have run a data refresh session using two source databases. Regarding the five complete solutions with errors, they were wrong in the specification of constraints for some icon operators, especially for transitive closure and generalization/specialization hierarchies. Post-task Questionnaire. Figure 4 shows for the average values of user answers to the post-task questionnaire. In particular, the minimum and maximum peaks show that most participants considered the task demanding (question 1), and the semantics of icon operators intuitive (question 8). Moreover, the peak of question 7 reveals that the tool still needs some engineering work to improve
Data Integration by Conceptual Diagrams
317
Fig. 4. The average values of user answers to the post-task questionnaire
messages and warning dialogues. Regarding question 10, most of them indicated the transitive closure operator and its application as the most complex one, except two who indicated generalization/specialization hierarchy operators. For question 11, five of them indicated an attribute mapping operator as the simplest one, six indicated a conflict operator, and two the entity partitioning operators. Regarding the responses to questions 12 and 13, the participants considered the intuitiveness of icon operators and the layering mechanisms as the most appealing feature of CoDIT, whereas the graphical layout management and the specification of constraints for icon operators as the least liked one. Based on these results, we can conclude that CoDIL, and the associated tool CoDIT, appear to be sufficiently intuitive to use, and have the potential of making the data integration process quite effective.
5
Conclusion and Future Work
We have proposed an approach and a system to simplify the specification of the data integration process. It provides a visual front-end based on the visual language CoDIL and several lower level modules supporting implementation tasks. A usability study involving undergraduate students in computer science confirmed language intuitiveness and potential for reducing the inherent complexity of the data integration process. In the future we would like to investigate the possibility of using the principles of design patterns to define composed operators representing good integration practices to be used in future data integration projects. Moreover, we would like to investigate the possibility of introducing gestures in CoDIL, and to verify the possibility of a Sketch-based implementation of the whole approach.
318
L. Caruccio et al.
References 1. Adobe: Photoshop creative cloud, http://www.adobe.com/products/photoshop.html (last accessed May 20, 2014) 2. Alalfi, M.H., Cordy, J.R., Dean, T.R.: SQL2XMI: Reverse engineering of umler diagrams from relational database schemas. In: Proceedings of 20th Working Conference on Reverse Engineering (WCRE), pp. 187–191 (2008) 3. Baader, F., Calvanese, D., McGuinness, D.L., Nardi, D., Patel-Schneider, P.F.: Description Logic Handbook. Cambridge University Press (2003) 4. Batini, C., Ceri, S., Navathe, S.B.: Conceptual Database Design: An Entityrelationship Approach. Benjamin-Cummings Publ., Redwood (1992) 5. Calvanese, D., De Giacomo, G., Lenzerini, M., Nardi, D., Rosati, R.: Data integration in data warehousing. International Journal of Cooperative Information Systems 10(3), 237–271 (2001) 6. Castano, S., De Antonellis, V.: Global viewing of heterogeneous data sources. IEEE Transactions on Knowledge and Data Engineering 13(2), 277–297 (2001) 7. Deufemia, V., Giordano, M., Polese, G., Tortora, G.: A visual language-based system for extraction-transformation-loading development. Software: Practice and Experience (2013), http://dx.doi.org/10.1002/spe.2201 8. Deufemia, V., Moscariello, M., Polese, G.: Visually integrating databases at conceptual level. In: Proceedings of the International Working Conference on Advanced Visual Interfaces (AVI 2014), pp. 359–360 (2014) 9. El Akkaoui, Z., Zimanyi, E.: Defining ETL worfklows using BPMN and BPEL. In: Proceedings of the ACM 12th International Workshop on Data Warehousing and OLAP (DOLAP), pp. 41–48 (2009) 10. Halevy, A., Rajaraman, A., Ordille, J.: Data integration: The teenage years. In: Proceedings of the 32nd International Conference on Very Large Data Bases (VLDB), pp. 9–16 (2006) 11. Norman, K.L., Panizzi, E.: Levels of automation and user participation in usability testing. Interacting with Computers 18(2), 246–264 (2006) 12. Oppenheim, A.N.: Questionnaire design, interviewing, and attitude measurement. Martin’s Press, London (1992) 13. Pentaho: Kettle, http://community.pentaho.com/projects/data-integration/ (last accessed May 20, 2014) 14. Rizzolo, F., Kiringa, I., Pottinger, R., Wong, K.: The conceptual integration modeling framework: Abstracting from the multidimensional model. CoRR abs/1009.0255 (2010) 15. Simitsis, A., Skoutas, D., Castellanos, M.: Representation of conceptual etl designs in natural language using semantic web technology. Data Knowl. Eng. 69(1), 96– 115 (2010) 16. Talend: Open studio, http://www.talend.com (last accessed May 20, 2014) 17. Vassiliadis, P., Simitsis, A., Skiadopoulos, S.: Conceptual modeling for ETL processes. In: Proceedings of the 5th ACM International Workshop on Data Warehousing and OLAP (DOLAP), pp. 14–21 (2002) 18. Wilkinson, K., Simitsis, A.: Designing integration flows using hypercubes. In: Proceedings of the 14th International Conference on Extending Database Technology (EDBT/ICDT), pp. 503–508 (2011)