Data mining approach in seizure detection Mohammad Khubeb Siddiqui
Md Zahidul Islam
School of Computing and Mathematics Charles Sturt University Bathurst, Australia
[email protected]
Abstract- Extracting the meaningful patterns from time series dataset is one of the interesting and challenging task of data mining especially from time series brain dataset.
A seizure can be
detected either by EEG or ECoG signal. The applied ECoG dataset is of sample size 400Hz and it has two class values one is ictal (seizure) another is pre-ictal (before seizure). The previous study is not much sufficient to classify the state of seizures on the ground of classifier decision forest. In this paper, we classify the seizure states and motivates the importance of electrodes which are placed on the brain surface. Our analysis suggests through the systematic forest (SysFor) a type of decision forest that some electrodes are more fruitful to detect the seizure and found two features 'min' and 'max' are the best features. The pattern also reveals three trees detect seizure if the root attribute values are less than the value of selected attribute, and seven trees detect the
School of Computing and Mathematics Charles Sturt University Bathurst, Australia
[email protected]
Recently the seizure detection is done using classifier random forest of data mining [2]. In the present investigation, the ECoG dataset is used for seizure (ictal) detection. The dataset comprises of total sixteen files; eight for ictal and eight for preictal, and each file has 76 electrodes. We want to clarify what basically electrodes are? Electrodes [22] of the ECoG machine which are implanted in the brain in an invasive manner are used to measure the voltage. In the present dataset, the values represent the voltage. The description of the dataset is mentioned in 'feature extraction' of section Ill. We extract the time domain features and build the decision forest based on decision tree each tree generates a set of rules e.g. ECIO_Max if 448.09 ictal;8, preictal;O.
seizure if root attribute values are greater than the selected value
H. LITERATURE REVIEW
of root attribute.
Keywords-decision tree; systematic forest; Electrocorticogram (ECoG); seizure detection I.
INTRODUCTION
Epilepsy is not a newly diagnosed disease, it has been recognized as a disease since thousand years. History revealed that many famous personalities including Alexander, Aristotle, Alfred, Julius Caesar, Socrates, Napoleon Bonaparte and many others had this disease [10, 11]. The meaning of epilepsy came from a Greek word 'Epilambanein' that means to seize upon, to lay hold of, and to overtake [5, 8]. Epilepsy is a common neurological disorder in the brain that has been defined by various aspects. Statistics shows around 65 million people are detected with epilepsy globally [9]. The electroencephalograph (EEG) and electrocorticogram (ECoG) signal is strongly used to monitor the brain signals When the EEG electrodes are implanted in an invasive manner on the surface of the brain then it is termed as ECoG. The signals received are time series in nature, which are heavily used in seizure detection and its intervention. The time series data is a set of surveillance made with the sequence of time. The characteristic of time series data is high dimensional, big in size because it is calculated with respect with time [17]. Data mining can be potentially applied to time series dataset also. The decision tree is a prominent classification technique of data mining that helps to build the decision forest, and it generates the set of logic rules from the set of non-class attributes based on the gain ratio. This can be fruitful for seizure detection. Trends of data mining classifier in the analysis of EEG seizure detection and prediction is rapidly applicable.
978-1-5090-2597-8/16/$31.00 ©2016 IEEE
Since last few years, application of data mining is widely seen for analysis of brain dataset in seizure detection. The study reveals 65 features of the EEG data set of epileptic patients which were extracted from four different tranformation techniques (Time Domain, DWT, CWT, and FT). It had been evaluated on different measure criteria; area under curve, sensitivity, specificity and relative computational complexity. This is found that feature line length and relative power is good for online seizure detection [I]. The study was done on eleven features extracted from the time and frequency domain based on the classification done using random forest classifier on IEEG (Intracranial EEG) data set for seizure detection [2]. The seizure detection on EEG data set of all sections of the brain it had been classified in two classes; seizure and non-seizure [3]. The analysis is based on four states of seizure; ictal, pre-ictal, inter-ictal, and post-ictal using a hybrid approach of LDA, KNN , CVE, and SVM classifier. It is noted that seizure early prediction is 65 seconds [4]. Machine learning technique is applied on CHB-MIT database for the seizure detection [12]. Data is examined on more than 875 of IEEG recordings collected from 10 patients, the accuracy came out to be 97% [14]. The time domain features extracted from EEG data signals dataset, classify the epileptic patient between seizure and non-seizure, to detect the seizure and the accuracy of detecting seizure is calculated as 97.75% [15]. The review article gives the background knowledge of epilepsy, epileptic seizure detection with various statistical and computational techniques including data mining [19]. For prior detection of seizure the authors designed the learning based
3579
algorithm for specific patients, the accuracy of the algorithm for seizure detection was 97% [20]. In this approach decision tree classifier is used for seizure detection with the help of See5 and explores the logic rules for the EEG Signals [21], but they are far away from decision forest approach. Every data mining classifier including Support Vector Machine, Decision tree, etc. are more or less good. In the present work, we used decision forest a classification based classifier. The Systematic forest called as 'SysFor' is used which differs from Random forest used by [2]. Random Forest is based on Random Subspace algorithm on the bootstrap samples of the training dataset. These bootstrap samples are created by random selection of same number of records from the primary training dataset, a single record from dataset can be chosen repeatedly in a bootstrap sample [24]. We used the Systematic forest (SysFor) which is a type of decision forest, it gives more sensible logic rules. In decision forest, accuracy perfonnance is the crucial factor, SysFor provides the better accuracy in comparison to other classifiers. Here, it gives 100% accurate result reported in section IV ECoG data analysis. Ill.
MATERIAL AND METHODS
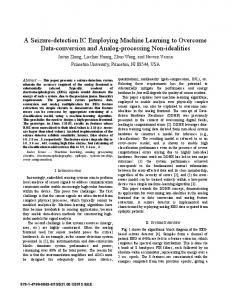
This section includes the description of collected data set and applied technique. The below-drafted Fig.1 show the step by step process of analysis; ECoG data collection, feature extraction, dataset preparation, building decision forest (SysFor) and seizure detection.
Dalasel oreoaralion
Seizure detection
'max; explains the maximum value of signal', 'mean; is the average records of signal','line length; measure the complexity of signal that is the summation of distance between two consecutive points [18]', 'skewness; is the third statistical moment of signal [3]' , 'kurtosis; it is a fourth-order statistical moment that shows whether the data is on peak or flat [3]', 'energy; measurement of ECoG signal strength [3]', 'Shannon entropy; is the measurement of the uncertainty and complexity of ECoG signal [3]' and 'standard deviation; measurement at which extent the peaks and troughs of a wave vary on average fTom the mean [23]'. C.
Dataset Preparation
From the extracted dataset there are 16 files, 8 files are for ictal and 8 for pre-ictal. In each file, 9 statistical features are calculated for 10 sec time duration with the sample size of 400Hz. All 8 files of ictal and 8 for pre-ictal are merged, consisting of 16 records and 685 attributes including class attribute with two class values (ictal and preictal). The attributes are prepared as Nr*Ec + C, where 'NF' is the number of features, 'Ec' is the number of Electrodes and 'c' is the class attribute.
D. Building Decision Forest (SysFor) A decision forest is a group of the decision trees, each tree act as a classifier. Decision forest is built by our approach Systematic forest (SysFor), it is a rule based classifier of data mining which is used to build forest [7]. In decision tree class attribute is required as the target attribute in the dataset. In present analysis, the class attribute has two distinct values which represents the phase of seizure i.e. ictal and pre-ictal. The reason of selecting the Systematic Forest (SysFor) is because it generates more sensible logic rules with higher rate of accuracy as compared to single decision tree [7].
E. Seizure Detection Fig. 1. The process of seizure detection.
A.
Dataset Collection
Dataset collection is one of the important tasks for data mining analysis. In the present investigation, the data is time series in nature, which is the recording of brain ECoG signals. It has total 16 sixteen files of a patient, 8 separate files are ictal and 8 pre-ictal. In each case, 76 electrodes are used which are denoted as ECI, EC2, ...EC76 for data collection from the brain signal. The sample size is 400Hz and the time span is 10 second. The dataset is freely available on the website [6, 13]. The applied dataset had been prominently used to onset seizure detection, intervention and find the difference between ictal and pre-ictal [13].
IV. ECoG DATA ANALYSIS
B. Feature Extraction Extraction of a feature from raw ECoG data is the decisive step. It has been extracted from various domain types of transfonnations including frequency base, time base, DWT, CWT etc. [I]. In the present analysis, we used time domain technique presented in Table I to extract the'nine' features that are mentioned as'min; explains the minimum value of signal',
3580
2016 IEEE Region 10
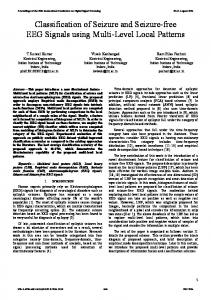
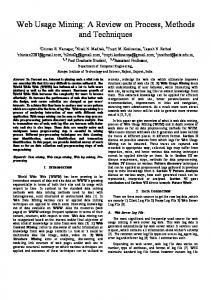
Detecting the seizure and its state from the signal dataset is a riddle. For the detection, we built the decision forest from our home made technique (SysFor) as discussed in section III of (D). It is the knowledge discovery in which the patterns came out from the set of logic rules of 10 trees of the decision forest. As shown in fig. 2, fig. 3 and fig. 5 we detect 3 out of 10 trees which are built on these features (EC1_min, EC9_min, and ECII_min). The ictal (seizure) are shown in leaves, if the value of the root node of trees is less than the chosen value of root attributes. The remaining of 7 trees in fig. 4, fig. 6, fig. 7, fig. 8, fig. 9, fig. 10, and fig. II are build on root attributes (ECI0_max, EC1_max, EC9_max, EC19_max, EC2_ max, ECII_max, and ECI2_max) shows seizure in leaves if the value is greater than the selected value of root attributes. The computed accuracy is 100%.
For the detection of seizure ECoG high dimensional data set [6,13] has been taken. The time series data recording is done by 76 electrodes named as ECI, ...EC76 each electrode is associated with 9 time domain features, e.g. for electrodel; ECl_mean, ECI_min, ECI max, ECl skewness, ECI_energy, ECl_stddev, ECl_kurtosis, ECI_shannonEntropy, ECI_linelength. For the detection of a
Conference (TENCON) - Proceedings of the International Conference
seizure, we used classification techniques on our pre-processed dataset having 685 attributes and the size of the record is 16 used to build multiple decision trees using our technique SysFor [7] to extract the knowledge for seizure detection. The analysis made on drawn decision trees obtained from the set of logic rules through a decision tree and the group of these decision trees generate the decision forest. A decision tree consisted of nodes and leaves, having different levels, root node called as 'level 0' and it is incremented by I (leaves) as shown in Fig. 2 to Fig. 11. The root node of the tree is chosen such that it has the highest'gain ratio'. The below table I explains the extracted time domain features [I, 15, 16] from ECoG signal dataset [6]. Here x(n) is the input ECoG signal and'n' is the record of input signal in time, total number of records of 10 sec data set is denoted as 'N'. TABLE l.
Fig4: Decision Tree 3
Fig5: Decision Tree 4
FEATURES DEFINITION FOR ECoG DATA
Fig6: Decision Tree 5
Time domain features Min
=min(x(n)); minimum value of the data.
Max
=max(x(n)); maximum value of the data.
Mean
=1/N I�=lx(n); where 'n' is the record and 'N' total
Entropy
=p(x). I�=1Iog (P(X)); where p(x) is the calculated 2
Line length Std dev Kurtosis Skewness
Energy
number of records.
probability of x(n).
=I�= Ix(n - 1) - x(n)l; summation of the distance 2 between consecutive records.