Data Mining for Floral Distribution Pattern Detection S. Pivetti1, M. Giacomini1, G. Casazza2, and L. Minuto2 1
Department of Communication Computer and System Science, University of Genova, Genova, Italy 2 Department of Studies on the Territory and its Resources, University of Genova, Genova, Italy
Abstract—Nature conservation can be considered a social movement that proposes itself to develop or reaffirm in the society some values concerning the relationship between man and nature [1]. Conservation biology is driven by the same motivations but is distinguished from the nature conservation movement; it is a scientific discipline the aim of which is to supply a knowledge support for the decisions in the field of the biodiversity conservation management. In fact, one of the fundamental aspects in approaching the safeguarding plans is to identify the characteristics for which an area has to be object of a conservation program [2]. Nowadays biogeography stands out as a discipline of central importance for the conservation planning. They use the term ‘conservation biogeography’ to indicate the application of biogeography principles, theories and analyses on taxa distribution to biodiversity defense problems. Present work concerns the development of a knowledge based system for the endemic species distribution pattern identification. Keywords—Indicator Species Analysis, nature conservation, data mining, endemic taxa, Maritime Alps, conservation biogeography, web based user interface.
I. INTRODUCTION In biogeography, the term ‘endemism’ indicates the phenomenon for which some animal or vegetal species are exclusive of a certain territory and an ‘area of endemism’ is qualitatively defined as a zone where some species are endemic. Although the detection of the areas of endemism is assumed interesting to recognize those geographic areas whose protection has the right of priority, since the subjectivity of the definition, their determination is problematic. The developed decision support system supplies methods to locate the areas of endemism in order to understand the influence of ecological and historical (climatic and geological events) factors on the distribution pattern and to identify priority areas for future conservation projects. The definition of areas of endemism and related species has been carried out by MATLAB programming. The data mining analyses have been performed on the endemic taxa presence/absence matrix in order to identify any areas of endemism with the hierarchical cluster analysis [3]. The relevance of endemic species for an area of endemism was performed with Indicator Species Analysis method
[4]. Its use applied to biogeography studies has been tested in order to identify the species characterizing each area of endemism, assigning to each taxon the corresponding weighted endemism value. In this work, an Indicator Value calculation procedure has been developed to try to overcome the problems associated to those already present in literature. In facts, the problem of find objective methods to identify endemic richness patterns reflects the difficulty of searching the optimum threshold in clustering operations. The methods proposed by literature [5] find the endemic areas assigning a priori a threshold value in correspondence of which is to cut the hierarchical tree obtained by the dataset distance matrix; then, they apply an Indicator Species Analysis to the results obtained by the previous cluster analysis. On the contrary, the procedure that we decide to adopt for this work is to calculate the optimal endemic areas number in function of the Indicator Value Analysis outcomes. In particular, an iterative process has been implemented to avoid the a priori assignment of a dissimilarity value in the clustering operation. Our method links the hierarchical clustering procedure with the Indicator Values calculation, defining an optimum number of endemic areas maximizing the species indicator values. The functioning of database and data mining has been tested on the Maritime and Ligurian Alps, using information present in literature and in particular those available in a recent biogeography study on this area [6]. A web interface was developed to allow the consultation, modification and updating of the above-mentioned database.
II. METHODS The Indicator Value Analysis is a statistical analysis known in biogeography that looks for the species characterizing the areas of endemism. Indicator species are defined as the species mainly found in a single area of endemism and present in the major part of the subzones constituting the area. The Indicator Value Analysis, and in particular Dufrène and Legendre method, introduce an index that combines specificity and fidelity method to quantify Indicator Species significance.
O. Dössel and W.C. Schlegel (Eds.): WC 2009, IFMBE Proceedings 25/V, pp. 230–233, 2009. www.springerlink.com
Data Mining for Floral Distribution Pattern Detection
231
III. RESULTS
IndVali = maxൣIndValij ൧ = N sites
maxൣAij ȉ Bij ȉ 100൧ = max ቈ N
ij
sites i
ȉ
N sites
ij
N sites
j
ȉ 100
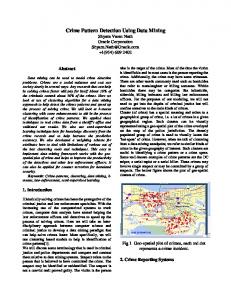
The functioning of our iterative approach in the threshold calculation has been tested using as study area is the Maritime and Ligurian Alps hotspot, this is considered as a major biodiversity area of the Mediterranean Basin. The taxa were scored as present or absent in each 10 × 10 km cell. The 175 cells containing at least one species were used as OGU for the statistical analyses. For each OGU the number of endemic taxa present was counted.
Our work has included, in the first phase, a hierarchical cluster analysis computing the distance between objects in the data matrix using as method the dissimilarity derived from the Jaccard coefficient and the unweighted average distance (UPGMA) metric to create a hierarchical cluster tree from the distances.
Fig. 3 Similitude dendrogram between OGU based on Jaccard coefficient
Fig. 1 The study area of Maritime and Ligurian Alps
Fig. 4 Optimal threshold search
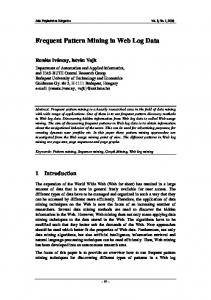
Fig. 2 Arbitrary OGU (Operational Geographic Unit) subdivision
A posteriori, we verified what already stated in our reference literature; that is, the most significant biogeography outcomes are obtained by the above mentioned combination of similarity coefficient and agglomerative algorithm. In Fig. 3 the resultant hierarchical cluster tree dendrogram is shown. The second stage of the data mining process we developed constitutes in searching the best cluster number; this is
IFMBE Proceedings Vol. 25
232
S. Pivetti et al.
chosen as the one capable of maximize the Indicator Values mean value (Fig. 4). Then, applying the Indicator Species Analysis, we obtained an Indicator Value for each taxon. In Fig. 6 a graphical representation of this analysis outcome is presented. The 100 value means that the correspondent species are to be found only in the geographic units that compose the cluster and in each single cell of the cluster itself.
Fig. 5 Biogeography analysis of the Maritime and Ligurian Alps hotspot Endemic Species Indicator Values 100
90
80
70
Indicator Values
60
50
40
30
20
10
0
0
1
2
3
4
5
6
7
8
9
10 11 12 13 14 15 16 17 18 19 20 21 22 23 24 25 26 27 28 29 30 31 32 33 34 35 36 37 38 39 40
Endemic Species
Table 1 Biogeography analysis of the Maritime and Ligurian Alps hotspot Indicator Value
Genligu Hesinod Phycord Senpers Vioarge Limcord Leudisc Hellunu Micmarg Prialli Phyvill Saxcoch Silcord Caraemi Potvald Galreut Camisop Camsaba Lilpomp Leuburn Cenjord Camfrit Cenaemi Moesedo Potsaxi Moelebr Cenaplo Cytardo Viovald Saxflor Balfrut Leunica Scamoll Cerutri Leusubg
28,588 38,571 99,787 45,488 92,126 48,177 62,28 29,795 21,229 92,754 79,84 92,047 98,722 49,455 50,962 58,382 11,111 17,677 29,141 27,451 33,333 83,333 50,000 33,159 22,222 33,333 21,587 33,333 46,588 56,000 33,142 100,00 57,695 100,00 40,000
Endemic Area
1 1 1 1 1 2 2 3 3 3 3 5 5 6 6 8 9 9 10 10 11 11 13 5 19 5 19 5 18 18 5 17 4 14 4
Fig. 6 Indicator Species Analysis outcome Computing the threshold parameters as described before, the cluster analysis detects 19 clusters, as shown in Fig. 3a. These areas can be considered as areas of endemism within the Maritime and Ligurian Alps hotspot. For examples the Argetera massif, the Finalese, the Voltri group, the coast between Ventimiglia and Nice, the coast between Nice and Cannes are separated. Each area is characterized by a certain group of endemic species, as exposed in Tab. 1.
This data mining study has been accompanied by the development of A Web interfaced database for biogeographical and ecological analyses.
IV. DISCUSSION With the development of European community policies the need for sharing knowledge and data is today an
IFMBE Proceedings Vol. 25
Data Mining for Floral Distribution Pattern Detection
233
important priority for the elaboration of common environmental management strategies. The purpose of this project is to create a database for a geo-referenced collection of flora recordings. Such recordings form the basis for a decision support system which settles in an objective way the importance of the relationships between a particular area and a taxon or a group of taxa. The conceptual model of the database contains both information on the different plants, such as taxonomical and ecological features (habitat, altitudinal belt, soil and moisture requirement, etc.), and data about the territory where they live or not, such as the environmental features of each OGU (bioclimate, glacial events, lithological composition). An interface with Web architecture was developed in order to permit the consultation, modification and update of the database also in long distance collaboration among institutions. The program let also to analyze the database in order to identify any areas of endemism and to supply information about the species and their biogeographical and ecological relationships. In conclusion, the present work proposes a method to get a quantitative estimate for the endemic relevance of a species in a certain area of endemism. Beyond permitting to obtain similitude dendrogram between OGU based on different similarity coefficients and agglomeration algorithms, the system determines, using Indicator Species Analysis, the species characterizing a certain endemic area. Potential applications include conservation strategies development,
i.e. to identify priority areas for future conservation projects.
REFERENCES 1. 2. 3. 4. 5. 6.
Whittaker, R.J., Araújo, M.B., Jepson, P., Ladle, R.J., Watson, J.E.M., Willis, K.J. (2005) Conservation biogeography: assessment and prospect. Diversity and Distribution, 11: 3–23. Margules C.R., Pressey R.L. (2000) Systematic conservation planning. Nature, 405: 243–253. Moleine, P.M. & Linder, H.P., 2006 - Input data, analytical methods and biogeography of Elegia (Restionaceae). Journal of Biogeography, 33: 47-62. Dufrene M., Legendre P. (1997) Species assemblages and indicator species: the need for a flexible asymmetrical approach. Ecological Monographs, 67: 363 Giacomini M., Bisio A., Minuto L., Profumo P., Ruggiero C. (1999) Strutturazione della conoscenza per un database di etnobotanica ligure. Informatore Botanico Italiano, 31: 156-160 Casazza G., Zappa E., Mariotti M.G., Médail F., Minuto L. (2008) Ecological and historical factors affecting distribution pattern and richness of endemic plant species: the case of the Maritime and Ligurian Alps hotspot. Diversity and Distribution, 14: 47–58
Corresponding Author: Institute: Street: City: Country: Email:
IFMBE Proceedings Vol. 25
Mauro Giacomini DIST – University of Genova Via All’Opera Pia 13 16145 Genova Italy
[email protected]