Volume 151 â No.8, October 2016. 34. Data Mining Techniques for Diagnostic Support of. Glaucoma using Stratus OCT and Perimetric Data. Kinjan Chauhan.
International Journal of Computer Applications (0975 – 8887) Volume 151 – No.8, October 2016
Data Mining Techniques for Diagnostic Support of Glaucoma using Stratus OCT and Perimetric Data Kinjan Chauhan
Prashant Chauhan, PhD
Anand Sudhalkar, PhD
Shree Ramkrishna Institute of Computer Education and Applied Sciences, Surat, Gujarat, India
MS (Ophthal), Arvind Eye Hospital, Surat,Gujarat, India.
MS (Ophthal), Sudhalkar Eye Hospital, Vadodara,Gujarat, India.
Kalpesh Lad, PhD Shrimad Rajchandra Institute of Management & Computer Application, Maliba Campus, Uka Tarsadia University, Bardoli, Gujarat, India
ABSTRACT People suffer from so many diseases in today’s era. It has become imperative to find either solutions to these diseases or detect them during early stages so that they can be prevented or cured. Glaucoma is one of the eye disorders and is one of the leading causes of blindness. It is a disease that gradually degenerates the eye vessels causing vision loss in the patient. This paper discusses the data mining techniques like Decision Tree, Linear Regression and Support Vector Machine that have been used for diagnosis of glaucoma in the retinal image. Parameters obtained from Perimetry and Stratus Optic Coherence Test (OCT) have been fed to each technique to find out their performance in terms of accuracy, sensitivity and specificity. The researcher have compared results obtained from the Decision Tree, Linear Regression and Support Vector Machine (SVM) and found that Decision Tree and Linear Regression Model performs much better than SVM for diagnosis of Glaucoma giving accuracy of 99.17%, 92.56% and 70.25% respectively. The specificity of Linear Regression and SVM is 97.56% and 96.34% respectively.
Keywords Glaucoma, Cup to Disc Ratio(CDR), Data Mining, Decision Tree , SVM and Linear Regression.
1. INTRODUCTION Glaucoma is an eye disorder which causes increase in Intra Ocular Pressure (IOP). Increase in IOP damages optic nerve that transmits images to the brain. If not detected in the early stages, glaucoma leads to vision loss in the patient. It may also cause permanent vision loss within few years. After cataracts, Glaucoma is considered to be the second most reason for causing sudden vision loss in the patients, thus its detection and diagnosis becomes essential furing the early stage to prevent further loss in vision. In India, according to the Glaucoma society 12.8% of people suffer blindnees due to glaucoma.In most cases glaucoma goes undiagnoised in our country .It is estimated that glaucoma affects 12 million people and by 2020, expected number may increase to 16 million. It is evaluated statistically that one in every eight person who is above the age of 40 is either suffering from glaucoma or is at risk of the disease [33]. The reason why a person may suffer from glaucoma is because of the deterioration of optic nerve fibers and astrocytes and high IOP. The the thickness of Retinal Nerve Fibre Layer (RNFL) goes on gradually decreasing due to detoriation in
Ravi Gulati, PhD Department of Computer Science, Veer Narmad South Gujarat University,Surat, Gujarat, India.
optic nerve fibre.Also,this deteriotion changes Optic Nerve Head (ONH) and thereby decreasing the functional capability of retina. The degeneration of astrocytes and axons leads to the increase in the width of the cup which leads to the thinning of the neuroretinal rim. [27]. Diagnosis of glaucoma is dependent on various findings such as IOP (if IOP > 21 mm Hg [32], it is considered as a suspicious case for glaucoma), optical nerve cupping and visual field loss. Detection and diagnosis of Glaucoma is performed through various tests such as Tonometry, Ophthalmoscopy, Perimetry, OCT, Gionoscopy and Pachymetry[34]. The organization of this paper is as follows: section II gives the detail on data acquisition ,section III describes the Research Background, section IV provides data mining techniques applied for glaucoma diagnosis. Finally section V discusses our result and section VI presents our discussion.
2. DATA ACQUISITION Perimetry and OCT data for the patients have been obtained from Sudhalkar Eye hospital, Vadodara, Gujarat. All the patients are in age group of 20 to 60 years. Total 194 retinal data set of Perimetry and OCT reports of the patient have been used in this work for training and testing purpose. The data set has been approved for research work by the ethic committee consisting of senior doctors.
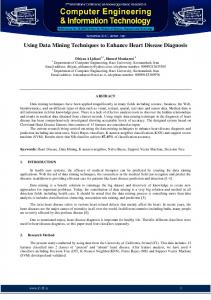
3. RESEARCH BACKGROUND IOP and CDR are the parameters that are considered for suspicious case of glaucoma. IOP is not considered to be an accurate factor for glaucoma diagnosis as elevation in the pressure could be due to number of reasons like access production of aqueous fluid in eye,certain medications ,injury in eye,etc.. Glaucoma is currently diagnosed by considering CDR. CDR is calculated as shown below: CDR = area of optic cup / area of the optic disc
(1)
Optic Disc
Optic Cup Fig 1 a) Normal Eye b) Glaucomatous Eye
34
International Journal of Computer Applications (0975 – 8887) Volume 151 – No.8, October 2016 As shown in the above figure, fig 1 b)the optic cup progresses as the cup becomes larger in comparison to the optic cup as shown in the fig 1 a) and Optic disc keeps on thinning gradually as Optic cup enlarges.Generally if CDR is greater than 0.3 then it is considered to be a positive case of glaucoma [1]. Kinjan Chauhan et al, have developed an algorithm (CDR_ALGO) for measuring CDR. They have used OTSU histogram and morphological operations to segment disc and cup from the retinal images. They have achieved 94% accuracy in diagnosis of Glaucoma using CDR [6]. S. Chandrika et al, have used CDR for detection of glaucoma using k- means clustering and Fuzzy c-means clustering technique. In their research paper, if CDR exceeds 0.6 value the patient is diagnosed for glaucoma and is referred to ophthalmologists for further tests [3]. Zhuo Zhang et al, proposed a convex hull based ellipse optimization algorithm which efficiently detects neuro-retinal optical cup. There algorithm have given better CDR calculation result compare to ARGALI system, thus accurately diagnosing the glaucoma. The evaluation has been carried out on a large scale involving 15 thousand patients from Australia and Singapore [12]. Jyotika Pruthi et al, have used CDR for segmenting cup and disc from retinal images. Diagnosis of Glaucoma have been carried out using SVM, ANFIS and Back propagation Neural Network . They have obtained accuracy for SVM, ANFIS and Neural Network as 98.12%, 97.77%, and 97.35% respectively [9]. Muthu Rama Krishnan Mookiah et al, have used SVM linear, polynomial order 1, 2, 3 and Radial Basis Function (RBF) kernels for diagnosis of Glaucoma .Higher Order Spectra (HOS) and Discrete Wavelet Transform (DWT) features have been used for segmentation of disc and cup. They have developed Glaucoma Risk Index (GRI) to diagnose Glaucoma and normal eyes. They have achieved an accuracy of 95%, sensitivity and specificity of 93.33% and 96.67% respectively [22]. Geetha Ramani et al, have proposed image analysis and data mining techniques to classify the retinal images as normal, diabetic retinopathy or glaucoma affected [11]. Syed SR. Abidi have proposed a framework combining image processing and data mining techniques for diagnosis of glaucoma. Their framework analyzes optic nerve images for both diagnosis and monitoring of glaucoma [24]. Bowd et al, have used retinal tomography images and have used forward and backward feature selection methods for training Multi Layer Perceptron (MLP), SVM and linear discriminant functions for diagnosis of glaucoma [7]. Park et al, have used SVM classifiers for selecting features from optic disc usind correlation analysis and forward wrapper model [10]. Swindale et al, have used a wrapper model for feature selection in order to train SVM classifiers [8].
4. METHODOLOGY In this section the researcher have discussed the data mining techniques, viz. Decision Tree, Support Vector Machine (SVM) and Linear Regression that have been applied for diagnosis of glaucoma.
4.1 Data Mining Technique In recent years, application of classifier to support medical diagnosis have increased tremendously. Data mining process is an interactive and iterative process. Mining problems can be classified into three categories: identifying classifications, finding sequential patterns, and discovering associations.Data mining is a powerful knowledge discovery technique,but there are constraints such as it is dependent on application, various applications require different mining techniques, and data must be of a certain size and format. In medical branch, data mininig techniques such as rule-based learning systems, neural networks, Decision Trees, Bayesian networks, logistic regression etc., have been used with great success . Machine learning classifiers such as Linear Discriminate Analysis (LDA), SVM and recursive partitioning and regression tree (RPART) have been used comprehensively for diagnosis of glaucoma. Trained classifiers can be used to predict the diagnosis of new cases. The researcher have used Decision Trees, Linear Regression and SVM (LibSVM with linear kernel) for diagnosis of glaucoma. Decision Tree learning uses a predictive model which maps observations about an item to conclusions for the item's target value. It is one of the predictive modeling approaches used in statistics, data mining and machine learning. A Decision Tree is a tree-like graph or model. It is more like an inverted tree because it has its root at the top and it grows downwards. In decision tree, classification model is created to predicts the value of a target attribute often called as label value in rapid miner , based on several input attributes of the dataset. Decision Tree is split using attributes like information gain, gain ratio, gini_index and accuracy. Information gain is biased towards selecting large values, whereas gain ratio adjusts the information for each attribute to obtain the uniformity of the attribute values. So gain ratio has been used for splitting and the value is set to 0.1. In order to reduce the size of tree, minimal gain has to be increased. The depth of a tree varies depending upon size and nature of the data set. This parameter is used to restrict the size of the Decision Tree. Thus the depth of the tree is set to 20, which is a default value in rapid miner. Support Vector Machines (SVM) are a new class of learning algorithms that are able to solve a variety of classification and regression (model fitting) problems. SVM is a powerful method for both classification and regression. It exploits statistical learning theory to minimize the generalization error when training a classifier. SVM has inbuilt kernels linear, polynomial, radial basis function(rbf). SVM have generalized well in face recognition, 26 text categorizations, recognition of handwritten digits and breast cancer diagnosis and prognosis The linear kernel is genrally used to classify linear seperable data.In medical diagnosis, where there are large number of attributes and data set is less , linear kernel performs better compared to rbf. Regression is a technique used for numerical prediction. It is a statistical measure that attempts to determine the strength of the relationship between one dependent variable (i.e. the label attribute) and a series of other changing variables known as independent variables (regular attributes). Just like Classification is used for predicting categorical labels, Regression is used for predicting a continuous value. Linear regression attempts to model the relationship between a scalar variable and one or more explanatory variables by fitting a linear equation to observed data.
35
International Journal of Computer Applications (0975 – 8887) Volume 151 – No.8, October 2016
4.2 Pre-processing of Dataset The field of data mining addresses the question of how best to use this data to discover new knowledge and improve the process of decision making. Pre-processing of the data is a very important stage in any data mining process. Pre-processing of raw data consists of data cleaning, data integration, data transformation and data reduction. Data cleaning consists of removal of noisy data, identify outliers and correct data inconsistency. To address this issue the researcher have used missing value operator and discretization using frequency. Discretization are of two types supervised and unsupervised. In unsupervised discretization class variables are not used, whereas, in supervised discretization it uses the values of the class variables. Missing values are filled by predicting value as dependent class variable. Discretization using frequency has been used in our process, for removal of noisy data in Decision Tree and have used fill in missing values for SVM and Linear Regression.
PER_OD_I
Perimetry Right Eye Inferior value
Numeric ,Range (0to 4)
PER_OD_S
Perimetry Right Eye Superior value
Numeric ,Range (0to 4)
OCT_OS_S
OCT Left Eye Superior value
Numeric ,Range (0to 4)
OCT_OS_I
OCT Left Eye Inferior value
Numeric ,Range (0to 4)
OCT_OD_I
OCT Right Eye Inferior value
Numeric ,Range (0to 4)
OCT_OD_S
OCT Right Eye Superior value
Numeric ,Range (0to 4)
The dataset consists of parameters-CDR_CAL (CDR calculated by the algorithm (CDR_ALGO) proposed by Kinjan et al, [6]), CDR_OCT (CDR obtained from OCT test), PER_OD_I, PER_OD_S, PER_OS_I, PER_OS_S (Perimetric data from superior, inferior region of right and left retinal image obtained from the perimetry test performed on the patients), OCT_OD_I, OCT_OD_S, OCT_OS_I, OCT_OS_S (OCT data from superior, inferior region of right and left retinal images obtained from the OCT test performed on the patients) as explained in table 1.
In this study, 11 parameters have been extracted from Perimetry and OCT tests conducted on the patients as well as calculated CDR from the algorithm developed by the authors [6] through image processing of the retinal images as described in table 1. Total 194 retinal data set were considered for diagnosis of glaucoma .
The models developed for Decision tree. Linear Regression and SVM have been validated using X-validation operator of Rapid miner , which is used 10 fold cross validationa and sampling has been set to stratified sampling. The 10-fold cross validation will divide the data set into 10 subsets of equal size leaving one example set as test data. This process is repeated until all the subsets are used once as a test data set. Stratified sampling is used as it ensures that subsets are created randomly and class distribution is same as data set inputted. X-validation operator is a nested validation operator, thus trained data set is than pass on to the testing data set where model is applied on test data using Apply Model operator and Performance of the model can be calculated using Performance operator. The performance operator measures accuracy of a model and creates confusion matrix. As medical data have more attributes compared to size of data set , which leads to overfitting in the classifier. To address this issue, researcher have applied scaling by using normalize operator available in rapid miner tool. Table 1 shows the description of the parameters used for diagnosis of Glaucomatous and Normal eyes. Table 1 Parameter Description Parameters
Description
Data Type
CDR_CAL
CDR calculated from algorithm(CDR_ALGO)
Numeric ,Range (0.0 to 0.8)
CDR obtained from OCT
Numeric ,Range (0.0 to 0.8)
CDR_OCT
PER_OS_S
Perimetry Left Eye Superior value
Numeric ,Range (0to 4)
PER_OS_I
Perimetry Left Eye Inferior value
Numeric ,Range (0to 4)
5. RESULTS
Rapid Miner tool version 6.5.2 has been used for model development for Diagnosis of Glaucoma Progression Tool (DGP) as proposed by the authors [1]. The results obtained from Decision Tree, SVM (linear kernel) and Linear Regression are discussed in this section. The results are measured in terms of Accuracy, Precision, Specificity and Sensitivity. The confusion matrix obtained from all the three techniques using rapid miner tool, has also been discussed . A Confusion matrix shows evaluation of correctly predicted and incorrectly predicted data made by classification model as compared to the actual data. Performance of the model constructed using classifier is measured using confusion matrix. Table 2 shows the model of confusion matrix. Table 2 Explanation of Confusion Matrix Target Confusion Matrix Positive
Negative
Positive
a
b
Negative
b
d
Model
As shown in the table, confusion matrix is calculated in terms of True Positive, True Negative values (a and d respectively), False Positive and False Negative (c and d respectively). The term Accuracy, Precision, Recall or Sensitivity, Specificity, True Positive and True Negative are defined as
Accuracy: It is the total number of predictions that correctly diagnoised glaucoma.
Sensitivity: It is the number of actual positive cases which are correctly diagnoised.
Specificity: It is the number of actual negative cases which are correctly diagnoised Thus, Accuracy, Sensitivity and Specificity are measured as per the given formuale : Accuracy = a+d/(a+b+c+d)
(1)
36
International Journal of Computer Applications (0975 – 8887) Volume 151 – No.8, October 2016 Sensitivity =a/(a+d)
(2)
Specificity =d/(d+c)
(3)
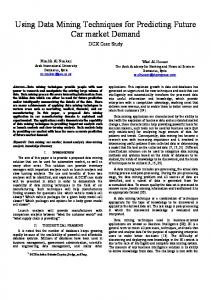
Performance of Decision tree,SVM and Linear Regression P e r c e n t a g e
The results obtained in our study for Decision Tree , SVM, Linear Regression are shown as below .The table 3, 4, 5 shows the confusion matrix for Decision Tree, SVM and Linear Regression respectively. Table 3 Confusion Matrix for Decision Tree with Accuracy 99.17% true positive true negative pred. positive
81
0
pred. negative
1
39
79
33
pred. negative
3
6
80 60
99.17 98.78 98 97.596.37 92.63 92.5 89.17 84.42 84.17 75.67 74.17
40
0
Figure 2 Performance comparison of decision tree, Linear regression, SVM Comparative Study -of various data mining techniques used in this study has also been carried out. The following table 7 shows the summary of the various techniques studied. Table 7 Comparative Analysis of Data Mining for Glaucoma Diagnosis by other researchers Sr No
1.
true negative
pred. positive
73
10
pred. negative
9
29
Authors
Features
Nagaraj et al
Multifocal visual evoked potential
Bizios et al
The following table 6 shows Comparative Experimental results for the data mining techniques applied:
Linear Regression Model SVM –(LibSVM)Kernel -linear
Classifier
Accurac y (%)
Sensitivit y(%)
Specificity (%)
99.17
98.78
97.5
84.42
74.17
89.17
92.63
84.17
96.37
Figure 1, gives a comparative graph of the performance of decision tree, Linear Regression and SVM (linear kernel) used in this research for diagnosis of the glaucoma. From the result it can be said that decision tree have given higher performance in terms of accuracy, sensitivity and specificity as compared to others.
Optic nerve head parameters
158
ANN
3.
4.
Balasub ramania n et al
Optic nerve head parameter
5.
Huang et al
Retinal nerve fibre thickness
165
Higher order spectra and GLCM
60
6.
Sensitivity -93% Specificity -94%
135
Nayak et al
Acharya et al
Specificity -94% Accuracy94%
Optic Disc parameters Blood vessel Parameters
Performan ce Measure Sensitivity -95%
Cluster Algorithm
Table 6 Comparative Experimental Results for Data Mining Techniques Applied
Decision Tree
Sample Size
ANN 2.
Data Mining Method
SVM(linear kernel)
20
Table 5 Confusion Matrix for Linear Regression with Accuracy 84.42% true positive
Linear Regression Model
Performance
true negative
pred. positive
Decision Tree
100
Accuracy Precision Sensitivity Specificity (%) (%) (%) (%)
Table 4 Confusion Matrix for SVM (Linear Kernel) with Accuracy 92.63% true positive
120
Sensitivity -95% Specificity -82% Sensitivity -100%
61
ANN
36 (progre ssive Glauco matic eye)
Proper orthogonal decomposit ion
Area under ROC-0.94
LDA
Area under ROC-0.95
ANN
Area under ROC-0.97
Randomforest
Accuracy91%
Specificity -80%
37
International Journal of Computer Applications (0975 – 8887) Volume 151 – No.8, October 2016
7.
Muthu Rama Krishna n Mookia h et al
Accuracy95% HOS & DWT features
60
SVM
Sensitivity -93.33% Specificity -96.67% Accuracy – 99.17%
Decision Tree
Sensitivity -98.78% Specificity – 97.5%
8.
Propose d DGP Model
CDR, Optic Disc Parameter s obtained from Perimetry and Stratus OCT
Accuracy84.42% 120
Linear Regression
Sensitivity -74.17% Specificity – 89.17%
SVM (linear kernel, LibSVM)
Accuracy92.63 % Sensitivity -84.17% Specificity – 96.37%
6. CONCLUSION The early detection of glaucoma can save the vision. In this paper, the researcher have presented performance analysis of various data mining techniques to diagnoise glaucoma using perimetric and OCT data. Diagnosis of Glaucoma has been carried out using Decision Tree, Linear Regression and SVM classifier All the data mining techniques were able to detect the glaucoma and normal classes with an accuracy of 99.17%, 84.42% and 92.63% respectively. Comparative study of all the three techniques shows that Decision Tree and SVM model have given better accuracy and precision as well as sensitivity and specificity as compared to SVM. The models can be further improved by using better features and more robust data mining techniques. This diagnostic tool will help aide the ophthalmologists in making better and faster decision while diagnosing glaucoma.
7. REFERENCES [1] Chauhan K., Chauhan P., Gulati R., "Diagnosis system using data mining approach for Glaucoma (a social threat),": Technology and Society in Asia (T&SA), 2012 IEEE Conference on, 27-29 Oct. 2012. doi: 10.1109/TSAsia.2012.6397985 UR. pp.1,4. [2] Juan Xu et al, J. 3D optical coherence tomography super pixel with machine classifier analysis for glaucoma detection Boston, MA: IEEE, 2011. 2011 Annual International Conference of the IEEE Engineering in Medicine and Biology Society. pp. 3395-3398. ISSN 1094-687X, E-ISBN: 978-1-4244-4122-8 Print ISBN:9781-4244-4121-1. [3] K. Nirmala, S. Chandrika, Comparative Analyis of CDR Detection for Glaucoma Diagnosis, The International Journal of Computer Science &Applications (TIJCSA), ISSN–2278-1080, Vol 2, No. 04, pp. 1-9, June 2013.
[4] Kavita Choudhary et al, Glaucoma Detection using Cross Validation Algorithm, Fourth International Conference on Advanced Computing & Communication Technologies. pp. 478–482. 2014. [5] Saksham Sood, Aparajita Shukla, Arif Arman, Poonkodi, Automated Glaucoma Detection using Structural Optical Coherence Tomography with Data Mining, International Journal of Electrical, Computing Engineering and Communication (IJECC), Vol. 1 Issue 3, pp. 12-17. 2015. [6] Kinjan Chauhan and Dr. Ravi M., Diagnosis of Glaucoma Using Cup to Disc Ratio in Stratus OCT Retinal Images. Ahmedabad: Smart Innovation, Systems and Technologies, Springer International Publishing, Proceedings of First International Conference on Information and Communication Technology for Intelligent Systems: Vol 1, pp. 507-516. 10.1007/978-3319-30933-0_51. Series ISSN 2190-3018. 2016. [7] Bowd C, Cban K, Zangwill LM, Goldbaum MH, Lee T,Sejnowski TJ. Comparing neural networks and linear discriminant functions for glaucoma detection using confocal scanning laser opthalmoscopy of the optic disc. Investigative Opthalmology & Visual Science, Vol. 43 (11), 2002. [8] Swindale NV, Stjepanovic G, Cbin A, Mikelberg F. Automated analysis of normal and glaucomatous optic nerve head topography images. Investigative Opthalmology & Visual Science, Vol. 41 (7), 2000. [9] Jyotika Pruthi, Dr.Saurabh Mukherjee , Computer Based Early Diagnosis of Glaucoma in Biomedical Data Using Image Processing and Automated Early Nerve Fiber Layer Defects Detection using Feature Extraction in RetinalColored Stereo Fundus Images. International Journal of Scientific & Engineering Research, Vol 4, Issue 4, April-2013 1822 ISSN 2229-5518 IJSER © 2013 http://www .ijser.org [10] Park J, Reed J, Zhou Q. Active feature selection in optic disc nerve data using support vector machine. IEEE World Congress on Computational Intelligence, 2002. [11] R. Geetha Ramani, et.al , Automatic Prediction of Diabetic Retinopathy and Glaucoma through Retinal Image Analysis and Data Mining Techniques, 2012 IEEE [12] Zhuo Zhanget.al ,Convex Hull Based Neuro- Retinal Optic Cup Ellipse Optimization in Glaucoma Diagnosis 31st Annual International Conference of the IEEE EMBS Minneapolis, Minnesota, USA, September 2-6, 2009. [13] Huiqi Li, Opas Chutatape,A Model- Based Approach for Automated Feature Extraction in Fundus Images Proceedings of the Ninth IEEE International Conference on Computer Vision (ICCV 2003) 2-Vol. Set 0-76951950- 4/03 ,2003 [14] Michael H. Goldbaum; Pamela A. Sample; Kwokleung Chan; Julia Williams; Te-Won Lee; Eytan Blumenthal; Christopher A. Girkin; Linda M. Zangwill; Christopher Bowd; Terrence Sejnowski; Robert N. Weinreb [2002] Comparing Machine Learning Classifiers for Diagnosing Glaucoma from Standard Automated Perimetry, Investigative Ophthalmology & Visual Science, January 2002, Vol. 43, No. 1162 Copyright © Association for Research in Vision and Ophthalmology Downloaded From:
38
International Journal of Computer Applications (0975 – 8887) Volume 151 – No.8, October 2016 http://iovs.arvojournals.org/pdfaccess.ashx?url=/data/Jour nals/IOVS/932903/ on 02/05/2016 [15] Rudiger Bock et al, “Glaucoma Risk Index Automated glaucoma detection from color fundus images” Elsevier 30 December 2009 [16] Nagarajan et al, Neural network model for early detection of glaucoma using multi-focal visual evoked potential (MVep), Investigative Ophthalmology & Visual Science 42 (2002) [17] Dimitrios Bizio et al, Integration and fusion of standard automated perimetry and optical coherence tomography data for improved automated glaucoma diagnostics BMC Ophthalmology, 11:20 http://www.biomedcentral.com/1471-2415/11/20, 2011 [18] JagadishNayak et al, Automated Diagnosis of Glaucoma Using Digital Fundus Images, Journal of Medical Systems, Vol. 33, Issue 5, pp-337-346, October 2009. [19] Madhusudhanan Balasubramanian et al, Clinical Evaluation of the Proper Orthogonal Decomposition Framework for Detecting Glaucomatous Changes in Human Subjects, Investigative Ophthalmology & Visual Science, Vol. 51, No. 1, January2010.
Mining Framework for Glaucoma Diagnostic Support retrieved from https://web.cs.dal.ca/~sraza/papers/MEDINFO07a.pdf [25] Mrs. Kinjan Chauhan, Dr. Ravi Gulati [2013], A Survey on various image processing techinques for glaucoma diagnosis. Council for Innovative Research Peer Review Research Publishing System Journal, International Journal of Management & Information Technology, Vol. 5, No. 1 ISSN 2278-5612 pp 393-396 Impact Factor: 1.103. [26] Mrs. Kinjan Chauhan, Dr. Ravi Gulati , Pre-processing of Retinal Image and Image Segmentation using OTSU Histogram International Journal of Advanced Information Science and Technology (IJAIST) ISSN: 2319:2682 Vol.29, No.29, September 2014. [27] Kleyton Arlindo Barella et al, Glaucoma Diagnostic Accuracy of Machine Learning Classifiers Using Retinal Nerve Fiber Layer and Optic Nerve Data from SD-OCT, Publishing Corporation Journal of Ophthalmology Volume 2013, Article ID 789129, 7 pages http://dx.doi.org/10.1155/2013/789129, 2013. [28] J han et al. Data Mining Concepts and Techniques. mercury.webster.edu/aleshunas/Support%20Materials/Dat a_preprocessing.pdf visited on 21.04.2015
[20] Mei-LingHuang,Hsin-YiChen,Jian-JunHuang,Glaucoma Detection using Adaptive Neuro-Fuzzy Inference System, Expert Systems with Applications Vol.32458–468,2007.
[29] Data preprocessing. CCSU. http://www.cs.ccsu.edu/~markov/ccsu_courses/datamining -3.html visited on 21.04.2015
[21] U Rajendra AcharyaI, et al, Automated Diagnosis of Glaucoma Using Texture and Higher Order Spectra Features IEEE Transaction on Information Technology in Biomedicine 15(3):449 – 455 JUNE 2011.
[30] Model Evaluation Classification http://www.saedsayad.com/model_evaluation_c.htm visited on 23.05.2016
[22] Muthu Rama Krishnan Mookiah a et.al ,Data mining technique for automated diagnosis of glaucoma using higher order spectra and wavelet energy features Knowledge-Based Systems 33 73–82, 2012. [23] Nitha Rajandran Glaucoma Detection Using Dwt Based Energy Features and Ann Classifier IOSR Journal of Computer Engineering (IOSR-JCE) e-ISSN: 2278-0661,pISSN: 2278-8727, Vol. 16, Issue 5, Ver. IV (Sep – Oct. 2014), PP 35-42 www.iosrjournals.org 2014. [24] Syed SR. Abidia, Paul H. Artesb, Sanjan Yuna, ,Jin Yua Automated Interpretation of Optic Nerve Images: A Data
IJCATM : www.ijcaonline.org
[31] DNA India, Health issues: http://www.dnaindia.com/health/report_glaucoma-silentlyblights-light-in-the-eyes_1519673 [32] High Eye Pressure and Glaucoma http://www.glaucoma.org/gleams/high-eye-pressure-andglaucoma.php [33] Glaucoma in India : http://www.glaucomaindia.com/
Facts
and
figures
[34] DIAGNOSING GLAUCOMA https://www.glaucomafoundation.org/diagnosing_and_trea ting_glaucoma.htm
39