IJCSI International Journal of Computer Science Issues, Vol. 9, Issue 3, No 3, ..... 1997 and Master of Computer Science degree from SZABIST in. 2010. He has ...
IJCSI International Journal of Computer Science Issues, Vol. 9, Issue 3, No 3, May 2012 ISSN (Online): 1694-0814 www.IJCSI.org
132
Experimental Data Mining Techniques (Using Multiple Statistical Methods) Mustafa Zaidi1, Bushra A. Saeed2, I. Amin3 and Nukman Yusoff4 1
Department of Computer Science, SZABIST Karachi, Pakistan 2
Department of Bioscience, SZABIST Karachi, Pakistan
3
Department of Computer Science, SZABIST Karachi, Pakistan
4
Department of Engineering Design & Manufacture , University of Malaya Malaysia
Abstract This paper discusses the possible solutions of non-linear multivariable by experimental Data mining techniques using orthogonal array. Taguchi method is a very useful technique to reduce the time and cost of the experiment but ignores all kind of interaction effects. The results are not much encouraging and motivate to study Laser cutting process of non-linear multivariable is modeled by one and two way analysis of variance also linear and non linear regression analysis. These techniques are used to explore better analysis techniques and improve the laser cutting quality by reducing process variations caused by controllable process parameters. The size of data set causes difficulties in modeling and simulation of the problem such as decision tree is a useful technique but it is not able to predict better results. The results of analysis of variance are encouraging. Taguchi and regression normally optimize input process parameters for single characteristics. Keywords: Laser cutting, Quality, Statistical Methods, ANOVA, Linear Regression.
1. Introduction In this study, experimental analysis has been carried out to seek the optimum combination (laser power, cutting speed, assist gas pressure and standoff distance) of input parameters in laser cutting process in order to improve the laser cutting quality by other statistical methods on polystyrene foam to improve the deficiencies in [1] Taguchi method based modeling. The observed values of edge quality, Kerf widths, percent overcut and material removal rate were observed for measuring quality. Only kerf width orthogonal array data set is used to understand the statistical techniques from [1] because numerous papers were studied in the favour of Taguchi Method of 9
runs in detail. Sharma and Yadava [2] used Taguchi Method TM-Response surface methodology design of experiment to develop second order regression model and Multi-objective optimization is calculated by TM-Grey relational analysis for the estimation of weights of both qualities average kerf taper Ta and surface roughness Ra of difficult to cut Thin aluminum alloys sheets by laser pulsed ND:Yag 200 Watts. It shows the usability of Taguchi method even by ignoring interaction effects. But this not possible for all cases which motivate to study other methods and interaction effect between the input variables. Pandey and Dubey [3] recently used large size Taguchi method of L27 with two replications. It is clear from their study that Fuzzy model produce better result of L27 runs than L9. In their view interaction plays an important role and confidence interval is better in L9 even though they used four factors three level design in fractional factorial design of experiment i.e. one third design. This work motivates us to perform this study. The paper consists of summary tables of the whole study. Orthogonal array is known for invest less time and cost in experimentation as mentioned in a number of papers [4]. The effect of input parameters on output quality variation was assessed by different methods to determine the optimum input combination. Different techniques will be applied at this stage to understand these methods and compare them for better applications, viz, One way and two way ANOVA, single variable linear, multivariable linear, nonlinear and multivariable nonlinear regression Analysis. The software used was Excel and SPSS. Four controllable input parameters with their value divided into three stages to understand the effect of input
Copyright (c) 2012 International Journal of Computer Science Issues. All Rights Reserved.
IJCSI International Journal of Computer Science Issues, Vol. 9, Issue 3, No 3, May 2012 ISSN (Online): 1694-0814 www.IJCSI.org
parameters on the output parameter [1]. The relationship between the parameters can be found by the modeling of the system by some mathematical or Statistical method. The model will be used for simulation.
2. Analysis of Variance In the beginning perform one way ANOVA to understand the significance of controllable parameters (Laser power (A), cutting speed (B), assist gas pressure(C) and standoff distance (D). This analysis is divided into two parts with and without replication. In the focused experiment polystyrene foam was cut replicated three times. Table 1: Observations of Kerf Width
S. No. 1 2 3 4 5 6 7 8 9
A 100 100 100 300 300 300 500 500 500
B 0.2 0.7 1.2 0.2 0.7 1.2 0.2 0.7 1.2
C D I II III TPM NPM 0.5 1 1.58 1.62 1.53 1.573 -3.936 2.5 5 1.73 1.26 1.48 1.488 -3.454 4.5 10 1.66 1.70 1.86 1.738 -4.803 2.5 10 1.94 1.89 1.92 1.913 -5.636 4.5 1 1.77 1.78 1.99 1.842 -5.304 0.5 5 1.66 1.72 1.86 1.742 -4.819 4.5 5 2.01 2.04 1.86 1.968 -5.882 0.5 10 1.98 1.94 2.29 2.068 -6.312 2.5 1 1.79 1.89 2.08 1.920 -5.666
133
Table 2, P and F values accept Ho in case of cutting speed, assist gas pressure and standoff distance i.e. they are insignificantly participating in the variation of kerf width quality. The analysis also shows that better kerf width predicted as laser power (100 watt), cutting speed (0.7 m/s), assist gas pressure (2.5 bar) and standoff distance (5 mm).
2.2 One Way ANOVA with Replication With reference to Table 3, laser power is significant. P and cutting speed, assist gas pressure and standoff distance are insignificantly participating in the variation of kerf width quality but F value more than 1 also indicating the standoff distance significance compare to two other. The results are improved with replication. The analysis show that kerf width predicted the same input data set and similar prediction on the variance and mean point of view but in case of without replication variance results are not acceptable. Table 3: One way ANOVA with replication
Treatments
F
P-value
F crit.
Laser Power
16.066
0.000
3.403
Cutting Speed
0.021
0.979
3.403
Assist gas pressure
0.285
0.755
3.403
Standoff distance
1.691
0.206
3.403
2.1 One Way ANOVA without Replication In one way ANOVA the effects of input parameter are analyzed one by one on kerf width quality of laser cutting. The kerf width target performance measurement (TPM) is smaller the better and signal to noise ratio is larger the better. The continuous input variables were transforming in three levels and built an input table based on orthogonal array (OA), which reduced the number of observations and time of experiment [5].
2.1.1 Significance of Input Parameters F
P-value
With reference to table 4, the reason to perform the analysis is to improve the model of [1] and understand how the kerf width behaves when subjected to combination of parameters. “Interaction” stands for effect of laser power and cutting speed on kerf width. The F and P values accept null hypothesis Ho i.e. interaction between parameter A and B is insignificantly participating in the variation of kerf width. Table 4: Two ANOVA with replication
Table 2: One way ANOVA without replication
Treatments Laser Power
2.3 Two Way ANOVA with Replication
F crit.
11.568
0.009
5.143
Cutting Speed
0.007
0.993
5.143
Assist gas pressure
0.0997
0.907
5.143
Standoff distance
0.620
0.569
5.143
With reference to Table 2, input controllable parameter Laser power’s P and F values reject null hypothesis Ho i.e. population means of different groups are not equal. The F critical value shows that Laser Power is significantly participating in the variation in kerf width quality. The
Treatments Laser Power & Cutting speed Laser Power & A. gas pressure Laser power and standoff distance A. gas pressure and Cutting speed Cutting speed and Standoff distance A. gas pressure and standoff distance
F
P-value
F crit.
2.365 2.020 0.402 11.220 9.602 9.257
0.092 0.135 0.805 9x10⁻⁵ 0.0002 0.0003
2.928 2.928 2.928 2.928 2.928 2.928
Interaction between laser power and assist gas pressure is insignificantly participating in the variation of kerf width. Interaction between Laser power and standoff distance is
Copyright (c) 2012 International Journal of Computer Science Issues. All Rights Reserved.
IJCSI International Journal of Computer Science Issues, Vol. 9, Issue 3, No 3, May 2012 ISSN (Online): 1694-0814 www.IJCSI.org
134
insignificant. Interaction between cutting speed and assist gas pressure is significantly participating in the variation of kerf width. Interaction between cutting speed and standoff distance is significantly participating in the variation of kerf width. Interaction between assist gas pressure and standoff distance is significantly participating in the variation of kerf width.
3. Regression Analysis In Table 1, the relationship can be studied by collecting the experimental data. After collection of experimental data and drawing scatter plot. The scatter plot shows the nature of relation between the variables. They may be positive linear, negative linear or curvilinear relationships. Then calculate coefficient of correlation “r” to see the significance of correlation between the variables. If the value of r is not significant then predicting dependent parameter values by regression equation is a useless practice. If r is significant then determine regression equation by least square method. Yi = b1X1 + b0
(1)
The purpose of regression analysis in this paper is to see the relationship between dependent and independent parameters and predict unknown values as and when required to reduce the time and cost of experimentation and design.
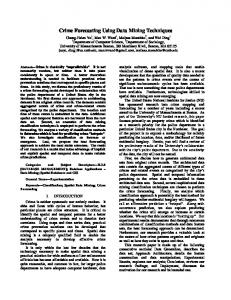
3.1 Linear Regression Analysis With reference to Table 5, r is positive 0.885 is signified on one tailed test between Laser power and kerf width. R2 shows the 78.3% variation in kerf width due to laser power. F and P values show laser power significance. In linear regression coefficient of line were calculated and T test value and p value which also shows that laser power causes significant variation in kerf width. Kerf width residual values in predicted value tables shows that the minimum, maximum, and average percent errors are 5.17%, 21.55%, 12.95% respectively. The values shows that the average error is considerably high i.e. more than 5%.
Fig. 1 Interactive graph of Laser Power and Kerf Width
Scatter plot shows coefficient of correlation r is negative 0.041 is insignificant between cutting speed and kerf width. R2 also shows 0.2% variation i.e. insignificant. F and P values shows insignificant role. In linear regression coefficient of line were calculated. Table 5: Linear Regression ANOVA
R Sig. r F Sig. F Intercept Coeff. X P-value
Laser Power +0.885 Significant 25.280 0.0015
Cutting speed -0.041 Insig.
Assist gas pressure +0.126 Insig.
Standoff distance 0.312 Insig.
0.012 0.914
0.113 0.746
0.758 0.413
1.517 0.001 1x10⁻³
1.819 -0.018 0.0914
1.772 0.014 0.746
1.725 0.015 0.413
Scatter plot shows r is positive 0.026 is insignificant between assist gas pressure and kerf width. R2 also shows 1.6% variation i.e. insignificant. F and P values also shows insignificant role. In linear regression coefficient of line were calculated. Scatter plot shows r is positive 0.312 is insignificant between standoff distance and kerf width. R2 shows that the 9.8% variation in kerf width due to standoff distance is significant then two insignificant factors. F value shows that it is insignificant but P value of linear regression coefficient of line shows insignificance. Kerf width residual values in predicted value tables shows that the minimum, maximum, and average percent errors are 6.38%, 53.97%, 25.94% respectively. The values show the reason of insignificance by T test and p value.
Copyright (c) 2012 International Journal of Computer Science Issues. All Rights Reserved.
IJCSI International Journal of Computer Science Issues, Vol. 9, Issue 3, No 3, May 2012 ISSN (Online): 1694-0814 www.IJCSI.org
135
tolerance margin is little bit wide then the model can be used as an empirical formula.
3.2 Multiple linear Regression
3.3 Nonlinear Regression NLR Analysis Scatter plot is drawn in Fig. 3, showing the nonlinear regression quadratic equation. The r is 0.891 (positive), significant and R2 value shows that the variation in kerf width is 79.4% due to laser power is highly significant parameter and also F value. In non-linear regression coefficient of quadratic equation T and p value shows that laser power causes no significant variation in kerf width.
Fig. 2 Comprehensive Interactive graph
Table 6: Multiple Linear Regression
R F A Coeff. X P-value
0.0010 0.0051
0.948 Sig.of r 8.858 Sig. F B C -0.0183 0.8047
0.0138 0.4723
Significant 0.0288 D 0.0151 0.1212
Regression analysis between controllable independent parameters (Laser Power, Cutting Speed, Assist Gas Pressure and Standoff Distance) with Kerf Width has been explained above. Y i = b 1 X 1i + b 2 X 2i + b 3 X 3i + b 4 X 4i + b 0
(2)
Scatter plots are drawn in Fig. 2 to observe relationship between the parameters. It shows the linear regression relationship drawn 95% confidence interval lines below and above if it is possible with the current scale of the plot. The data points lie in between them. The relation between Kerf width and input parameters are explained in one graph showing positive relation of dependent variable with laser power positive, cutting speed slightly negative, assist gas pressure slightly positive and standoff distance is positive. The r is 0.948 and significant on single tailed test. R2 value shows that the variation in kerf width is 89.9% can be explained by independent parameter which is highly significant in controlling the quality compared to the variation due to uncontrollable parameters.
Scatter plot shows the nonlinear regression quadratic equation with r is positive 0.757, significant and R2 value shows that variation in Kerf width is 57.2% due to laser power that shows it is a significant parameter in controlling the quality. F value shows the significant role of laser power. T test value and p value H o i.e. unable to model the problem. The prediction error is more than 50%. Scatter plot shows the nonlinear regression quadratic equation of cutting speed with trend line. The r is positive 0.042 and insignificant. R2 value shows that variation in kerf width is 0.2% i.e. cutting speed is insignificant. F, T test and p values accepted H o . The Cutting Speed causes no significant variation in kerf width. Scatter plot shows the nonlinear regression quadratic equation of assist gas pressure with trend line. The r is positive 0.152 and insignificant R2 value 2.3% shows insignificance. F, T test and p values shows H o accepted that assist gas pressure causes no significant variation in kerf width. Scatter plot shows the nonlinear regression quadratic equation of standoff distance with trend line. The coefficient of correlation is positive 0.351 and insignificant. R2 12.4% shows that, it is not significant parameter in controlling the quality compared to other parameters. F value, T test and p values accepted H o . The standoff distance also causes no significant variation in kerf width. The predicted values show that the error is about 50%.
Analysis of variance results shows by F value H o is rejected. In linear regression table coefficient of independent parameters are calculated and also T test value and p value of input parameters A, B, C and D were calculated. The null hypothesis is accepted except Laser Power. Kerf width residual values in predicted value tables shows that the minimum, maximum, and average percent errors are 0.71%, 20.66%, 7.99% respectively. The values show that the error is considerably low. But in the case Fig. 3 Quadratic graph of Laser Power without replication
Copyright (c) 2012 International Journal of Computer Science Issues. All Rights Reserved.
IJCSI International Journal of Computer Science Issues, Vol. 9, Issue 3, No 3, May 2012 ISSN (Online): 1694-0814 www.IJCSI.org
Table 7: Non linear Regression ANOVA
A Without Rep.
A With Rep.
B With Rep.
C With Rep.
D With Rep.
R +0.891 +0.757 +0.042 +0.152 +0.351 Sig. Insig. Insig. Insig. Sig. r Sig. F 11.568 16.066 0.021 0.285 1.691 0.0087 3x 10⁻⁵ 0.979 0.755 0.206 Sig. F T test X 1.457 1.7169 -0.140 -0.403 -0.865 0.195 0.0989 P-value 0.889 0.691 0.395 T test X2 -0.564 -0.665 0.107 0.536 1.206 0.593 0.5124 0.915 0.597 P-value 0.240
3.4 Multiple non linear Regression Regression analysis between controllable independent parameters with kerf width is explained. Scatter plots are drawn but not mentioned in the paper. The r is positive 0.849 shows significant and R2 shows that the variation in kerf width is 72.1% due to independent parameters which is sufficiently significant parameter in controlling the quality comparing to the variation due to unknown variables. Analysis of variance shows the significant role of independent controllable parameters by F value. Nonlinear regression of multivariable calculates the coefficient of quadratic equations. The hypothesis by T test value and p value of A, B, C and D and their square values are accepted i.e. the independent parameters cause insignificant variation in kerf width. Kerf Width predicted residual shows that the minimum, maximum, and average percent errors are 1.82%, 59.48%, 55.81% respectively. The values show that the error is more than 50%. Table 8: Multiple Linear Regression
R F Coeff. X P-value Coeff. X2 P-value
A 0.002 0.082 -9x10⁻⁷ 0.485
0.849 Sig.of r 5.811 Sig. F B C -0.073 -0.046 0.821 0.522 0.039 0.012 0.863 0.397
Significant 0.0010 D -0.042 0.201 0.005 0.081
In Two way analysis of variance i.e. interaction shows the Means and Variance due to interaction between the two parameters ignoring other parameters. The significance of interaction is measured by significance of F value. Three of the interactions are insignificantly participating in the variation of dependent parameter. 1. 2. 3.
Laser power and cutting speed on kerf width Laser power and assist gas pressure on kerf width Laser power and standoff distance on kerf width
Following three of the interactions are significantly participating in the variation of dependent parameter. 4. 5. 6.
Cutting speed and assist gas pressure on kerf width Cutting speed and standoff distance on kerf width A. gas pressure and standoff distance on kerf width
The interaction 4, 5 and 6 are significant and it is better to consider in the analysis reducing the pool errors or unknown errors of [1]. For better optimization consider two way ANOVA with one way ANOVA. In different studies it is ignored such as S.B.Tan et al. [6] but will give better results in polystyrene foam and UF melamine laser cutting. For the analysis of multi-linear regression, scatter plots were drawn without replication so data points lie in between 95% tolerance limit. The coefficient of correlation and significance are same as linear regression results. In Table 5, Laser Power is a significant parameter in the variation of kerf width and at a low level so is standoff distance. The results verified the analysis of variance technique used in S.B. Tan et al. Tan et al. 2008). The value of R2 encourage to use the regression modeling techniques but their maximum residual and average residual errors do not allow to recommend the method to be used. Table 9: Summary of linear Regression
R2 A 78.3% B 0.2% C 1.6% D 9.8%
4. Discussion In one way analysis of variance results with replication and without replication support the benefit of replication. The results of one way ANOVA show that use of replication improves the F value. It means, replication improves the ability of bifurcation between controllable and uncontrollable variations.
136
F sig. 0.001 0.914 0.74 0.412
P,t test 0.001 0.091 0.746 0.413
Max. Average Remarks error error 21.55% 12.95% Significant 54.83% 25.77% Insignificant 54.83% 25.07% Insignificant 53.97% 25.94% Insignificant
The overall coefficient of correlation is improved to positive 0.984 and significant. R2 encourage using the model because kerf width is 89.9% due to independent parameters which is highly significant parameter in controlling the quality comparing to the variation due to uncontrollable parameters i.e. 10.1 percent only. Analysis
Copyright (c) 2012 International Journal of Computer Science Issues. All Rights Reserved.
IJCSI International Journal of Computer Science Issues, Vol. 9, Issue 3, No 3, May 2012 ISSN (Online): 1694-0814 www.IJCSI.org
of variance results shows the significant role of independent controllable parameters by F, t and P values. kerf width residual predicted value shows that the minimum, maximum, and average percent errors are 0.71%, 20.66%, 7.99% respectively. The values show that the error is considerably low i.e. around 8%. Therefore, this model can be used to see an approximate trend of idea dependent variable.
Table 10: Summary of non linear Regression
% R2 F sig. P of t test A 79.4 0.009 A 57.2 3x10⁻⁵ B 0.2 0.979 C 2.3 0.755 D 12.4 0.206
.19, .59 .09, .5 .89, .92 .69, .6 .4, .24
Max. error 23.85% 59.48% 93.84% 89.46% 82.37%
Average error 11.94% 55.81% 84.75% 8.89% 76.14%
H0 Accepted Accepted Accepted Accepted Accepted
Non linear regression analysis between Laser power and kerf width without replication is considered in sub-heading 3.3. Nonlinear regression quadratic equation with coefficient of correlation is positive 0.891 and significant and coefficient determination R2 value shows that the variation in kerf width is 79.4% due to laser power that shows that it is a highly significant parameter in controlling the quality compared to other parameters. F shows significant and T test, p values shows insignificant role of Laser power i.e. the problem of inferior modeling. The results show inferior modeling in non linear regression than linear regression, ANOVA analysis of laser power effects on kerf width and in multi-linear regression. The data is nonlinear but it is unable to model due to the nature of data pattern and error squared in X2 values. The value of curve fitting parameters like coefficient of correlation and R2 are better in nonlinear case but null hypothesis is accepted which is not desirable in this case. The residual values are also not better than the single and multi linear regression. The results of non-linear regression show that Laser power is the most important parameter. Its R2 value decreases with the replication. The pattern of the data is above or below the last square point. In case of without replication the model touches only one point out of 3 in case of replication it only touches one point out of 9 points. The error is increased due to replication and it will continue increasing if more observations are considered as in factorial design [7]. The null hypothesis H 0 accepted for all variables which show that non linear regression with or without replication cannot explain the variations in dependent variables. The residual error due to predicted values increased in non linear case rather than in linear prediction. Yusoff et al. [8] explain many non linear
137
relations by using only one independent and one dependent variable and keep other constant but in our case three other independent variables are changing along with the considered variable. Therefore, this modeling technique cannot be recommended on the basis of the Table 10 results. Multiple nonlinear regression analysis shows that r is positive 0.849 and R2 value shows that the variation in kerf width is 72.1% due to independent parameters which is significant parameter in controlling the quality. F value also shows significant contribution of controllable parameters. But t test results show insignificant role in the variation i.e. unable to model the problem. The predicted values also show high degree of error about 50%. Therefore, nonlinear regression model is not suitable for our data for simulation and optimization.
5. Conclusion The one and two way ANOVA are able to model the problem with and without replication. The model gives better results in case of replication shows suitable analysis technique for given datasets. Higher F values small uncontrollable variations gives advantage of replication. The interaction should be considered to get the better picture of the process optimization. The model will be useful in our running research of Polystyrene laser cutting of multivariable quality parameters optimization [1]. R2 encourage using the multiple linear regression model because Kerf width variation can be explained is 89.9% which is highly significant. It can be used in rough modeling, simulation and optimization. The results of non linear regression are worst compare to others and with replication become more non-realistic due to increase in the number of observation over and above the fitted points similar to linear regression. The average error reaches to 50%. The best method was one way ANOVA with pooling but the current research shows that there is one thing missing that is significantly participating in the variation of dependent parameters i.e. interaction between two independent and one dependent parameters. The discussion of interaction above shows that three combinations of interactions were significantly participating in the variation of Dependent variable. Therefore, modeling can be improved with the combination of Treatments and Interaction based design of experiment. Acknowledgment I would like to thank Professor Ejaz Ahmed for his valuable guidance. I am also thankful to my parents,
Copyright (c) 2012 International Journal of Computer Science Issues. All Rights Reserved.
IJCSI International Journal of Computer Science Issues, Vol. 9, Issue 3, No 3, May 2012 ISSN (Online): 1694-0814 www.IJCSI.org
wife(Aelya Ali) and children (Baqar, Shaheer and Manahil).
References [1] M. Zaidi, “Laser Cutting Parameters Optimization Of
[2]
[3]
[4]
[5]
[6]
[7]
[8]
Polystyrene Foam Using Taguchi Method And Artificial Neural Network Tools”, Computer Science, SZABIST, Karachi, 2010. A. Sharma and V. Yadava, “Modelling and optimization of cut quality during pulsed Nd:YAG laser cutting of thin Alalloy sheet for straight profile”, Optics and laser technology, vol. 44, no. 1, 2012, pp. 159-168. A.K. Pandey and A.K. Dubey, “Taguchi based fuzzy logic optimization of multiple quality characteristics in laser cutting of Duralumin sheet”, Optics and Lasers in Engineering, vol. 50, no. 3, 2012, pp. 328-335. M. Zaidi, et al., “Laser Cutting Quality Control of Melamine Using Artificial Neural Networks ”, Proc. APIEMS: Asia Pacific Industrial Engineering and Management Systems Conference, 2010. I. Uslan, “CO2 laser cutting : kerf width variation during cutting”, Journal of engineering manufacture, vol. 219, no. 8, 2005, pp. 571-577. S.B. Tan and Y.Nukman, “A study of laser engraving on Ceramic material,” Department Of Engineering Design And Manufacture, Faculty of Engineering, University Of Malaya, Kuala Lumpur, 2008. I.A. Almeida, et al., “Optimization of titanium cutting by factorial analysis of the pulsed Nd:YAG laser parameters”, Journal of Materials Processing Technology, vol. 179, no. 2006, 2006, pp. 105-110. N. Yusoff, et al., “Selected Malaysian Wood CO2-Laser Cutting Parameters And Cut Quality”, American Journal of Applied Sciences, vol. 5, no. 8, 2008, pp. 990-996.
138
Dr. Nukman Bin Yusoff is currently designated as Associate Professor in the Department of Engineering Design & Manufacture, University of Malaya (UM), Malaysia. He is actively doing research in the field of Laser Materials Processing, CAD/CAM, CNC and Manufacturing Process and Management. He acquired his PhD from Loughborough University in 2009 and Master in Engineering Science, MSc. (Mechatronics) from DeMontFort University, Leicester United Kingdom in 1998. Since then he has been teaching undergraduate in the field of CAD/CAM, Manufacturing and graduate level teaching since 2007. He published more than twenty papers and articles in different international, regional and national journals, conference proceedings and bulletins and coauthor of two technical books.
Syed Mustafa Ali Zaidi is a full time research scholar at the Faculty of Computing, Shaheed Zulfikar Ali Bhutto Institute of Science & Technology (SZABIST), Karachi, Pakistan. He received a Master of Applied Physics degree from Karachi University in 1994, Master of Power engineering degree from NED Karachi in 1997 and Master of Computer Science degree from SZABIST in 2010. He has received merit scholarship during the Master degrees and currently receiving scholarship for Ph.D. from Higher education commission Pakistan. His research interests include Computer Networks, Communication Systems optimization of multivariable quality characteristics using statistical and machine learning tools. He is currently a member of IEEE. Dr. Bushra A. Saeed is an Associate Professor and Head of Bioscience department at SZABIST. She completed her PhD in Biotechnology from the University of Karachi and her Post Doctorate from Cornell University, USA. Her research interest involves utilizing Statistical tools to manipulate date generated from Stem Cell Research and Plant Tissue Culture. Her field of specialization involves molecular tools for DNA screening. Dr. Imran Amin received PhD in Mechatronics from Loughborough University, UK in 2007. He is the Head of CRER and is the managing editor of the Journal of Independent Studies and Research - Computing (JISR-C). His areas of interest are Mechatronic Systems, Artificial Intelligence, Laser cutting, Computer vision, Automation, Embedded systems and Robotics.
Copyright (c) 2012 International Journal of Computer Science Issues. All Rights Reserved.