The current issue and full text archive of this journal is available at www.emeraldinsight.com/1741-0398.htm
JEIM 21,1
52
SPECIAL SECTION
Data mining techniques for HIV/AIDS data management in Thailand A. Vararuk and I. Petrounias School of Informatics, University of Manchester, Manchester, UK and
V. Kodogiannis Harrow School of Computer Science, University of Westminster, London, UK Abstract Purpose – This paper investigates, through the use of data mining techniques, patterns in HIV/AIDS patient data. These patterns can be used for better management of the disease and more appropriate targeting of resources. Design/methodology/approach – A total of 250,000 anonymised records from HIV/AIDS patients in Thailand were imported into a database. IBM’s Intelligent Miner was used for clustering and association rule discovery. Findings – Clustering highlighted groups of patients with common characteristics and also errors in data. Association rules identified associations that were not expected in the data and were different from traditional reporting mechanisms utilised by medical practitioners. It also allowed the identification of symptoms that co-exist or are precursors of other symptoms. Originality/value – Identification of symptoms that are precursors of other symptoms can allow the targeting of the former so that the later symptoms can be avoided. This study shows that providing a pragmatic and targeted approach to the management of resources available for HIV/AIDS treatment can provide a much better service, while at the same time reducing the expense of that service. This study can also be used as a means of implementing a quality monitoring system to target available resources. Keywords Data collection, HIV, Diseases, Thailand Paper type Research paper
Journal of Enterprise Information Management Vol. 21 No. 1, 2008 pp. 52-70 q Emerald Group Publishing Limited 1741-0398 DOI 10.1108/17410390810842255
Introduction and background In 1983 the first case of HIV/AIDS came to the knowledge of the World Health Organization (WHO). Soon after this the WHO declared it as an epidemic disease. In the case of Thailand, the first case of AIDS was reported in 1984, and by April 2000 there had been a total of 590,990 reported cases (Phoolcharoen, 1998). Thus, under the ministry of public health, the Thailand government through the communicable disease control (CDC) department implemented activities for monitoring and managing HIV/AIDS evolution and awareness by setting up a 24-hour emergency unit to collate, analyse and report the situation to both policy makers and implementers in particular, and to the world in general. By 1985 all Thailand provincial health care offices had regulations requiring physicians and other health-care providers to report AIDS cases directly to Ministry of Public Health or local health offices. HIV continues to spread around the world and it is estimated that in recent times, one in every 100 adults in the most sexually active age bracket (15-49) is infected with HIV (Phoolcharoen, 1998). HIV
infections are concentrated in the developing world, mostly in countries least able to afford to care for infected people. In fact, 68 per cent of people with HIV live in sub-Saharan Africa and the developing countries of Asia, which between them account for less than 10 percent of the global gross national product (report on the global HIV/AIDS epidemic as of June 1998, UNAIDS and WHO). Since 1991, the Thailand government has relied on the AIDS voluntary reporting system, whereby health institutions and physicians are encouraged to report the specific details of AIDS cases anonymously to the Ministry of Public Health. As with any other country in the absence of systematic screening for HIV, the actual number of cases of HIV infection in Thailand is believed to be considerably higher than the number of officially reported cases. It is very likely that the current statistics may not reveal the true level of infection due to under-reporting of AIDS cases from hospitals. The American Centre for Disease Control and Prevention recognised a need for a reporting tool for epidemiological data. This led to the development in the 1980s of Epi-Info (Centre for Disease Control and Prevention, n.d.). In 1988 Epi-Info was developed further at the World Health Organization in Geneva. This led to a greater global awareness of Epi-Info and its uses, leading it to become one of the standard products used by heath organizations. This allowed scientists to share information between Epi-Info systems and expand their research beyond their own data stores. However, its nature does not allow for sophisticated data analysis and pattern identification. Huge amounts of data have been collected through the advances in database technologies and data collection techniques. Data about HIV/AIDS form no exception. This explosive growth of data creates the necessity of automated knowledge discovery from data. Up to now there have not been any studies trying to identify patterns in HIV/AIDS data. The analysis of the categories of people affected more has been largely empirical as has been the symptoms that people may have as a result of other symptoms. The work reported in this paper concentrates on applying data mining techniques to HIV/AIDS data from Thailand and utilising the data mining results for the management of HIV/AIDS. The study applies clustering in order to identify exact characteristics of categories of people affected by the disease. It also applies association rule mining to identify symptoms that may follow a set of existing ones. Identification of these patterns can be used to target resources at precursor symptoms and also for the monitoring of the disease. The rest of this paper is organised as follows. The following section describes relevant work in applying intelligent systems techniques to HIV/AIDS data. The remaining sections report on the techniques used as part of this study, details the results obtained and their significance within a disease management context. Finally the last section reports on further work that needs to be carried out in this area. Relevant work HIV infection and Acquired Immunodeficiency Syndrome (AIDS) are a major health problem worldwide. In the early 1970s, the idea of intelligent systems was viewed as a theoretical foundation for building machine learning systems. It was proven to have many limitations. Recent neural network (NNs) and fuzzy logic (FL) research has overcome some early limitations. Since the development of the NNs, they have received considerable attention and have been applied to a variety of problems in classification and prediction. NNs have been applied successfully for development of nonparametric statistical models. More reliable outcome research has been explored in the area of
Data mining techniques
53
JEIM 21,1
54
pattern classification and pattern prediction. One of the advanced features is the development of a back propagation algorithm (BP) in a learning mechanism to train multi-layer networks. Many studies have applied an NN model to classify and to predict desired solutions or to improve methodological aspects (Faraggi and Simon, 1995). In spite of the successful application in such models, scant attention has been made to the HIV/AIDS prevention and care planning area. Few years ago, a study of an NN application to the classification of the functional health status of AIDS/HIV patients was explored (Kwak and Lee, 1997). Recently, a study presented an application of neural networks to classify and predict the symptomatic status of HIV/AIDS patients (Lee and Park, 2001). A neural network model was developed and analysed. Several different neural network topologies were applied to ACSUS datasets in order to demonstrate the neural network’s capability. Neural networks are known to be able to identify relationships even when some of the input data are very complex, ill defined, and ill structured. One of the advantages of an NN is that it can discriminate linearly inseparable data. That study made a substantial contribution to the HIV/AIDS care and prevention planning area by comparing the impact of various NN methodologies on the classification of HIV/AIDS-related persons. Over the last decade, the mathematical literature on uncertainty has also grown considerably, especially in system modelling, optimisation, control, and pattern recognition areas, to mention a few. Several authors have advocated the use of fuzzy set theory in epidemiology problems (Jafelice et al., 2002) and population dynamics (Krivan and Colombo, 1998). Since the advent of the HIV infection, mathematical models have been developed to describe its dynamics (Novak and Bangham, 1996). Fuzzy set theory was utilised to deal with the uncertain nature of evolution from positive HIV population to AIDS manifestation (Jafelice et al., 2004). In particular, parameter l, the transference rate of the classical Anderson’s model (Murray, 1990), was viewed as a linguistic variable whose values are fuzzy sets that depend on the viral load y and CD4 þ level. CD4 þ is the main T lymphocyte attacked by the HIV retrovirus when it reaches the bloodstream. The notion of transference rate l as a linguistic variable with fuzzy values captures its biological meaning more faithfully to classify the disease stages and to help decide when the anti-retroviral therapy should be used. In addition, from the transference rate and approximate values of viral load, it was shown how the expected value of the proportion of symptomatic population can be found for each time instant t . 0. However, these studies do not consider the transference rate of symptomatic to asymptomatic individuals considering populations with regular adhesion to treatment, and do not also provide a “linguistic” form of association rules in order to model HIV positive populations with irregular adhesion to anti-retroviral therapy. Hence, it is of great importance that tools that exploit information derived from the association processing rule mining should be developed. Such implementation can certainly make a significant difference in the way that symptoms could be targeted. Data mining The data mining experiments were performed by utilising IBM’s Intelligent Miner (IBM, 1999). The dataset was imported into a database system so that input files could be created for use within intelligent miner. As each record was imported it was cleansed of erroneous values, data inconsistencies, and formatting discrepancies. At
the first instance any records that contain outliers (items that deviate by a significant amount from the norm) were not excluded, because they may be indicative of a true situation and should only be eliminated later if they distort the patterns sufficiently for it to be necessary for investigation to prove their veracity. The “cleaned” data was processed through the Intelligent Miner system using two methodologies: (1) Searching for patterns that theoretically should exist (e.g. there is a probability of x per cent that symptom A leads to symptom B thereby causing symptom C). (2) Allowing the Intelligent Miner to search for patterns and examining them for relevance and significance.
Data mining techniques
55
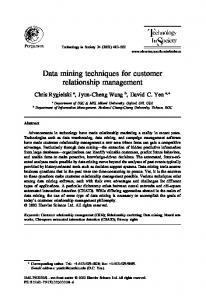
The data needed, as part of data pre-processing, to be transformed into a mainstream database format so that they could be used for further analysis. Following the data transformation, the database schema is shown in Figure 1. The populated database consists of 250,000 anonymised records. Clustering Clustering is a common descriptive task to identify a finite set of categories or clusters to describe the data. Clustering models segment a database into different groups whose
Figure 1. Database schema
JEIM 21,1
56
Table I. Example of data views highlighting anomalies
members are very similar. Unlike classification, the clusters will not be known when a mining procedure is started, or on what attributes the data will be clustered. Thus, the goal of clustering is to find important regularities in the data, and its result is a set of classes that have been found to accurately summarise the data. The demographic clustering technique is for measuring the distance between input records and thus assigning these records to specific clusters. Pairs of records are compressed by the values of the individual fields within them. The number of fields that have similar values determines the degree to which the records are judge to be similar. The number of fields that have dissimilar values determines the degree to which the records are judged to be different. The basic idea is that a record is then assigned to another cluster if the overall score is higher than the overall scores if the records were assigned to any of the other clusters. If the overall scores turn out to be negative, the record is now a candidate for placing it in its own cluster. Demographic clustering, which describes personal characteristics (Cabena et al., 1997), has advantages both in its ability to automatically determine the number of segments to be generated and in the clarity of the resulting partitioning of large data sets. Once sufficient large clusters are formed, the decision for placing a next record in a cluster, where a large set of records is involved, is not done by comparing each field of this record with field values of all records in all clusters. It is done by comparing the field values of this record against the value distributions of each field, where these distributions are calculated per cluster on the basis of the records in each cluster. To partition a database so that records that have similar characteristics are grouped together (applying clustering), active fields must be specified. The active fields are used for model generation by the mining function. Supplementary fields can also be specified but they are ignored when a function builds a model. They can be used to gain statistical information on the clusters that are found. However, in the clustering results viewer they appear as part of the clusters. The fields in a cluster are ordered by importance. It is therefore possible that supplementary fields are seen among the active fields in a cluster. This means that supplementary fields would have influenced the creation of the clusters, perhaps more than the fields specified as active fields. Whenever multiple mining processes are applied to the same data, relevancy can arise in the set of results. For example, an age group may define a pandemic of a virus that is concealed by a negative value in the whole data set. An example of this is shown in Table I, where poor data recorded in the age group 0-4 for symptom 3 allows for the existence of the poor data to be masked in the age group summary figures. However data mining is more likely to produce the associated view of symptom summary that
Symptom/age
Age 0-4
Age 5-9
Age 10-14
Age 15-19
Symptom summary
Symptom 1 Symptom 2 Symptom 3 Symptom 4 Symptom 5 Age summary
20 12 2 40 22 18 32
2 4 6 3 1 16
1 5 2 3 1 12
34 45 32 37 39 187
57 66 0 65 59
Note: The age summary shows a very different view to the symptom summary
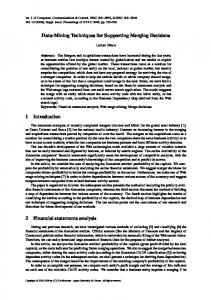
shows an anomalous trend allowing for further scrutiny to reveal the cause. By using clustering techniques it is possible to form such groups and then analyse them further. In this study, the purpose of clustering within the database is to discover homogeneous sub-populations in a database to improve the accuracy of the profiles. The population has been segmented into clusters, which represented significant sub-populations within database. The Active fields within this study were RegionName, Behaviour, Gender, LivingPlaceType, MaritalStatus and AgeGroup. These were used to form the major segments and within these were all the symptom fields. If one looks at the summary in Figure 2 they can see that the majority of the population falls into a certain group that are rural based, married, heterosexual females in the age range 20-44. In particular we then examine the largest segment in more detail (36 per cent, see Figure 3). One can see how each region is affected with people fitting these parameters. If one then looks at the statistical analysis for the symptoms they can see that no more than seven are significant positive active factors. This allows a far more precise targeting exercise for medical resources. This permits a much more coherent overview of the segment and permits a quick appraisal of the situation. It must be remembered that the data is clustered according to the criteria supplied and different selections may produce very different results. For example using the same parameters as above but only clustering on the standard groups of age, region and gender, which is typically done by health organisations, provides a different view (Figure 4). The clusters determined were more useful than those provided by the Epi-Info as the latter only provides answers to asked questions, whereas these views provide an overview of the items requested and shows all related fields in a statistical manner, something that is lacking in traditional reporting (Figure 5). This is beneficial to those determining policies as the combination of clustered items and their related statistics
Data mining techniques
57
Figure 2. Demographic sample of population cluster
JEIM 21,1
58
Figure 3. Attributes that were participated in AIDS/HIV clustering technique
Figure 4. Alternative clustering of the AIDS/HIV data
Data mining techniques
59
Figure 5. Data preparation overview
can show how selected items are distributed and how symptoms are related to these items. This is very important when deciding how to target specific medical campaigns. The clustering function does allow us to review the situation and derive further classes from these attributes that can be used to determine treatment/action groups for targeting key groups. Looking at Figure 4 we can see how clearly that it highlights the largest key classes of 93 per cent of males, 86 per cent of ages 30-39 and 58 per cent of the Changmai Region are affected by these symptoms. This provides a very useful counterpart to the Epi-Info analysis and will either validate the Epi-Info results or highlight discrepancies that should produce further relevance as they are investigated. Clustering also allows one to very the active fields and can highlight, as shown above, problems with poor data. Association rule analysis Association models find items that occur together in a given event or record, rules associating these items can then be derived from these models. The formal definition of association rules is as follows (Agrawal et al., 1996): given a set of transactions, where each transaction is a set of items, an association rule is an expression of the form X ) Y, where X and Y are sets of items. An association rule also has an associated confidence and support. A rule’s confidence is defined to be the probability that a transaction that contains X also contains Y and its support is the percentage of transactions that contain X and Y. The association mining technique used in this study has two aims. The first is to find association rules between patient symptoms and how they relate to the infection. The second is to investigate relations between changeable attributes that may affect epidemiology. In this study we wish to illustrate how the data collated in Thailand can be utilised to enhance the management functions of the health care system and provide insights for the medical workers within the system. This entire database file (250,000 patient records) was processed by intelligent miner to determine what associative rules existed using the following parameters: maximum rule length 3, minimum support 25 per cent, minimum confidence 17 per
JEIM 21,1
60
cent, item constraints none. Once completed a set of 79 rule sets were derived from the database. A sample rule set is shown in Table II. The goal of this is to find all sets of items whose support is greater than a user-specified minimum. These sets are called frequent item sets. In this study we identified certain symptoms that occurred in this manner by allocating a weighting of one to each symptom where it was the rule head and where it formed the only part of a rule body. For those symptoms that formed a body of the form A þ B both symptoms were assigned a weighting of 0.5. These were then collated and the results are shown in Figure 6 and Table III. Using the frequency of the items along with the rules derived from the database it is possible to derive further information beyond the rules themselves. Looking at the most frequent symptom shown in Table III, wasting syndrome (emaciation, slim disease), is by far the most prevalent. This is both in the causes of further symptoms (within the rule body) and as a result of other symptoms (within the rule head). Using these observations we can relate them together and show that treatment of wasting syndrome (emaciation, slim disease) will reduce the probability of the 24 rule bodies where it is present proceeding to their rule heads and therefore reducing the need for the symptoms in the rule head requiring treatment. From the details shown above we can see that over 67 per cent of the data relate to four specific symptoms: (1) Wasting syndrome (emaciation, slim disease). (2) Mycobacterium tuberculosis, pulmonary or estrapulmonary. (3) Oral candiddiasis or hairy leukoplakia. (4) Fever for more than one month. These can be compared to the “top ten” symptoms reported via traditional analysis as shown in Table IV (Epidemiology Division, 1998). The four largest percentages from such traditional reporting relate to: (1) Mycobacterium tuberculosis-pulmonary or estrapulmonary. (2) Wasting syndrome (emaciation-slim disease). (3) Pneumocytis carinii. (4) Oral candiddiasis or hairy leukoplakia. There is an overlap (but also some important differences) between the standard reporting of volumes of data and that of mining the data to see how associations between symptoms can highlight areas of investigation. The volume based reporting does not allow the clarity of perception allowed by the mining techniques. Looking at the volume related reporting table (Table IV) one can see that there are several symptoms of a significant volume, such volume that it would be worthwhile taking preventative measures and attempting to eliminate them. We can tell nothing more from such volume-based data as it merely reports the quantities in defined areas. The data mining approach does tell us far more than this existing crude analysis. It reveals the previously unknown characteristics of the relationships between these symptoms. There is not only the knowledge of how many cases are reported, but also which symptoms are likely to cause or be a consequence of specific symptoms. These results indicate that targeting resources against the four symptoms that form 67 per cent of
Wasting syndrome (emaciation, slim disease) Mycobacterium tuberculosis, pulmonary or extrapulmonary Mycobacterium tuberculosis, pulmonary or extrapulmonary Fever for more than one month Oral candiddiasis or hairy leukoplakia Wasting syndrome (emaciation, slim disease) Oral candiddiasis or hairy leukoplakia Oral candiddiasis or hairy leukoplakia
! ! ! ! ! ! ! !
Fever for more than one month
Diarrhoea for more than one month Fever for more than one month þ mycobacterium tuberculosis, pulmonary or estrapulmonary Persistent cough or any pneumonia more than two months (except TB) Mycobacterium tuberculosis, pulmonary or estrapulmonary Wasting syndrome (emaciation, slim disease) þ cryptococcosis
Rule head
Oral candiddiasis or hairy leukoplakia Oral candiddiasis or hairy leukoplakia
Rule body
19.05 15.75 14.27 14.09 13.97 13.84 13.50 13.27
69.59 63.28 63.34 74.19 78.74 77.63 54.22 77.04
27.377 24.895 22.534 18.996 17.743
17.228
24.895
17.833
Affected (%)
Confidence (%)
Support (%)
Data mining techniques
61
Table II. Sample association rule set from the HIV/AIDS database
JEIM 21,1
62
Figure 6. Graph of common symptoms
Symptom items
Table III. Most common items in symptom rule sets
Wasting syndrome (emaciation, slim disease) Mycobacterium tuberculosis, pulmonary or estrapulmonary Oral candiddiasis or hairy leukoplakia Fever for more than one month Pneumocytis carinii Cryptococcosis Cachexia or more than 10 per cent weight loss Diarrhoea for more than one month Asthenia more than one month Persistent cough or any pneumonia more than two months (except TB) Persistent dermatitis for more than one month
% 21.52 16.46 16.46 12.66 10.13 8.86 5.06 5.06 1.27 1.27 1.27
associations will not only decrease the volume of cases, but as the associated symptoms will become unlikely to be contracted, the cases also will fall as the relationship depends on one of the four main symptoms. The targeting is strengthened again by the results of the mining exercise as the rules derived can be used to facilitate the way resources are managed. For example, if we examine the most common symptom, wasting syndrome (emaciation, slim disease). This occurs in 41 rules, 24 times in the body and 17 in the head. This means it is responsible for the development of 24 symptoms that may not result should it be eradicated. This is a completely new
Symptom items Mycobacterium tuberculosis, pulmonary or estrapulmonary Wasting syndrome (emaciation-slim disease) Pneumocytis carinii Oral candiddiasis or hairy leukoplakia Cryptococcosis Fever for more than one month Cachexia or more than 10 per cent weight loss Diarrhoea for more than one month Persistent dermatitis for more than one month Persistent cough or any pneumonia more than two months (except TB)
% 20.55 19.21 14.82 13.74 12.33 12.31 7.63 6.95 6.35 5.98
paradigm in health care analysis; previously such knowledge would be derived from a full medical study or anecdotal experience. The former is expensive and lengthy; the second is prone to human misconception. Consequently, having a method of swiftly inspecting a pandemics domain, establishing relationships between attributes of the pandemic and subsequently analyse these for relevance is a leap forward. Unlike traditional reporting this information can be used as part of a campaign with an emphasis on the 17 rules that have this symptom as their head. These 17 rules allow health workers to look for and treat symptoms that lead to wasting syndrome (emaciation, slim disease), thereby reducing the probability of the symptom occurring. Association rule mining on key groups Grouping. Once a rule is derived from the entire database, it will hold true for that database as long as the confidence and support factors are within the defined tolerances, these can be considered “confident” rules. We can check if such “confident” rules are also applicable to subsets of the original data. This allows for a finer resolution of the applied rule, in that we can explore further how it relates to key segments of the database population as it will either hold true for all subsets, or the rule will only apply for certain subsets. If it is only applicable to certain subsets then this is a further indicator of how useful the rule is. For example a rule that applies to the male population only will appear in the whole database and a subset containing only those of a male gender but will not appear in a female subset. Therefore the decision was made to not only mine the entire database, but to examine key groups and see how the same rule applied to the subsequent subset. As this study is based upon the data generated for the Ministry of Public Health in Thailand the groupings used were aligned with those that the Ministry currently uses so that the usefulness of the study could be evaluated using these as a base line. Age grouping. In this study we used a standard measure of allocating the patients into set age groups (the age is determined at the time of data collection). These are defined as 16 classes each covering a period of five years from birth (zero); apart from the 16th group that is for those aged 75 and over. This should establish if the pandemic varies within the age groups as this will help highlight the vector that influences when the symptoms begin to appear in age grouping.
Data mining techniques
63 Table IV. “Top ten” symptoms, via traditional reporting
JEIM 21,1
64
Gender grouping. For this study, the patients were also divided into two groups determined by their gender. It sounds obvious, but there are many factors that differ between the sexes and this division should allow any different patterns to be established between male and female reporting. Region grouping. In this study we used a standard measure of allocating the patients into set groups determined by the geographical region they inhabited at the time the data is captured. There are 12 such geographical management regions in Thailand. Again it is desirable to know how the pandemic varies between regions, is it centred around a point or generally dispersed? This is one of the reasons the data is viewed in this way. The data were then processed using the same criteria as the original file of all data: maximum rule length – 3, minimum support – 25 per cent, minimum confidence – 17 per cent, item constraints – none. These were then adjusted if the rule set generated was significantly smaller than the original, as the intention was to produce a similar number of rules, where practical, for each file as were in the original; this should allow for a large enough set for each group to perform a comparison. A summary of these variations in parameters and results are illustrated in Table V. Using a purpose written tool the resulting rule sets were then merged; prefixing them by the identity of the file that they originated from so that the groupings maintained their unique identity within the aggregate file. Once they were in a single Mining group
Percentage of all
Rules
Min. support
Transactions
Total frequent item sets
100.00
79
17.03
34,565
47
Males Females
72.75 27.25
66 39
15.60 12.00
30,360 17,555
42 31
Age01 Age02 Age03 Age04 Age05 Age06 Age07 Age08 Age09 Age10 Age11 Age12 Age13 Age14 Age15 Age16 Region01 Region02 Region03 Region04 Region05 Region06
8.26 1.35 0.09 0.97 10.51 25.85 23.32 14.08 7.61 3.65 1.82 1.11 0.77 0.36 0.15 0.11 16.16 4.51 8.61 6.38 4.80 5.99
106 66 51 30 44 41 40 30 36 48 36 46 34 31 38 41 45 32 30 40 32 34
19.15 6.78 2.00 2.00 7.00 11.48 11.73 9.99 7.00 4.00 3.00 2.00 2.50 1.00 2.00 1.75 9.00 6.50 8.61 7.26 5.50 6.50
5,545 1,814 193 2,984 11,724 18,890 17,080 13,033 8,845 5,552 3,288 2,205 1,593 874 356 257 13,158 6,106 8,970 7,400 6,277 7,280
53 41 54 50 37 32 31 27 34 44 47 55 44 61 43 49 37 29 27 33 35 31
All records
Table V. Association rules by grouping
file all identical rules were grouped together and any groups that did not contain a reference to the original “all” file were eliminated. This left a set of rules that showed not only how valid a rule was within the country as a whole, but how consistent it was within the standard metrics of age, gender and region. These results have been viewed in the context of the information systems currently used to manage the AIDS/HIV pandemic in Thailand. They have provided a completely new aspect on how the pandemic can be viewed from a management perspective. The current system (Epi-Info) is based purely on quantitative and statistical analysis and can report very well within those bounds. The results of using association rule analysis show how the various symptoms reported are related to each other in terms of one causing or leading to a second. This sort of knowledge is extremely valuable to the management teams as they can now take a particular symptom, see what effect it has on the population and how it can be either the cause or the end product of another symptom. This sort of information is not available to the management teams unless they either have the assistance of an experienced medical practitioner who has deduced these associations through their normal practice or undertake medical studies that will have to monitor these symptoms and report. Neither of these is as effective as the data mining technique, which can, not only deduce these rules from the data provided, but can reprocess the data in a very short time as the accumulated knowledge grows. This is a very new approach; as management teams no longer need to tie up the resources of experienced medical personnel assisting in interpreting the actual analysis. The personnel can be better deployed in using their domain knowledge to expand the prevention and treatment policies derived from these rules.
Data mining techniques
65
Total rule extraction This set out to view the entire database and derive a useable number of rule sets to discern the viability of this process. This study has shown that the rules derived from data mining takes the management teams into a new area of knowledge. The rules derived from the entire database were examined and some interesting facts immediately became evident. When we examine Table VI we can see where the most prevalent symptoms occur, and use the rule sets to see how they relate to other.
Symptom item Wasting syndrome (emaciation, slim disease) Mycobacterium tuberculosis, pulmonary or estrapulmonary Oral candiddiasis or hairy leukoplakia Fever for more than one month Pneumocytis carinii Cryptococcosis Cachexia or more than 10 per cent weight loss Diarrhoea for more than one month Asthenia for more than one month Persistent cough or any pneumonia more than two months (except TB) Persistent dermatitis for more than one month
Present in Rule head
%
Rule body
Both
21.52
24
17
41
16.46 16.46 12.66 10.13 8.86 5.06 5.06 1.27
19 19 13 11 9 4 4 1
13 13 10 8 7 4 4 1
32 32 23 19 16 8 8 2
1.27 1.27
1 1
1 1
2 2
Table VI. Association rules relative to occurrence
JEIM 21,1
66
To look at the most prevalent symptom wasting syndrome (emaciation, slim disease) it is related to 41 other symptoms, so the management teams can use this to determine policy and effective use of their limited resources. To look at the other end of the table, persistent dermatitis for more than one month is only present in two rules and this again provides valuable information – it may well be that the management teams have to take the harsh approach and not provide, beyond basic normal health care, any further resource for this symptom. This allows a new and novel approach to be taken by the management teams, if they now review the rules on an ongoing basis they can determine that are influential precursors of other symptoms that increase the requirements of the limited medical resources. Such an approach allows for a proactive targeting of the precursors, with the intention that they never move on to further symptoms. This in itself will help reduce the burden placed on a country’s limited resources. If this is combined with other strategies that disseminate the rule sets amongst those medical workers actually administering the care then they can be aware of potential dangers facing their patients, and take positive action to prevent this. Combining this with campaigns to prevent the original onset will reduce care requirements accordingly. Group related rule extraction This set out to determine if the rules derived for the total data store were consistent for any subset of the data, or if they varied as the data varied. This is a very important detail for the management team; as they need to know if the rules derived for the country as a whole are valid for anywhere within the country, or if they vary within region, age or gender. This study has shown that they do vary, sometimes considerably, as the various groups are examined. To look at two extremes of the results; first we have a rule that is only true for very specific sets, despite having a high confidence factor (Table VII): [Cryptococcosis] þ [mycobacterium tuberculosis, pulmonary or estrapulmonary] ! [wasting syndrome (emaciation, slim disease)]
It can be explained in a text form for all data as: Of almost 18 per cent of all patients, when a patient develops “cryptococcosis” and “mycobacterium tuberculosis, pulmonary or estrapulmonary” then the patient will develop “wasting syndrome (emaciation, slim disease)” in 79.7 per cent of these cases. However, this rule applies (with some significance) only to male patients in Region05 of the country. Therefore, targeting a particular region and only males within that region will significantly reduce the chances of [cryptococcosis] þ [mycobacterium tuberculosis, pulmonary or estrapulmonary] ! [wasting syndrome (emaciation, slim disease)] occurring and that there would be no need to do any more than issue an advisory notice to other health regions as long as this rule remains the same.
Table VII. Association rule with high confidence factor and low number of groups
Set All Male Region05
Population Support (%) Confidence (%) Type 423,989 308,455 20,347
18.05 16.63 5.58
79.65 76.49 63.87
Positive Positive Positive
Affected (%) Affected population 14.38 12.72 3.56
60,956 39,245 725
Compare this to a rule that is also confident, but was found to be applicable to almost every category (with 27 per cent support and 69.59 per cent confidence):
Data mining techniques
[Oral candiddiasis or hairy leukoplakia] ! [wasting syndrome (emaciation, slim disease)]
This shows how a rule can be applicable to the whole country and allows for a greater awareness throughout all medical centres that if a patient is showing the symptoms of “oral candiddiasis or hairy leukoplakia” they are highly likely to develop the symptoms of “wasting syndrome (emaciation, slim disease)”. There is another aspect that such a breakdown can highlight. The absence of elements at the group level means that the symptoms are only significant for the population as a whole, and that when viewed in smaller groups the significance drops accordingly. This is shown in Table VIII where the rules shown do not appear in any of the groups of age, region or gender, but do appear in the overall rule extraction. These absences again allow for interpreting the data in a manner that permits the management of resources to be optimised in a positive manner. The fact that these rules only occur in the overall population, but are not significant in the subset means that they can be treated at a lower level of priority due to the fact that they lose definition as they are applied to smaller groups. So the policies can be adjusted to place a lower emphasis on these rules in determining the practical application of resources. They would still be used as the basis for rules provision to medical practitioners and determining the key symptoms to target, however they would not be the focus of any campaign except where they were related to more significant rules that formed part of the campaign. For example there are 14 rules that have “pneumocytis carinii”, as part of the rule body, so the rule that [pneumocytis carinii] plus [oral candiddiasis or hairy leukoplakia] leads to [mycobacterium tuberculosis, pulmonary or estrapulmonary] would be used to supplement the resource management as an extra consideration. These examples then show how the limited resources available to a country can be targeted in specific cases. Any other rule can be extracted from the group analysis and interpreted in a similar manner, so the results of this can be combined with those of the total rule extraction; using the total rules to determine where the greatest opportunity for intervention is available, and then the finer detail of the grouped analysis permits a very precise targeting process to be initiated. This is something that previous reporting mechanisms have never discerned and would instead have targeted the resultant symptoms merely on the basis of “this is the largest problem, what can be done to reduce it?”. This study has provided an innovative view of the data store that permits them to now say “this is the largest problem, but it is mainly caused by these smaller problems, how can we prevent the smaller problems escalating the process?” Conclusions and further work The results of this study have shown that the information derived from clustering and association rule mining, can make a significant difference in the way that symptoms can be targeted. This alone will have a positive effect on the methodologies promoted to reduce the effects of the AIDS/HIV pandemic. The association rules themselves can be disseminated to medical workers, allowing them to anticipate and prevent further symptoms that would normally develop; at the same time, the abridged information provided to management teams will allow a better understanding and therefore improved strategies.
67
Table VIII. Association rules that appear in none of the sub groups
83.15
75.51
81.06
74.43
71.74
83.78
77.04
62.93
37.29
18.32
17.86
17.86
17.86
17.23
17.23
17.23
17.12
Confidence (%) [Pneumocytis carinii] plus [oral candiddiasis or hairy leukoplakia] [Pneumocytis carinii] plus [wasting syndrome (emaciation, slim disease)] [Pneumocytis carinii] plus [oral candiddiasis or hairy leukoplakia] [Pneumocytis carinii] plus [mycobacterium tuberculosis, pulmonary or estrapulmonary] [Oral candiddiasis or hairy leukoplakia] plus [mycobacterium tuberculosis, pulmonary or estrapulmonary] [Oral candiddiasis or hairy leukoplakia] plus [cryptococcosis] [Wasting syndrome (emaciation, slim disease)] plus [cryptococcosis] [Oral candiddiasis or hairy leukoplakia] plus [wasting syndrome (emaciation, slim disease)] [Mycobacterium tuberculosis, pulmonary or estrapulmonary]
Rule body
Rule head [Wasting syndrome (emaciation, slim disease)] [Oral candiddiasis or hairy leukoplakia] [Mycobacterium tuberculosis, pulmonary or estrapulmonary] [Oral candiddiasis or hairy leukoplakia] [Pneumocytis carinii] [Wasting syndrome (emaciation, slim disease)] [Oral candiddiasis or hairy leukoplakia] [Cryptococcosis] [Diarrhoea for more than one month]
Lead to ! ! ! ! ! ! ! ! !
68
18.32
Support (%)
JEIM 21,1
A disease is very dynamic in its effects and in the data needs it can generate. As soon as a disease approaches a size when it requires a dedicated management approach (such as that taken with AIDS/HIV) then it is vital to collate as much relevant data as possible, ensuring that management directives can be properly applied. This has become an urgent need; to collect and analyse systematically the information needed for the dual purpose of projecting epidemic trends and targeting prevention toward factors that seem to influence the vulnerability of the population to the further and possibly rapid spread of AIDS/HIV. During this study, we have determined that the clustering function provides for swift summaries of such information in an easily digested form. Therefore this research advocates the use of data mining as an approach that can be used to expedite the initial stages of information analysis in order that the results obtained may be more thoroughly investigated. This study can be adopted to implement a quality monitoring system. Regular applications of clustering can determine if the disease if affecting other categories of the population and also identify data collection and correctness issues. Regular application of association rule mining can determine if the strategies developed as part of a previous mining exercise are working and in addition to identify early if other symptoms become more prevalent and require prioritisation. As part of the mining process, outliers (attributes with data outside the general range) are identified. These are worthy of immediate investigation for two reasons. Firstly because they are indicators of poor data quality and this needs to be corrected as soon as it is identified. Effective data quality monitoring allows proactive detection and correction of data anomalies that otherwise might become a severe problem, e.g. if being discovered too late for easy correction or, even worse, if the deficient data has already been used for decision making. Secondly where they are investigated and found to be valid data, this is cause for concern as they show there is either unusually high or low instances of the reported symptoms. The higher reporting needs immediate action as there is obviously a greater problem in that case, the lower needs investigation as to why they are so low, e.g. is there a local practice that treats the symptoms more effectively than national methods.
References Agrawal, R., Mannila, H., Srikant, R., Toivonen, H. and Verkamo, A.I. (1996), “Fast discovery of association rules”, Advances in Knowledge Discovery and Data Mining, AAAI Press, Menlo Park, CA. Cabena, P., Hadjinian, P., Stadler, R., Verhees, J. and Zanasi, A. (1997), Discovering Data Mining: From Concept to Implementation, Prentice-Hall, Upper Saddle River, NJ. Center for Disease Control and Prevention (n.d.), “Epidemiology surveillance”, available at: www. cdc.gov Epidemiology Division (1998), Report of HIV Sero-Sentinel Surveillance from 1989-1997, Epidemiology Division, Ministry of Public Health, Nonthaburi. Faraggi, D. and Simon, R. (1995), “A neural network model for survival data”, Statistics in Medicine, Vol. 14, pp. 73-82. IBM (1999), “Using the intelligent miner for data”, IBM Publication No. SH12-6325-01, Armonk, NY.
Data mining techniques
69
JEIM 21,1
70
Jafelice, R., Barros, L., Bassanezi, R. and Gomide, F. (2002), “Fuzzy rules in asymptomatic HIV virus infected individuals model”, Frontiers in Artificial Intelligence and Applications, Vol. 85, pp. 208-15. Jafelice, R., Barros, L., Bassanezi, R. and Gomide, F. (2004), “Fuzzy rules in symptomatic HIV virus infected population”, Bulletin of Mathematical Biology, Vol. 66, pp. 1597-620. Krivan, V. and Colombo, G. (1998), “A non-stochastic approach for modeling uncertainty in population dynamics”, Bull. Math. Biol., Vol. 60, pp. 721-51. Kwak, N. and Lee, C. (1997), “A neural network application to classification of health status of HIV/AIDS patients”, Journal of Medical Systems, Vol. 21 No. 2, pp. 87-97. Lee, C. and Park, J-A. (2001), “Assessment of HIV/AIDS-related health performance using an artificial neural network”, Information and Management, Vol. 38, pp. 231-8. Murray, J. (1990), Mathematical Biology, Springer, Berlin. Novak, M. and Bangham, C. (1996), “Population dynamics of immune responses to persistent viruses”, Science, Vol. 272, pp. 74-9. Phoolcharoen, W. (1998), Experience of HIV/AIDS National Programme: The Evolution Learnt in Thailand, AIDS Division, Ministry of Public Health, Thailand. Corresponding author I. Petrounias can be contacted at:
[email protected]
To purchase reprints of this article please e-mail:
[email protected] Or visit our web site for further details: www.emeraldinsight.com/reprints