devices that have a connection through clothes that are being worn. Possible .... camcorder battery and mounted on the belt on the other side of the ... and destination stations only have a routing behavior and build up a transit network. ... messages and initialize the maximum hop count of their messages on the basis of the.
Data Paths in Wearable Communication Networks Christian Decker, Michael Beigl TecO, University of Karlsruhe, Vincenz-Priessnitz-Str.1, 76131 Karlsruhe, Germany {cdecker,michael}@teco.edu
Abstract. Wearable communication networks are a new type of networks where communication wires are embedded into textiles. It allows the connection between sensors and devices embedded into the material. Data from such devices can be sent over various pieces of clothing to other devices in the network. A special characteristic of such a network is the unreliable connection between different pieces of clothing. This paper presents a prototype system and investigates routing methods using simulations of a fabric area network. Input data for simulations are derived from the operation of a first working prototype. Among the investigated routing methods are various Flooding, Hot- Potato and Simple Hot-Potato protocols. Throughput, way lengths and delay times were used as metrics. Results indicate that routing can optimize the performance of the FAN for each metric, but not for all metrics.
1 Introduction We are in the maturing phase of an explosion in private devices that we can carry around with us or that are even attached to our body or clothing. Today these devices work standalone and are not interconnected. But with upcoming Ubiquitous Communication (Ubicomp) and Computing [W91] technology new applications will arise and existing applications will profit from enhanced knowledge transferred from other devices attached to us. Interconnection of such small devices is the goal of several novel technologies, especially RF based pico-networks like Bluetooth [S99] and body-networks. These systems have the disadvantage that they broadcast the information into the nearby environment [PAB00] and are therefore vulnerable for possible intruders. They also consume substantial quantities of energy compared to wire-based solutions. This paper concentrates on one special kind of network used for interconnecting devices that are worn or near the body. The Fabric Area Network (FAN) [H01] is a wire-based network embedded into textiles that allows secure and private transfer of data between all devices that have a connection through clothes that are being worn. Possible application areas of such networks are communication of sensors incorporated into clothing with a central computer, health applications with various independent devices (pacemaker, lifecare watch etc.) or blue color workers with pagers, scanners and special-purpose devices. This paper presents a system and its first outcome and finally simulations of a network implemented into the fibers of clothing. The paper concentrates on the problem of routing
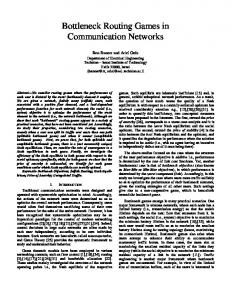
of packets in the network. For clothing, the intersection points can provide the connection between parts of the network and are therefore the places where routing and filtering of packets should be implemented. Various algorithms for routing are introduced and analyzed in this paper. The use of routing gives the possibility to control the workload and the power consumption of the stations and therewith the control over the workload of the entire network. The opportunity to decide which way data packets should go makes the network more powerful and more adaptable in the dynamic environment in which it resides. Characteristics of the network (e.g. packet loss, delay etc.) are derived from experimental prototypes that we had integrated into clothing and had them worn. In the next section, we go more into detail about the FAN. This is followed by the description of the FAN simulation architecture that we designed and implemented to test the network under different conditions and to test different routing strategies. We obtained reasonable parameters for link failures by measurements, which we describe in the following section. These parameters are used in a simulation of a wearable sensor network with some user interaction. We simulate different routing strategies while focusing on certain metrics like data loss, hop counts and delay times. Our results are presented in the last section. FAN – A Wearable Network The Fabric Area Network (FAN) introduces a concept of coupling of different pieces of clothing to make them interconnected for data transport. The prototype developed by Starlab [H01] is based on coils creating a strong limited electromagnetic field, which is modulated with data packets. A pair of two coils forms a simple sender/receiver system and is used as a FAN link (Fig. 1).
Fig. 1 FAN Link
Over these links, data is transported in packets of maximum 18 bytes with a transfer rate of 1000 bits/s. Before a data packet is transported, the hardware which drives the link has to power up the electromagnetic field and the sender performs a handshake procedure to detect the receiver. This causes a latency of 100 ms for each data packet.
FAN links reside in very dynamic areas where the parts they try to connect are loosely coupled. They are not wired links so it can be impossible to transport data for an undetermined timeframe or if a connection is reestablished it is not sure whether it will run over the same link. The driver hardware has to be very small because it is mounted within the clothes and like the links it is distributed all over the clothing. They have only small amounts of resources for computing power, memory and available energy whereas most of the energy is used for powering the links. The entire Fabric-Area-Network resides in a very dynamic area where data is transported over slow and unreliable links and hardware has strongly limited resources.
2 Simulation In order to understand the behavior of networks based on the FAN system, we developed a simulator. For it to be as flexible as possible regarding the property changes, we designed an architecture that embedded the simulator. This architecture is a test bed, which enables us to design, debug and evaluate various routing protocols. 2.1 Overview: The FAN Simulation Architecture The FAN simulation architecture consists of two distinct modules - the simulator kernel and the data processing module (see Fig. 2).
Simulator Output
Log File
Input
Data Processing
Fig. 2 FAN Simulation Architecture The simulator kernel is a discrete event simulator, so we have an exact trace of what happened at any time step. It is deterministic, so each simulation is reproducible. The Data Processing module is independent of the kernel's implementation and takes the Log Files as input to compute in respect of them the output we want (e.g. statistic data, plots, text,...). Every FAN simulation model, given as input to the kernel, is built upon 4 different components, which are identified as station, buffer, link, and network. The way each component acts during a time step is described by the component’s behaviors. We differentiate between dynamic and static behavior. A dynamic behavior can change during the run of the simulator. This is implemented by calling functions. On the other side the static behavior is fixed for the whole duration of the simulation and is implemented through parameter values. Tab. 1 lists the components and their behaviors.
Tab. 1 Behavior of Components
Component Station
Buffer Link
Network
Behavior Router behavior Producer behavior Consumer behavior Size Policy Bandwidth Latency half/full duplex size (number of stations) number of links owned by a station connectivity matrix (symmetric)
Character Dynamic Dynamic Dynamic Static Dynamic Static Static Dynamic Static Static Dynamic
The described architecture was implemented in Ptolemy II [DHK01] and tests showed that a network with the FAN properties (see section 1) could be simulated and ended up with the expected results. 2.2 Input Data The simulation architecture requires setting up the input behavior of all components. While this is easy for all static behaviors, it becomes a concatenation of assumptions for the dynamic behaviors. Especially, the network dynamic should be described as close as possible to reality, because it strongly influences routing decisions and therewith station performance and also network performance. But, the process of network dynamic is hard to describe appropriately by assumptions. The concept of functions as input behaviors for the simulator let us supply the simulator with measured data for the network behavior. Measurement of the Network Dynamic We chose the T-shirt-trousers region as a typical place where data has to pass through a FAN link (see Fig. 1) and where the network behavior is important. The FAN prototype with the coil-based links was not available. To measure the link reliability in this region we mounted two electrodes (size 10.5cm x 5cm) in this region. One is located on the Tshirt and the other one is located on the trousers in such a way, that they can close an electric circuit when the T-shirt touches the trousers. Whether the circuit is closed or opened is registered by the Beck IPC [B01], a small computer system powered by a camcorder battery and mounted on the belt on the other side of the measurement region. Electrodes and the IPC can be seen in Fig. 3, and Fig. 4 shows how the T-shirt’s electrode overlaps the electrode on the trousers. For the measurement we had a 4 minutes walk outside. During that time the IPC tested the circuit every 10 ms for the opened or closed state and saved it internally. At the end we had more than 24500 measured values.
Fig. 3 Measurement Setup(1)
Fig. 4 Measurement Setup(2)
Interpretation After the measurement, the next step was the interpretation, because these measured values were not obtained by the FAN prototype. The interpretation step converts them to the behavior of a FAN link. However, although this interpretation is based on assumptions, we are convinced that it describes the behavior of the network much more accurately than with a mathematical function.
One or more values indicating the same state of the circuit form a sequence. We then count how many measurement cycles the circuit was opened and closed. This is called a sequence length. These are signed to indicate the open or the closed state of the circuit. A short-time shift of the circuit's state does not mean a connection state change of a FAN link, because the electromagnetic field can transport data over a small distance. That's why we apply a high-pass filter, which kills all sequences smaller than 10, which is equivalent to a measurement timeframe of 100ms. This threshold was chosen according to the latency of 100 ms for every FAN link (see section 1). Fig. 5 shows the distribution of the relative frequency of occurrence of all measured sequences after applying the high-pass filter. Positive sequence lengths indicate a closed electric circuit, while negative lengths indicate an opened electric circuit.
5
4.5
Relative Frequency of Occurrence [%]
4
3.5
3
2.5
2
1.5
1
0.5
0 -150
-100
-50
0
50 Sequence Length
100
150
200
250
Fig. 5 Distribution of Sequence Lengths The measurement of network dynamic gave us a set of data, which was then supplied to the simulator as a part of the network behavior for FAN links in the T-shirt-trousers region.
2.3 Output Results: Sensor Network Simulation The aim of building a simulator (see section 2) and setting it up with input behaviors as close as possible to the reality (see section 2.2), is to get an experimental idea of how routing can improve the FAN. For this purpose we evaluate different routing protocols working in a model of a sensor network, which is distributed over different parts of our clothing. A sensor network is seen as an application, where effects on performance are easily traceable. Thereby we map a set of routing protocols to router stations. This mapping is called routing strategy. Our goal is to optimize the message distribution in respect to metrics like way lengths (hops), delay times, and message loss only by changing the routing strategy. Topology and Simulation Parameter Our sensor network consists of 3 sensors boards connected to a network of routers. Furthermore we have one source for user input. The topology can be seen in Fig. 6.
User Input R4
R8 Output
R3
R7
R9
Output
Sensor 3 R2
R6 FAN Link
R1
R5
Sensor 1
Sensor 2
R
Router
Fig. 6 Sensor Network Topology
Sensors boards are located on both shoes (R1, R5) and on the femoral (R9), which is a good place according to [LAL01]. Every 500 ms the sensor boards send a data packet of 8 bytes to their attached station, which adds a 6-byte header with source and destination address, message type number, and a maximum hop count (default value is 16). All messages are addressed to station R8, the user interface station, as the destination. The user itself can send commands as 3-bytes data packets to an attached device at R9. This is
done via a random generator to simulate a user’s behavior. Stations between the source and destination stations only have a routing behavior and build up a transit network. The FAN links between R1, R2 and R5, R6 are located in the shoes-trousers region while the FAN links between R2, R3 and R6, R7 respective R9, R7 are located in the T-shirttrousers region. In the latter case the measured data for network behavior (see section 2.2) are used to describe the behavior of these links. A random generator determines the behavior of the FAN links for the shoes-trousers region. However, they are connected for 95% of the runtime. The user interface is coupled by a FAN link over R8 to station R4, but its reliability is 100%. All FAN links are half-duplex links and have a bandwidth of 1000 bits/s and a latency of 100 ms. All other links which are not indicated as FAN links are half-duplex serial links with a bandwidth of 9600 bits/s. Each link has a send buffer organized in a FIFO policy with a size of 160 bytes. Previous simulations showed that this a good buffer size for data producers like our sensors. Each station is customized with a routing protocol, which we discuss in the section below. The simulation time is 30 hours to produce enough data packets to build stable statistics. Routing Protocols Router stations reside in a very dynamic environment, where data is transported over slow and unreliable links and hardware has strongly limited resources. These conditions affected our choice of proper routing protocols. Protocols building up routing tables are unsuitable, because of limited memory resources. A further problem is represented by protocols, which try to get a survey of the network. Because the network is too dynamic and bandwidth is very limited, it is hard for the protocol to converge in case of link state changes and routing tables must be often updated, which stress the entire network. We chose three routing protocols, which are simple to implement, rapidly come to a decision and do not use many resources. They do not build routing tables, nor do they use information about link states to come to a routing decision. The first protocol is Flooding Routing, which is often used because it always finds the shortest path, apart from the overhead it produces. Shoubridge [S96] made some detailed considerations about flooding. The second is the Hot-Potato protocol [B64] making its routing decision according to buffer fillings. The third one is a Hot-Potato Protocol, which comes to a routing decision according to a random generator, which decides to which link of the station the messages will be forwarded. This is called Simple Hot-Potato. While implementing these routing protocols, we discovered that the maximum hop count for every message plays a crucial role. Previous simulations showed that lots of resources were used by messages running in loops. We decided to extend all routing protocols for stations with consumer behavior by an announcement mechanism, which generates only a small overhead. These stations announce themselves with a special message. These announcement messages have a high maximum hop count, so that they can be transported over many stations. Stations with a producer behavior can evaluate such announcement messages and initialize the maximum hop count of their messages on the basis of the number of hops it took the announcement message to reach them. There is no fixed timeslot for a consumer station to send these announcement messages. This depends on the average hops it takes for messages to reach this station. If the average number of hops becomes too bad, then a new announcement message will be sent and producer stations will align the maximum hop count for their messages. The path that the message followed is not recorded because stations are not aware of the name of their neighbor stations.
Recording the traveled links is also not suitable because the states of the links are too dynamic and links are not reconnected to their same counterpart. Routing decision should be made within each station. The announcement mechanism optimizes very fast the setting of the maximum hop count in the messages. It is stable and also adaptable if the destination station moves. Routing Strategies To apply the previous introduced routing protocols to the sensor network (Fig. 6), we developed different routing strategies (Tab. 2), which map the protocol to every station with a routing behavior. The mapping bases on the knowledge of the domain and the task of the router stations. The routing behavior is changed for certain stations to investigate the performance of a certain routing protocol on critical junction points. Tab. 2 Routing Strategies
Routing Strategy 0
1
2
3
4 5 6
Router Station R2, R3, R4, R6, R7 R9 R1, R5
Routing Behavior
Flooding Routing Simple Hot-Potato Drop messages sent from the transit network R8 Takes off message from the transit network R2, R3, R4, R6, R7 Flooding Routing R9 Simple Hot-Potato R1, R5 Reflect messages back into the transit network R8 Takes off message from the transit network R2, R4, R6 Flooding Routing R3, R7 Hot-Potato R9 Simple Hot-Potato R1, R5 Drop messages sent from the transit network R8 Takes off message from the transit network R2, R3, R6, R7 Flooding Routing R4 Simple Hot-Potato R9 Simple Hot-Potato R1, R5 Drop messages sent from the transit network R8 Takes off message from the transit network Strategy 1 + 2 Strategy 2 + 3 Strategy 1 + 2 + 3
The strategy 0 uses the flooding algorithm for almost all router stations. Router stations R1 and R5 drop all messages from the transit network because they mark sources of packets. R8 takes all messages off the network because it is connected with only one link to the transit network. In strategy 1 we change the behavior of R1 and R5. They send the received messages back into the transit network. What we want to achieve is that the message drop rate at these stations decreases and that wrongly routed messages are sent back into the network while trying to reach their destination. The strategy 2 changes the routing behavior in R3 and R7 into the Hot-Potato routing. Two links are connected to each of these stations with a focus on redundancy. Changing the routing protocol into something else than Flooding will decrease the number of messages, which are sent back to R2 and R6. Here we are trying to support the forwarding to the destination station. And strategy 3 bases on the same idea but for R4. In this case we do not use Hot-Potato because not all links are equal in their behavior. Hot-Potato would prefer the links to R3 and R7 because they are faster than FAN links. So, we set R4 to Simple Hot-Potato. Strategies 4, 5, and 6 are combinations of the previous three cases. They will show whether a combination could increase the performance explicitly. In each combination the peculiarity of the participated strategies is taken. For instance strategy 4 combines the reflection capability of R1 and R5 from strategy 1 with the use of Hot-Potato in R3 and R7 from strategy 2. The combination of strategy 1 and strategy 3 is only used in connection with strategy 2, because in our opinion the influence on the result is not noticeable without the strategy 2. R2 and R6 are all the time set up with the Flooding Protocol. That provides redundancy on the way to R3, R7. The router station R9 uses in all strategies the Simple Hot-Potato routing protocol. Flooding would discriminate the other sensor sources and Hot-Potato would prefer the link to R8. But, the injection of data packets should be fair for all sensor sources. Fig. 7, Fig. 8, and Fig. 9 show the results of the simulator runs referring to the metrics average delay times, average hops, and relative amount of received messages. In the upper plot of each figure these metrics are plotted for each strategy, which uses the routing protocols implementing the announcement mechanism. The lower plot of each figure shows the plot of the metrics, which is based on the routing protocols but without implementing the announcement mechanism.
11 10 9
Average Delay Time[s]
8 7 6 R5->R8 5 4 R1->R8 3 R9->R8 2 R8->R9 1 0 0
1
2
3 Routing Strategy
4
5
6
11 R5->R8
10 9 8
Average Delay Time[s]
R1->R8 7 6 5 4
R9->R8
3 2 R8->R9
1 0 0
1
2
3 Routing Strategy
4
Fig. 7 Average Delay Time
5
6
5.5
Average Hops
5
4.5 R5->R8
4
R8->R9
R1->R8
3.5
3 0
R9->R8 1
2
3 Routing Strategy
4
5
6
5
6
5.5
5
Average Hops
R5->R8
4.5 R1->R8 R8->R9 4
R9->R8
3.5
3 0
1
2
3 Routing Strategy
4
Fig. 8 Average Number of Hops
0.9
0.8
Relative Amount of Received Messages
0.7
0.6
0.5
0.4
R8->R9
0.3
R9->R8
0.2
0.1
0 0
R1->R8
R5->R8
1
2
3 Routing Strategy
4
5
6
0.9
0.8
Relative Amount of Received Messages
0.7
0.6
0.5
0.4
R8->R9
0.3 R9->R8 0.2 R1->R8 0.1 R5->R8 0 0
1
2
3 Routing Strategy
4
Fig. 9 Relative Amount of Received Messages
5
6
Evaluation of Routing Strategies The first point we state is that the announcement mechanism works in the way it was designed for. For all strategies, it reduced delay times and optimized the number of hops for the messages according to their destination. This can be seen in Fig. 7 and Fig. 8. The effects of different strategies can also be seen in each metric. The strategy 0 is the socalled reference strategy. It shows how the network behaves when simply every message is sent to every station. Especially junction points like R3, R4, and R7 were sometimes heavily loaded and overloaded which result in higher delay times for instance. The strategies were developed to have a positive effect on all metrics. This only partially worked. In strategy 1, R1 and R5 should reflect misrouted messages back into the transit network. While R5 could benefit from that and more messages from Sensor2 reached their destination, the throughput from Sensor3 broke down (Fig. 9, upper plot). The delay times increases as expected, but send buffer fillings in the same way. So, router stations, especially R2 and R6, were sometimes heavily overloaded and had to drop messages, for instance messages from R9. With strategy 2, we wanted to decrease the production of more duplicated messages than already produced by the use of Flooding in R2 and R6. But, with Hot-Potato for R3 and R7 in this strategy there are misrouted messages, but no duplicates anymore, which might be on the shorter way to the destination. Because of the hop counter optimization caused by the announcement mechanism, misrouted messages where dropped quickly and fewer messages reach their destination (Fig. 9, upper plot). When the mechanism was not active some messages could benefit from a longer lifetime and got the chance of being sent back on the right way (Fig. 9, lower plot). In general, delay times and number of hops could be reduced (Fig. 7 and Fig. 8). In strategy 3 we tried to decrease the number of duplicated messages at router R4 - a central point every message has to pass to reach its destination. The routing behavior was set to Simple HotPotato to reduce number of duplicates in the send buffers of R4. But we achieved a poor performance. Many messages were misrouted, delay times and hops increased and fewer messages reached their destination. The combinations of routing strategies also performed only partly well. While strategy 4 and 5 performed much better for delay times and number of hops (Fig. 7 and Fig. 8), they performed even worse than the single strategies referred to throughput in Fig. 9. Finally, we consider the trend of the curve for the R9-R8 route in Fig. 9. The throughput for this route in the upper plot of Fig. 9 achieves around half of the one in the lower plot. The reason for that is the announcement mechanism. It optimized the hop counter for the route over R7 to the destination R8, because it is shorter than the route over R6 (see Fig. 6). But, the R9 station works with Simple Hot-Potato protocol, which distributes messages uniformly over both routes. So, for half of the messages the hop counter exceeded its maximum value and they were dropped when routed over R6. For all simulated strategies, there is no one method or combination of methods, which can be declared as an overall winner. It mainly depends on the focus. If the focus is on the messages reaching their destination, then strategy 0 (the flooding strategy) with the announcement mechanism performs best. However, with the focus on the delay times and way length (hops), the combination in strategy 5 (see Tab. 2) performs best. But it has a poor performance when considering the throughput.
3 Application Area and Related Work The network is part of our ongoing research in supporting Ubiquitous Computing applications with local communication. Although applications are in the center of this research, several types of networks (wired and wireless) are developed, tested and enhanced for the use in applications. Protocols supporting these applications include the RAUM protocol [HB00]. This protocol is used for interconnecting (existing) devices equipped with computer and communication technology. In the MediaCup [BGS01] prototype RAUM is used for ISO/OSI layer 3 communication while infrared based IrDA, proprietary radio-frequency and Controller Area Network (CAN) provide functionality of layer 2 and 1. A similar research project is Roy Want’s ParcTab network and application at XeroxParc [WSA97], the first prototype in Ubicomp generally. So-called pico-networks may also be useful in this application area. Such networks allow devices to communicate to other devices nearby mainly in range of 2 to 10 meters. Bluetooth [S99] for example provides a standardized communication platform for nearby electronic devices, e.g. mobile phones and personal digital assistants. Because of the allpurpose communication stack Bluetooth adds some complexity to a device. AT&T Cambridge Research Lab has developed a very low power network (Pen, [BCE97]). Power management is a key issue in Ubiquitous Computing and this network is specially dedicated to applications with small devices that have to save as much power as possible. Research on Mobile Ad-Hoc networks (e.g. MANET of the IETF) focuses on the transmission of information over a larger distance through routing with a changing and unknown topology of the participating network nodes. A way to interconnect devices attached to the body is provided by body networks. [PAB00] presents a system prototype with data rates up to 56 kbaud per second. Radiation to the outside and effects on vital devices (e.g. pacemakers) are still subject to research here. Other ways to interconnect devices on the body are Fiber fabrics, where communication lines, sensors and computing units are embedded into the fiber or constructed by interweaving the fibers. Examples are the FICOM research in the Disappearing Computer call of the European Union (www.disappearing-computer.org) or work at the MIT on Washable Computing (e.g. [PO97]).
4 Conclusion and Future Work This paper presented a prototype system and investigates routing methods in the Fabric Area Network. For this purpose we developed a simulator supplied by measured data to design, debug, and evaluate different routing protocols. We chose Flooding, Hot-Potato and Simple Hot-Potato as routing protocols, which met the requirements in sense of simplicity, robustness and speed. To optimize the maximum hop counter we added an announcement mechanism for consumer stations. Simulations showed that the performance is improved by the use of routing protocols. But, the choice of an appropriate routing protocol depends on the metric that the focus is on. Throughput, way lengths and
delay times were used as metrics. Results showed that routing can optimize the performance of the FAN for each metric, but not for all metrics. Our simulations and tests have indicated that the introduction of domain specific knowledge enhances the overall performance of the system. The topology of the system is known to some extent and also the needed quality of service can be obtained from some nodes. So, sophisticated routing algorithms may be an option to the current more simple protocols. Although it is not clear if the overhead generated by such a protocol relates to the performance gain. One goal for the future is to simulate these more complex networks where links can be reconnected on routers that were not connected beforehand. Furthermore the whole concept of coil-based communication should be replaced by contact oriented links as they were used in section 2.2. The higher rate of breaks of links can maybe be compensated by the bandwidth that is many times higher. Then protocols with more overhead and higher complexity become also more interesting. In addition, extensive application testing will provide us with more data to be fed into the simulator. It also allows us to evaluate the usefulness of the network in real settings.
5 Acknowledgements We would like to thank the people from the i-Wear team at the former Starlab for supporting our work by their great cooperation. A special thank goes to Kristof Van Laerhoven, Ozan Cakmakci and Francois Galilee.
References [B64] Baran, P., 1964. On Distributed Communications Networks. IEEE Transactions on Communications. pp.1-9 [B01] Beck IPC GmbH 2001. Single Chip Embedded WEB-Server. Available from: http://www.bcl-online.de/ [Accessed 09/14/01] [BGS01] Beigl M., Gellersen H., Schmidt A. MediaCups: Experience with Design and Use of Computer-Augmented Everyday Objects, Computer Networks, Special Issue on Pervasive Computing, Elsevier, Vol. 35, No. 4, March 2001, Elsevier, pp 401-409 [BCE97] Bennett F., Clarke D., Evans J.B., Hopper A., Jones A., Leask D. Piconet: Embedded Mobile Networking, IEEE Personal Communications, Vol. 4, No. 5, October 1997, pp 8-15 [DHK01] Davis J. II, Hylands C., Kienhuis B., Lee E.A., Liu J., Liu X., Muliadi L., Neuendorffer S., Tsay J., Vogel B., Xiong Y. 2001. Heterogeneous Concurrent Modeling and Design in Java. [Online]. University of California, Berkeley, CA USA. Available from: http://ptolemy.eecs.berkeley.edu/ptolemyII/ [Accessed 09/14/01]. [H01] Hum, A.P.J. 2001. Fabric area network - a new wireless communications infrastructure to enable ubiquitous networking and sensing on intelligent clothing. Computer Networks. 35, pp.391-399 [HB00] Hupfeld F., Beigl M. Spatially aware local communication in the RAUM system. Proceedings of the IDMS, Enschede, Niederlande, October 17-20, 2000, pp 285-296 [LAL01] Laerhoven, K. Van, Aidoo K., Lowette S., 2001. Real-time analysis of Data from Many Sensors with Neural Networks. Proceedings of the fourth International Symposium on Wearable Computers (ISWC) Zurich, 7-9 October 2001. IEEE Press.
[PAB00] Padridge K., Arnstein L., Boriello G., Whitted T. Fast Intrabody Signaling, 3rd IEEE Workshop on Mobile Computing Systems and Applications (WMCSA) Monterey, 7-8 December, 2000 [PO97] Post E., Orth M., Smart Fabric, or Washable Computing. 1st IEEE International Symposium on Wearable Computing, Cambridge Massachusetts, 13-14 October 1997, pp. 167-168 [S96] Shoubridge, P.J. 1996. Adaptive Strategies For Routing in Dynamic Networks. PhD thesis, University of South Australia. [S99] D. Sonnerstam (Hrsg.) Specification of the Bluetooth System Version 1.0 B, Bluetooth SIG; Dezember 1999 [WSA97] Want R., Schilit B., Adams N., Gold R., Goldberg D., Petersen K., Ellis J., Weiser M. Mobile Computing , Kluwer Publishing, Edited by Tomasz Imielinski, Book Chapter 2, pp 45-101, ISBN 0-7923-9697-9, February 1997. [W91] Weiser M. The Computer for the 21st Century, Scientific American, September 1991 Vol. 265 No. 3, pp 94-104